
Final Report
August 31, 2009
Tabled and approved at Departmental Evaluation Committee on October 30, 2009
Table of Contents
- Executive Summary
- 1.0 Introduction
- 2.0 Evaluation study
- Evaluation Findings
- 3.0 Relevance
- 4.0 Success
- 5.0 Cost Effectiveness
- 6.0 Program Delivery
- 7.0 Other Observations
- 8.0 Recommendations
- Bibliography
- Management Response and Action Plan
Executive Summary
This report presents the results of the 2009 evaluation of the Canada Small Business Financing (CSBF) Program.
In accordance with the Canada Small Business Financing Act, a Comprehensive Review of the provisions and operation of the Act must be tabled in Parliament by March 31, 2010 for the period from April 1, 2004 to March 31, 2009. This evaluation study will contribute to the Comprehensive Review requirements.
Purpose of the Program
The Canada Small Business Financing Program is a loan loss sharing program which facilitates loans to small businesses who might not otherwise qualify for a conventional loan. Term loans are eligible under the CSBF Program for the specific purposes of financing the purchase of land, buildings, or equipment, or, to improve buildings (including leasehold improvements) and equipment.
In partnership with financial institutions who offer the program on behalf of the federal government, the CSBF Program shares the burden of risk with lenders by sharing in losses that may be experienced as a result of extending financing to SMEs who might not otherwise qualify for a conventional loan.
Industry Canada administers the CSBF Program, registers loans, collects fees and pays lenders eligible portions of losses on default loans, but is not involved in assessing individual loan applications. It is lender's responsibility to approve and administer loans, as well as disburse loans.
In addition to its primary goal of facilitating financing for small businesses, the CSBF Program has two official objectives:
- Incrementality: the program's effectiveness in extending financing that would otherwise have been: unavailable to small businesses; available but for smaller amounts; or, available only under less attractive conditions such as higher fees, higher interest rates, more collateral required, less timely, etc.; and
- Cost recovery: means that the CSBF Program's revenues will offset claims on defaulted loans.
Evaluation Approach
The evaluation has employed a synthesis approach of qualitative and quantitative evidence. Many pieces of research, which form the basis of this evaluation, were conducted by independent third parties using acceptable social science research methods.
The evaluation study was managed by the Audit and Evaluation Branch of Industry Canada. The evaluation was conducted by KPMG, and the team was led by the Associate Partner of Advisory Services, who had been involved in the 2004 CSBF Program evaluation. In addition, one AEB resource participated in the conduct of the interviews with lenders. The evaluation was done in consultation with a Steering Committee established for the purpose of the evaluation. (See Annex A for a list of Steering Committee members).
The following evaluation methodologies were employed in this evaluation:
- Analysis of available data and documents
- Stakeholder Interviews
- Risk Assessment Workshop
- Cost Benefit Analysis
Findings and Recommendations
Findings
Relevance
Industry Canada's delivery of the CSBF Program is consistent with its mandate and Government directions.
There is limited evidence to support a widespread belief that there is an SME financing gap. There is no evidence to indicate that SMEs have more difficulty obtaining financing than larger firms simply because they are SMEs—i.e., SMEs are not disadvantaged relative to larger firms.
However, firms that are higher risk with regard to their likely ability to repay loans do have more difficulty obtaining financing than lower risk firms, and many SMEs, such as start-ups, fall into this high risk category. The main factors that influence lenders to offer the CSBF Program to potential borrowers are lack of collateral and small size of firm. Therefore a gap appears to exist for very young businesses with limited experience, lack of collateral and which have a high credit risk score. As a result, the CSBF Program fills a marketplace financing gap for these types of firms.
There are no other federal programs that duplicate the CSBF Program for SMEs. The Business Development Bank of Canada, a federal Crown corporation, and a lending organization, provides SMEs with financing through "Term Loans" and," Subordinate Financing" which are similar to the term loans guaranteed under the CSBF Program, and thus there is some overlap between the two.
There are substitute programs for specific targeted SME populations such as rural entrepreneurs, and/or for specific reasons, such as commercialization. Federally, the closest substitute program is the Community Futures (CF) Program, funded by the Regional Development Agencies (RDA) and Industry Canada, but delivered through community not-for-profit organizations. The CF program is targeted towards rural SMEs, which represent 33% of the portfolio of borrowers under the CSBF Program.
All provinces have various types of assistance programs targeted towards SMEs. Seven provinces offer a loan guarantee program to SMEs, similar to that of the CSBF Program.
In addition to government programs, there has been greater availability and accessibility to various credit options through conventional lenders over the past ten years.
Success
Since 2004, the levels of incrementality achieved by the CSBF Program have been maintained, and have steadily increased, from a rate of approximately 75% to a rate of 80–85% in 2007.
In several key areas, CSBFP borrowers outperform comparable SMEs who have not received a CSBFP loan. SMEs who are CSBFP borrowers have consistently higher levels of business survival compared to non-CSBFP borrowers. They are able to increase their business investments (total assets) at a faster pace when compared to non-CSBFP borrowers. Their companies also experience higher levels of sales growth.
CSBFP borrowers experience greater employment growth compared to non-CSBFP borrowers, and their employment levels increase at a faster pace. There does not appear to be an impact on profits as a result of obtaining a CSBFP loan.
In spite of the benefits experienced by businesses that receive a CSBFP loan, there has been a steady decrease in the number of loans made over the life of the CSBF Program. A drop from 17,741 loans in fiscal year 1999–2000, down to 9,015 loans during fiscal year 2007–2008, represents a decrease of 49.2%. The reasons for this drop are not well defined but are partially as a result of lenders' experiences and some dissatisfaction with the program. Lenders perceive the program as not profitable, and some lenders have decided not to offer the program after negative experiences with CSBFP loan claims. Borrowers themselves have a low level of awareness of the CSBF Program and rarely request the program.
The factors that pose the greatest risk to the CSBF Program's ability to achieve its objectives and intended impacts are related to lender perceptions and behaviour:
- the risk that the program is not perceived to be an attractive vehicle by the lenders due to program design features (e.g., high administrative requirements)
- the risk that the internal policies and actions of individual lenders may impair the program's ability to achieve its goals.
Cost Effectiveness
The CSBF Program, as it is currently structured, is not cost recoverable when administration and registration fees are the only revenues used in the calculation. However, it can be considered cost-recoverable over the study period when incremental federal income taxes and GST generated by CSBFP borrowers are considered.
The CSBF Program generates significant net benefits for Canada as a result of the impacts of incremental CSBFP loans on the economy. The estimated benefits of the program far outweigh the program costs. Total net benefits of the program, including both direct and indirect benefits are estimated to be $4,869.7 million over a nine year period of study between 1999–2000 and 2007–2008.
Program Delivery
Lenders have identified a heavy administrative burden, which includes a paper-based system, and difficulties with the claim process, as major obstacles to their use of the CSBF Program. These factors have also been identified as the biggest risk to the program. The cap on fees has also caused lenders to reconsider using the CSBF Program, as it is not profitable to them.
Overall, there is very limited knowledge of the program by CSBFP borrowers and non-borrowers.
Marketing efforts by the program have been limited, and there has been reluctance on the part of head offices of lending institutions to allow the program to approach individual branches. However, lenders interviewed felt that the level of awareness of the program by lending officers is average to good. As program staff are not able to market directly to loan officers, this may contribute to the decreasing number of loans.
Recommendations
As a result of the findings of this evaluation, there are opportunities for improvement in areas of Program Design, Delivery and Measuring Success.
Program Design and Delivery
Since the current program parameters were put in place in 1999, the number of loans under the program has fallen by 49%, and the total value of loans within the program portfolio has also decreased. Both lenders and program staff perceive that the largest risk to the program is that it is increasingly perceived to be an unattractive vehicle by the lenders due to program design features.
Recommendations:
- 1. Given that both borrowers' representatives and lenders during the interviews supported expanding the asset classes; consider the possibility of broadening the range of assets against which a CSBFP loan can be made, thereby increasing the attractiveness of the program to both lenders and borrowers.
- 2. Measures should be put in place that would make the program more appealing for the lenders to offer. These measures could include: providing increased flexibility regarding administration fees and interest rates; lowering the administrative burden for lenders, by assessing the feasibility of establishing an automated system for registration and claims in order streamline those processes; and considering whether a risk-based approach might be applicable to ensure the accuracy of claims. These measures should be balanced and should consider the impact on the borrower.
- 3. Increase communication with lenders and undertake more pro-active marketing of the program to the lending community. During the interviews, lenders placed particular emphasis on obtaining information about the program itself but more importantly about the types of expenses that are eligible for a claim. Providing lenders with an understanding of eligible claims would reduce their frustration with the claims process and may increase utilization of the program.
Measuring Success
The CSBF Program has two objectives – incrementality and cost-recovery. These objectives have an inverse impact on each other. The higher the incrementality of the program, the riskier the portfolio becomes, which leads to a higher incidence of claims. This decreases the ability of the program to achieve a high percentage of cost recovery. Within this context, the program is meeting these objectives as well as could be expected, and significant economic benefits are being generated to the Canadian economy.
The program is relevant; an incrementality rate of between 75–85% indicates that the Program is providing loan guarantees to SMEs who would be unlikely to receive a conventional loan. The Program appears to be successful as the CSBFP borrowers have been able to achieve a higher level of economic performance than a comparator group of non-CSBFP borrowers with similar characteristics. Because the program has a relatively high level of incrementality, it also faces high levels of risk.
Since its inception, the CSBF Program has not been cost recoverable. The cost recovery rate has been forecasted at 67.7% for the first cohort (1999–2004) and 58.9% for the second cohort (2004–2009).
Between the high level of incrementality that the program has attained and the fact that the loan portfolio is riskier since 2004, it is anticipated that the gap between claims and fee revenues will continue to exist and most likely expand.
Recommendations:
- 4. Review the program's cost recovery objective, given that the program has not been fully cost recoverable. In reviewing this target, consideration must be given to the balance between potential burden on borrowers, profitability for lenders and government accountability.
- 5. When communicating the results of the CSBF Program in the Annual Reports, care should be taken in presenting the job creation numbers estimated by borrowers at the time of the loan application, given the discrepancies between those and actual realizations.
List of Acronyms and Definitions
| BDC | Business Development Bank of Canada |
| CFIB | Canadian Federation of Independent Business |
| CSBFA | Canada Small Business Financing Act |
| CSBF Program | Canada Small Business Financing Program (used when referencing the Program itself) |
| CSBFP | Canada Small Business Financing Program (used when referencing various elements of the Program, such as loans or borrowers) |
| FDI | Financing Data Initiative |
| FTE | Full-time equivalent (usually used in relation to jobs) |
| OAG | Office of the Auditor General of Canada |
| SBTB | Small Business and Tourism Branch (of Industry Canada) |
| SBL program | Small Business Loans program |
| SMEs | Small and medium-sized enterprises |
| SBFD | Small Business Financing Directorate (of Industry Canada, responsible for the administration of the CSBF Program) |
| RMAF | Results-based management and accountability framework |
Definitions
Small businesses: Statistics Canada defines small businesses as enterprises having annual revenues between $30,000 and $5,000,000. The CSBF Program is restricted to small businesses with less than $5 million in gross annual revenues. Official documents produced by the CSBF Program use the terms small business and SME interchangeably when referring to borrowers under their program.
SME: Small and medium sized enterprises. Statistics Canada defines SME as enterprises with less than 250 employees and less than $50 million in total revenue.
SME-FDI Survey: Statistics Canada surveys enterprises with fewer than 500 employees and less than $50 million in revenues.
Industrial Sector: Statistics Canada classifies industrial sectors under the North American Industry Classification System (NAICS) Canada, 20071. Under the two digit first level classification, Accommodation and Food Services, is the three digit lower classification entitled Food Services and Drinking Places. Official documents produced by the CSBF Program use the term Food and Beverage Services. Both terms are used in this document depending upon the source referenced, and represent the same sector.
1 http://www.statcan.gc.ca/concepts/industry-industrie-eng.htm (Return to Reference 1)
1.0 Introduction
This report presents the final results of the 2009 evaluation of the Canada Small Business Financing (CSBF) Program. This evaluation is an element of the comprehensive review of the program, which the program is required to table in Parliament, every five years under the Canada Small Business Financing Act.
1.1 Program Description
The Canada Small Business Financing Program facilitates loans to for-profit small and medium enterprises (SMEs). It is a statutory program governed by the Canada Small Business Financing Act (CSBFA), which came into force on April 1, 1999, replacing the Small Business Loans Act (SBLA).
In the context of the CSBF Program, an SME2 is defined as "a for profit small and medium size businesses in Canada with gross revenues or projected revenues of less than $5 million". These businesses can be corporations, sole proprietors, or partnerships, but exclude farming businesses. The Program adopts a more restrictive definition of SMEs than the broader definition used in the Statistics Canada SME-FDI survey which is, enterprises that have fewer than 500 employees and have annual gross revenues of less than $50 million.
The objective of the Canada Small Business Financing Program is to facilitate access to asset-based debt financing that would otherwise have been unavailable to SMEs for the establishment, expansion, modernization and improvement of small and medium-sized enterprises.
The CSBF Program relies on a partnership with private lenders to deliver the program, as it is private lenders who provide the funding directly to borrowers. Industry Canada administers the CSBF Program, registers loans, collects fees and pays lenders eligible portions of losses on default loans, but is not involved in assessing individual loan applications. It is lender's responsibility to approve and administer loans, as well as to disburse loans.
In fiscal year 2007–2008, the CSBF Program helped SMEs obtain over 9,000 loans with a value of over $1 billion. Since 1999, almost $10 billion in loans has been made3.
The program has two specific objectives:
- Incrementality: the program's effectiveness in extending financing that would otherwise have been unavailable to small and medium-sized businesses, available but for smaller amounts or, available only under less attractive conditions such as higher fees, higher interest rates, more collateral required, less timely, etc.…
- Cost recovery: means that the CSBF Program's revenues will offset claims on defaulted loans.4
For the period under review, the main parameters that define the structure of the program are listed in the following table.
| Parameter | Description |
|---|---|
| Eligible businesses | For profit enterprises (except "agricultural industries") with estimated gross annual revenues of $5 million or less. |
| Loss-sharing ratio | 85% government, 15% lender |
| Cap on lender claims | The government's liability to an individual lender is to pay eligible claims on defaulted loans in it account up to a maximum of the aggregate of: 90% of the first $250,000 of loans registered by the lender 50% of the next $250,000 10% of all loans in excess of $500,000. |
| Ministerial Cap on Claims (for each 5 year lending period) | $1.5 billion |
| Eligible purposes | Purchase or improvement of real property and immovables Purchase of leasehold improvements, Improvements to leased property. Purchase or improvement of new or used equipment. |
| Maximum loan amount | $250,000 for equipment, leasehold improvements, and real property. |
| Financing rate | 90% |
| Payment terms | Maximum of 10 years |
| Registration fee | 2% of the total amount loaned under the program (can be financed as part of the loan). |
| Administration fee (annual) | 1.25% of outstanding loan amount (paid quarterly). |
| Maximum rate of interest | Variable rate: maximum chargeable is the lender's prime lending rate plus 3% (which includes the 1.25% administration fee). Fixed rate: The maximum chargeable is the lender's single family residential mortgage rate plus 3% (which includes the 1.25% administration fee). |
1.2 Program History
The Government of Canada started assisting small businesses under the Small Business Loans program, which was launched in 1961. From that time until 1993 the program remained relatively stable and also relatively modest. Only companies with under $250,000 in sales were eligible at the beginning of the program; this increased slowly over the years to $2 million in 1985. The maximum loan size started at $25,000, reached $100,000 in 1980, and remained at that level until 1993. A number of changes were made to the program in 1993 in order to extend its coverage. This was in response to economic difficulties and uncertainty being experienced in Canada at that time and a commitment by the government that it would help small businesses lead the way to recovery.
Several of these changes resulted in increased risk to the government and the likelihood of a larger gap between fees paid to the government (the registration fee only at that time) and the cost of claims paid by the government. These changes included:
- expansion of program eligibility to encompass firms doing up to $5 million of business per year;
- Government coverage of 90% of the cost of claims (up from 85%);
- increase to 100% from 80%–90% of the cost of assets that could be financed, and
- increase in the maximum loan size to $250,000 (up from $100,000).
Not surprisingly, the number of loans skyrocketed, as did the number of loan defaults and claims a few years later.
In 1995 the most significant of these changes were reversed—in particular, the government's guarantee was decreased to 85%, and maximum financing levels returned to 90% of asset value. In addition, the government introduced a cost recovery mandate and began to move toward an increased degree of cost recovery by introducing the annual administration fee of 1.25%. Some additional changes were made in 1999, largely as a result of the comprehensive review of the program undertaken in 1998–99. These were intended to increase the accountability of lenders and strengthen the program's ability to move toward cost recovery. The program was renamed the Canada Small Business Financing program at that time.
Changes to Program Parameters—Budget 2009
The 2009 federal budget changed some of the parameters of the CSBF Program. Three major changes include:
- An increase in the maximum eligible loan amount a small business can access under the Canada Small Business Financing Program for loans made after March 31, 2009. The new limits are $350,000 for equipment and leasehold improvements, and, $500,000 for real property
- An increase in the losses reimbursement limit for institutions with a portfolio of eligible loans above $500,000. The rate has gone up from 10% to 12%.
- In addition to the program modifications, regulatory amendments will reduce the program's associated paperwork burden.
These changes were enacted on April 1st, 2009, after the completion of the lending period being reviewed in this evaluation.
top of page1.3 Current CSBF Program—Loans and Claims
Number of Loans5
Overall, between 1999 and 2008, the number of loans granted has decreased by almost 50%. From a maximum of 17,741 loans in 1999–2000, the number of loans reached its lowest point in 2007–2008 with 9,015 loans, a reduction of almost 50%.
Year over year, the rate of change in the number of loans is negative with the exception of two slightly increases in fiscal years 2002–2003 (2.24%) and, 2004–2005 (0.52%).
The table below presents the evolution in the number of loans during the period 1999–2008.
| Fiscal Year | Number of Loans | Number of Loans—Yearly Change (%) |
|---|---|---|
| 1999–2000 | 17,741 | |
| 2000–2001 | 14,442 | -18.60% |
| 2001–2002 | 11,016 | -23.72% |
| 2002–2003 | 11,263 | 2.24% |
| 2003–2004 | 11,085 | -1.58% |
| 2004–2005 | 11,143 | 0.52% |
| 2005–2006 | 10,790 | -3.17% |
| 2006–2007 | 9,596 | -11.07% |
| 2007–2008 | 9,015 | -6.05% |
| Total | 106,091 |
Average Size of Loans6
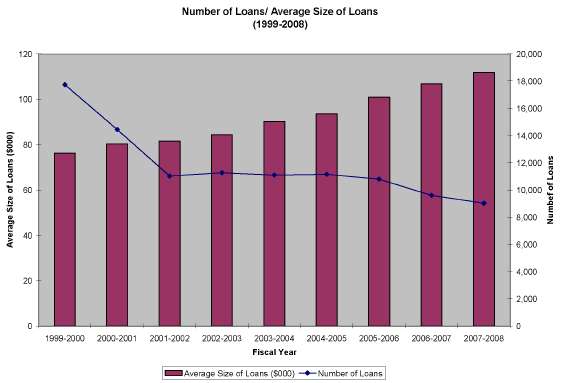
At the same time as the number of loans decreases, the average loan amount has increased. Between 1999 and 2008, the average size of a loan has moved from $76,200 to $111,700, an increase of 46.6%. Between fiscal year 1999–2000 and 2007–2008, the average size of loans has consistently increased every single year.
The table below presents the evolution of the average size of loans between 1999 and 2008.
| Fiscal Year | Average Size of Loans ($000) | Average Size—Yearly Change (%) |
|---|---|---|
| 1999–2000 | 76.2 | |
| 2000–2001 | 80.3 | 5.38% |
| 2001–2002 | 81.6 | 1.62% |
| 2002–2003 | 84.4 | 3.43% |
| 2003–2004 | 90.2 | 6.87% |
| 2004–2005 | 93.5 | 3.66% |
| 2005–2006 | 100.8 | 7.81% |
| 2006–2007 | 106.8 | 5.95% |
| 2007–2008 | 111.7 | 4.59% |
The contradictory trends (number of loans decreasing vs. the average amount of loans increasing) can be seen in the following chart. The time frame covered is between fiscal year 1999–2000 and fiscal year 2007–2008.
Value of Loans7
Contrary to measures such as the number of loans and the average size of loans, the overall value of loans has not followed a definite trend. The annual total value of loans declined during the fiscal years 2000–2001 (14.3%) and 2001–2002 (22.4%), but, increased steadily between fiscal years 2002–2003 and 2005–2006 (an overall increase of 20.9% between those two fiscal years). In the last two fiscal years, the value of loans has decreased, at a rate of 5.8% for the 2006–2007 fiscal year and, 1.8% for the fiscal year 2007–2008.
The following chart shows the evolution of the total value of loans compared to the number of loans between fiscal years 1999–2000 and 2007–2008.
top of page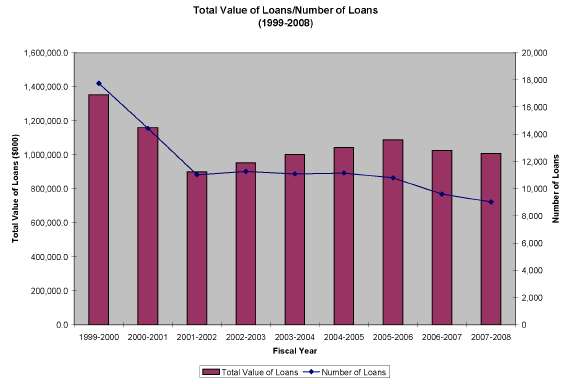
Number of Claims
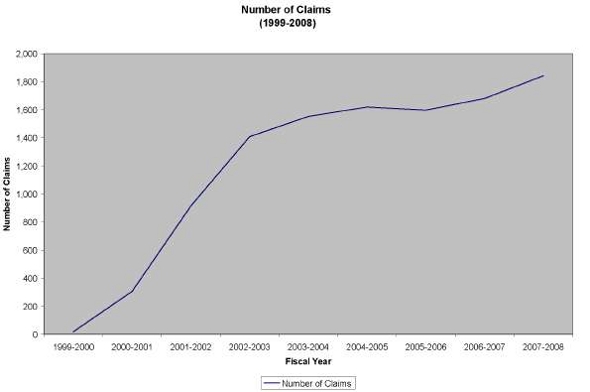
Despite the reduction in the number of loans, the trend in the number of claims is to the upside. The number of claims has increased year over year. Between 1999 and 2008, the numbers of claims has increased, with the exception of a slight reduction of 1.4% for fiscal year 2005–2006.
| Fiscal Year | Number of Claims Paid | Number of Claims—Yearly Change (%) |
|---|---|---|
| 1999–2000 | 19 | |
| 2000–2001 | 307 | 1515.8% |
| 2001–2002 | 915 | 198.0% |
| 2002–2003 | 1,409 | 54.0% |
| 2003–2004 | 1,553 | 10.2% |
| 2004–2005 | 1,620 | 4.3% |
| 2005–2006 | 1,598 | -1.4% |
| 2006–2007 | 1,681 | 5.2% |
| 2007–2008 | 1,843 | 9.6% |
| Total | 10,945 |
Value of Claims Paid
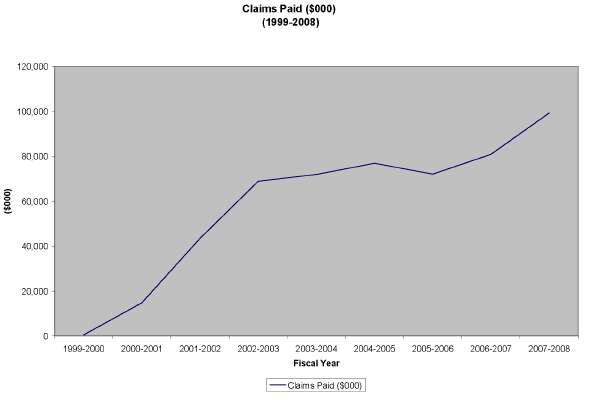
The value of claims paid follows the same trend as the number of claims. The annual total value of claims paid has increased year over year between 1999 and 2008, except for fiscal year 2005–2006, when the value of claims decreased by 6.3% with respect to fiscal year 2004–2005. This dip matches the reduction in the number of claims for fiscal year 2005–2006.
| Fiscal Year | Claims Paid ($000) | Number of Loans—Yearly Change (%) |
|---|---|---|
| 1999–2000 | 494.6 | |
| 2000–2001 | 14,769 | 2886.0% |
| 2001–2002 | 43,466 | 194.3% |
| 2002–2003 | 68,891.60 | 58.5% |
| 2003–2004 | 71,949.10 | 4.4% |
| 2004–2005 | 76,872.60 | 6.8% |
| 2005–2006 | 72,065.50 | -6.3% |
| 2006–2007 | 80,855.90 | 12.2% |
| 2007–2008 | 99,269.20 | 22.8% |
| Total | 528,633.50 |
1.4 Borrower and Loan Demographics
Industrial Sector8
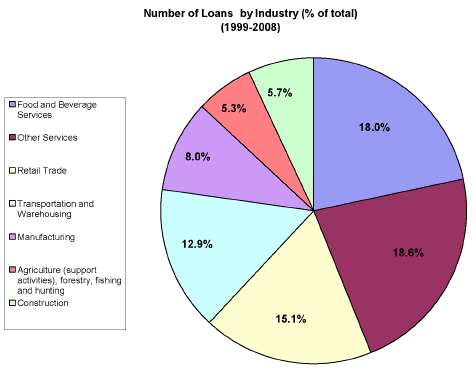
Between 1999 and 2008, the largest number of CSBFP loans (18.6% of the total number of loans) has been granted to SMEs in the "Other Services" sector. Other services includes such services as: repair and maintenance services related to automotive, electronics, commercial, household goods; personal and laundry services related to personal care, funeral services, dry cleaning, pet care services. Following closely in second place at 18%, are SMEs in the "Food and Beverage Services" sector. "Retail Trade" ranks third with 15.1% of the total number of loans.
The chart below presents the share of loans granted for the top seven industrial sectors9.
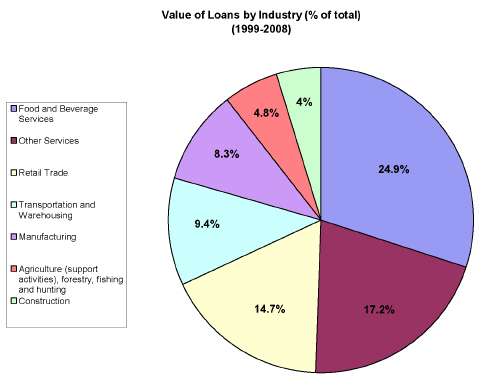
In terms of the industrial sector composition of the CSBFP loan portfolio by value, the "Food and Beverage Services" sector represents the largest amount, 24.9% of the total value of loans granted. SMEs in the "Other Services" sector had the second largest share of the total value of loans, with 17.2%.
The chart below presents the percentage value of the top seven each industrial sectors within the total value of loans in CSBFP portfolio.
The industrial sector with the highest average value of loans is the "Food and Beverage Services" sector, where the average loan is $124,300. The industry with the second highest average loan value is "Manufacturing", where the average value of loan is $93,800. "Retail Trade" and "Other Services" follow, with average loan values of $87,700 and $83,300 respectively10.
The chart below presents the average loan value per industry. Only the industrial sectors with the highest average value of loans have been included.

Firm Size
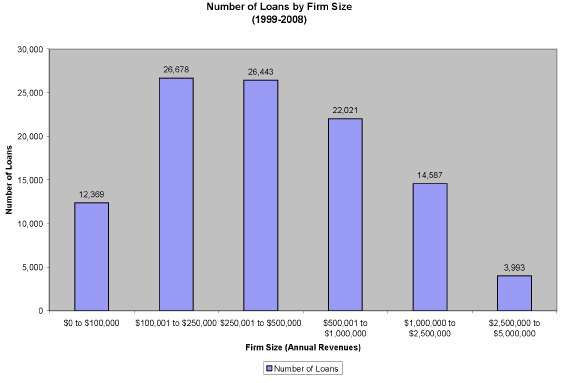
CSBFP borrowers are smaller firms, with less than 20 employees, however the majority of these have between 2 and 4 employees. Over half of the CSBFP borrowers had revenues under $300,000, although one-quarter of these had revenues under $100,000.
The largest group of SMEs receiving financing under the CSBF Program is those with revenues between $100,001 and $250,000, with 25.2% of the loans. Those SMEs in the $250,001 to $500,000 group are the second largest, with 24.9% of the loans. The third largest group receiving loans is that of SMEs with revenues between $500,001 and $1,000,000. The smallest number of loans under the CSBF Program is seen in the SME group with revenues between $2,500,000 and $5,000,000.
The following chart presents the number of loans by borrower firm size11.
When examining the value of loans by firm size, SMEs with revenues between $500,001 and $1,000,000 have the largest share of the total loan portfolio. SMEs with revenues between $250,001 and $500,000 are a close second.
The SME group that receives the smallest value of loans in the portfolio is those with revenues between $2,500,000 and $5,000,000.
The following chart presents the value of loans by borrower firm size12 13.
top of page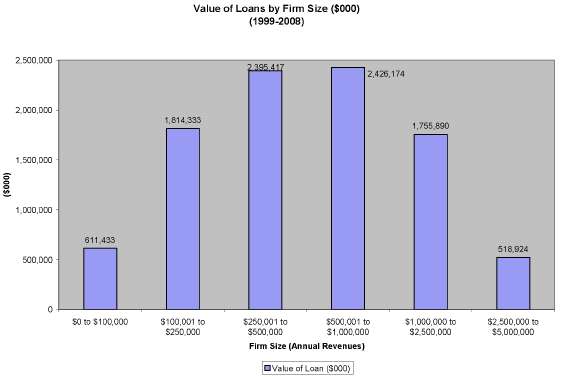
Age of Borrower Firm
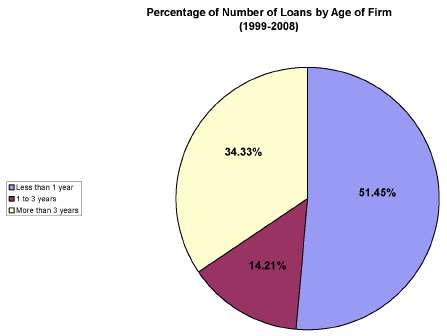
The majority of CSBFP loan recipients are smaller firms, with less than five years old. The majority of these are startups, less than one year old.
In 2004, 51% of CSBFP borrowers were young firms who began selling products or services within the previous 5 years. 36% of CSBFP borrowers were start up companies that entered the market between 2002 and 200414.
Over the 1999–2008 period, the majority of CSBFP loans were granted to firms that are less than one year old (51.5%). Firms that have existed for longer than 3 years receive the second highest share of loans with 34.3%. SMEs aged between 1 to 3 years benefit the least from the CSBF Program, as only 14.2% of them have received loans.
The following chart presents the distribution of the number of loans based on the age of the firm.
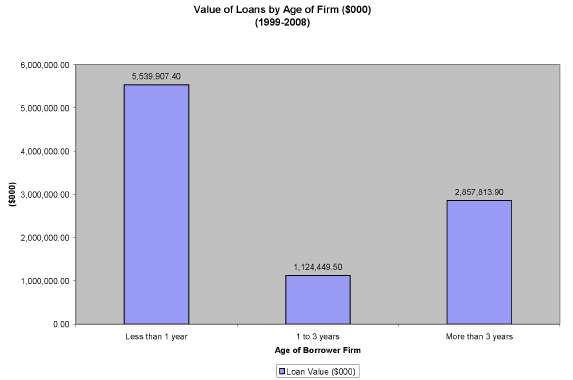
When examining the data in terms of total loan value, the above trend still holds true: SMEs that are less than 1 year old receive the largest CSBFP loan amounts, followed by SMEs that have been in business for more than three years. The group in between, SMEs that have been in business between 1 to 3 years have the lowest loan values.
The following chart presents the value of loans based on the age of the SME15.
Owner Characteristics
CSBFP borrowers are, on average, younger than other SME owners. 26% of CSBFP borrowers are between 30 and 39 years old, and, 43% are between 40 and 49 years old.
Owners of CSBFP borrowing firms have less managerial experience. 22% of the owners have less than 5 years experience, and, 20% have between 5 and 10 years experience.
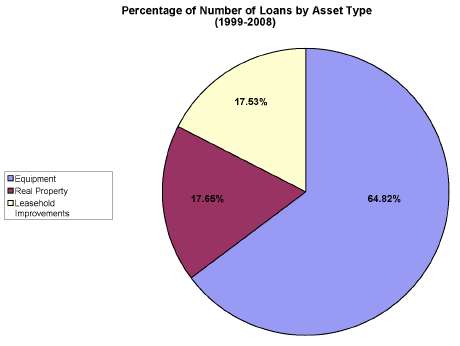
Loans by Asset Type
Between 1999 and 2008, the majority of the loans granted went towards "Equipment". Loans earmarked for "Real property" and "Leasehold Improvements" are not as prevalent, as the share of number of loans that corresponds to both of those categories dos not go beyond 18%.
The chart below presents the split of the number of loans based on asset type16.
Provincial and Regional Distribution
Québec and Ontario are home to the majority of SMEs and the majority of CSBFP borrowers, 33.1% and 32.9% respectively. SMEs in rural areas only represent 19%, but they represent around 33% of CSBFP borrowers. The highest concentration of CSBFP borrowers are in urban areas.
Alberta has the third highest percentage of CSBFP borrowers at 11.2%.
top of page
1.5 Trends in the CSBF Program Portfolio17
The CSBFP portfolio of loans has undergone some changes over the past ten years. Although the profile of the portfolio presented above is as of 2007–08, the following table illustrates the trends that it is experiencing.
| Factor | Emerging Trends in the CSBFP Portfolio |
|---|---|
| Sector |
|
| Type of Borrower | Fewer sole proprietorships; more incorporated businesses. |
| Type of Operation | Proportion of franchises is increasing. |
| Age of Firm | New firms account for a high and increasing proportion of portfolio. |
| Size of Firm | Possible decrease in fraction of portfolio accounted for by one-person firms. |
| Size of Loan | Clear trend towards larger loans. |
| Class of Loan | Clear trend towards loans for financing leasehold improvements, possibly a result of higher frequency of loans to firms in the "Food services & drinking places" sector. |
2 http://www.ic.gc.ca/eic/site/csbfp-pfpec.nsf/eng/h_la02296.html#s4 (Return to Reference 2)
3 Industry Canada (2008). Canada Small Business Financing Act Annual Report 2007–2008, p. 3. (Return to Reference 3)
4 Ibid. (Return to Reference 4)
5 Industry Canada (2008), Canada Small Business Financing Act Annual Report 2007–2008, p. 18. (Return to Reference 5)
6 Industry Canada (2008), Canada Small Business Financing Act Annual Report 2007–2008, p. 18. (Return to Reference 6)
7 Industry Canada (2008), Canada Small Business Financing Act Annual Report 2007–2008, p. 18. (Return to Reference 7)
8 Industry Canada (2008), Canada Small Business Financing Act Annual Report 2007–2008, p. 22. (Return to Reference 8)
9 The top seven industries represent over 83% of the number of loans. (Return to Reference 9)
10 Industry Canada. (2008). Canada Small Business Financing Act Annual Report 2007–2008. p. 22. (Return to Reference 10)
11 Industry Canada. (2008). Canada Small Business Financing Act Annual Report 2007–2008. p. 26. (Return to Reference 11)
12 The values in the chart represent the value of loans for the entire portfolio of loans, between 1999 and 2008. (Return to Reference 12)
13 Industry Canada. (2008). Canada Small Business Financing Act Annual Report 2007–2008. p. 26. (Return to Reference 13)
14 Industry Canada (2009); CSBF—Borrowers under the Canada Small Business Financing Program. (Return to Reference 14)
15 The values in the chart represent the value of loans for the entire portfolio of loans, between 1999 and 2008. (Return to Reference 15)
16 Industry Canada. (2008). Canada Small Business Financing Act Annual Report 2007–2008. p. 19. (Return to Reference 16)
17 Equinox, Sources of Portfolio Risk. (Return to Reference 17)
2.0 Evaluation Study
2.1 Scope
The objective of the evaluation is to determine whether the program has met its objectives under the evaluation issues of relevance, success and economic performance.
Evaluation Issues
Evaluation issues were derived from the 2006 revised RMAF developed for the CSBF Program. The following are the evaluation issues and questions for this evaluation study:
| Evaluation Issue | Evaluation Questions |
|---|---|
| Relevance |
|
| Success |
|
| Cost-effectiveness |
|
| Program Delivery |
|
2.2 Approach
Planning for this evaluation began in the summer of 2008. The evaluation study was conducted over the period December 2008, through June 2009; and it is, to some extent, an update of the evaluation of the CSBF Program that was carried out in 2004.
The evaluation study was managed by the Audit and Evaluation Branch of Industry Canada. The evaluation was conducted by KPMG, and the team was led by the Associate Partner of Advisory Services, who had been involved in the 2004 CSBF Program evaluation. In addition, one AEB resource participated in the conduct of the interviews with lenders. The evaluation was done in consultation with a Steering Committee established for the purpose of the evaluation. (See Annex A for a list of Steering Committee members).
The evaluation has employed a synthesis approach of qualitative and quantitative evidence. Many pieces of research, which form the basis of this evaluation, were conducted by independent third parties using acceptable social science research methods.
top of page2.3 Methodology
Analysis of available data and documents
A significant portion of this project involved the review, analysis and integration of information contained in other studies and data collection activities. A complete list of the documents reviewed may be found in the bibliography. The most heavily used of these studies are described below.
- Evaluation of the Canada Small Business Financing Program—Final Report, BearingPoint, 2004.
The 2004 evaluation provided a benchmark and a good starting point for the majority of the questions addressed in this evaluation.
The 2004 evaluation addressed issues such as:
- Does an SME financing gap exist?
- Is there a need for a program such as CSBF Program?
- How cost recoverable is the program?
- How incremental are CSBFP loans?
- What is the level of awareness of the program, both from lenders as well as borrowers?
- SME-FDI Surveys, Statistics Canada, 2004 & 2007.
The SME-FDI is a knowledge base of information on SME financing in Canada.
The SME-FDI Surveys are undertaken every three years (first one in 2001), and the SME population surveyed are those enterprises that have fewer than 500 employees and have annual gross revenues of less than $50 million.
For the purposes of this evaluation study, findings from the 2004 and 2007 surveys were used. There were slight differences in the questions posed in each of the surveys. In 2004 a breakdown was done of those SME's that had "No credit authorized" by reason. In 2007 this breakdown was not identified. Rather the question focused on whether full or partial amounts were authorized. A separate question asked the reasons for turning down requests.
This data source was heavily used in this report as it contains relevant information about the type of debt, capital lease and equity financing that SMEs use.
As well, SME-FDI data was used in some of the research undertaken by Industry Canada in the area of SME financing. Some of these research papers were used as references in this report.
- Sources of Portfolio Risk and Revenue Generation of the Canada Small Business Financing Program phase 1 & 2, Equinox Management Consultants Ltd, 2008.
The objective of this two phased study was to examine the drivers of risk within the CSBFP loan portfolio and determine how the specified "risk" characteristics of CSBFP borrowers and loans relate to the program's risk and cost recovery.
Phase 1 focused mainly on discussing the risk profile of the CSBFP portfolio, while the focus of phase 2 was to estimate the impact of these risk factors in the CSBFP objectives of incrementality and cost recovery.
- Canada Small Business Financing Program(CSBFP), Awareness and Satisfaction, Phoenix Strategic Perspectives Inc., (2007)
The objective of this study was to better understand the experience of businesses when they try to obtain financing, as well as the extent to which they are aware of and satisfied with the Canada Small Business Financing Program Program.
To accomplish that, the authors present the characteristics that define CSBFP borrowers when compared to non borrowing SMEs, as well their level of knowledge about the program.
- Canada Small Business Financing Program: Updated Analysis of Incrementality, Canada Works Ltd. (2009)
The objective of this research study was to update an incrementality model for the CSBF Program, which had originally been developed in 2004 to determine the extent to which loans made under the CSBF Program are incremental.
The first stage of the research was the construction of the model with the appropriate parameters and statistical properties using logistic regression. Then the model was used to determine outcomes (turned down or not) of decisions on loan applications for non-guaranteed loans using data on firms comparable to those which had received CSBFP loans.
The second stage of the analysis uses the resulting model to classify CSBFP loans as to whether or not the applications would have been turned down in the absence of the CSBF Program.
- Canada Small Business Financing Act—Annual Report 2007–2008, Industry Canada, 2008
The annual report contains information about the uptake of the CSBF Program, as well as key statistics that describe the CSBFP borrowing population, from the inception of the Program in March 1999 to 2007–2008.
Stakeholder Interviews
The data collection for this study involved interviews regarding several of the evaluation questions with senior representatives of stakeholder organizations – borrowers, lenders, and government stakeholders. A total of 43 stakeholder organizations were identified in consultation with Industry Canada as organizations representing important participants in the program who would be expected to be knowledgeable regarding these questions. Of these, 37 were able to be interviewed. The breakdown of the interview sample and responses by type of organizations follows:
| Lending Organizations | Borrower Representative Organizations | Government Stakeholders | |
|---|---|---|---|
| Completed | 30 | 3 | 4 |
| Unable to reach or unwilling to participate | 6 | 0 | 0 |
| Total | 36 | 3 | 4 |
A list of the organizations that were interviewed is presented in Annex B. The interview guides were designed to address questions regarding:
- difficulties that SME face when accessing financing;
- role of the CSBF Program in mitigating SME financing difficulties;
- specific cases in which the CSBF Program is suggested;
- lender's views of alternative loan guarantee programs, and
- potential risks for the program from the lender's perspective
Please refer to Annex L for the interview guides.
Risk Workshop
A risk assessment workshop, held on May 28th, 2009, was undertaken to define the main risks to the CSBF Program. Industry Canada officials involved in the policy and operational aspects of the program participated in the session.
The workshop had three main objectives:
- Identification and review of risks to the program.
- Assessment of the likelihood and impact of CSBF Program's risks.
- Likelihood and impact of risks to the program after introducing controls and management to address the risks.
Cost Benefit Analysis
A separate Cost Benefit Analysis study was undertaken to complement this evaluation and to inform the evaluation issue of cost effectiveness. This study was undertaken by KPMG.
The cost-benefit analysis examined the full social benefits and costs of the CSBF Program. This analysis was conducted to inform Industry Canada of the impact to businesses in receipt of loans under the CSBF Program and the impact to the Canadian economy.
The Cost-Benefit Analysis examined the nine-year time period from 1999–2000 to 2007–2008. The period of analysis includes the time period since the creation of the CSBF loan guarantee program in 1999–2000. The costs and benefits, as well as broader economic impacts associated with loans provided in any given year are realized during a lag period, in some cases even near the end of the maximum 10-year amortization period for loans. 2008–2009 has been excluded from the analysis due to a lack of all data for that period at the time of this study.
top of pageLimitations to the Methodology
Important data issues were encountered during the documentation review and data analysis phases of this study. These limitations have centered mostly on data availability and data quality.
Data Availability
- The individual studies, reports and borrower's survey which represent the key data sources for this evaluation were commissioned by the Small Business Financing Directorate (SBFD) as per the approved RMAF for the CSBF Program. However, the terms of reference for these were developed without the involvement of the Evaluation Directorate. As such, some of the data obtained does not directly answer the evaluation questions.
- The borrower's survey contracted to Phoenix and Associates by SBFD was focused on awareness and satisfaction with respect to the terms and parameters of the CSBF Program. It did not address the impact/outcomes achieved by SMEs as a result of obtaining a loan under the CSBF Program. Although the Evaluation Directorate and KPMG specifically recommended that the borrower's survey be repeated as part of this evaluation study in order to contribute to the analysis of outcomes, SBFD declined due to financial constraints. To attempt to compensate for this, interviews were conducted with two associations that represent broad categories of borrowers, together with one member of an association who was also a borrower under the CSBF Program. Therefore, this study is limited in its ability to evaluate the outcomes of the program with respect to the effect on the borrowers.
- The data available in the longitudinal study has significant limitations when it comes to answering the question "Which firms/industries and loan characteristics create the most economic impact?" The hypotheses presented to Statistics Canada to analyze were at a higher level than required in order to properly respond to the question. Rather than testing for hypotheses such as: "CSBF loans promote one of the following two outcomes: sales and employment growth or, lower production costs and higher labour productivity", the hypothesis should be more targeted to be able to obtain meaningful results and answer the question adequately. A hypothesis such as "CSBF Loans promote employment growth in each of the 19 industries" and providing the list of industries that are most relevant, would help Statistics Canada run the appropriate tests and provide good quality data to answer the question.
- Obtaining information to respond to the question concerning the comparison of the CSBF Program to other programs at a federal and provincial level was difficult as most entities only provide a high level description of the program, and key elements in the comparison such as maximum loan amount, interest charged, and fees or repayment terms are withheld. This information is only available by contacting one of their advisors. This was particularly true when conducting the comparison between the CSBF Program and the BDC.
Data Quality
In the Statistics Canada Economic Impact Study it is unknown whether the comparator group received or did not receive a conventional loan. As a result, the interpretation of the findings of this study is qualified in the appropriate sections.
Generalization of Certain Study Findings to the CSBF Program
The SME population surveyed for the Statistics Canada SME-FDI surveys are those enterprises that have fewer than 500 employees and have annual gross revenues of less than $50 million. This definition differs from that used by the CSBF Program. Although a subset of the respondents are CSBFP borrowers, the findings from the survey cannot be generalized to be representative of the potential population of SMEs as defined by the CSBF Program.
Evaluation Findings
3.0 Relevance
3.1 To what extent does the CSBF Program align with Industry Canada's mandate and government directions?
Findings
Industry Canada's delivery of the CSBF Program is consistent with its mandate and Government directions.
The Program's mandate is derived from the Department of Industry Act and Canada Small Business Financing Act. The CSBF Program is also a separate identified element of Industry Canada's Program Activity Architecture and contributes to the strategic outcomes Competitive Businesses are Drivers of Sustainable Wealth Creation. Finally, the Program is consistent with the small business priorities of the Government, and its parameters were specifically enhanced in the 2009 Budget.
Discussion
A variety of documentation was examined to ascertain whether Industry Canada's delivery of the CSBF Program is consistent with Industry Canada's mandate and government directions. These documents included the Department of Industry Act, Canada Small Business Financing Act and Regulations, the federal Budgets and Industry Canada's Program Activity Architecture.
The Department of Industry Act states in Part I, Section 4.1(n) that the Minister's responsibilities include all matters relating to small businesses.
The CSBF Program is governed by its own legislation, the Canada Small Business Financing Act and its associated regulations, the Canada Small Business Financing Regulations, which set out the parameters of the program and the obligations of the Crown.
Current Government priorities as set out in the 2009 Budget show the commitment to the financing issues experienced by small businesses. The budget increased two specific parameters of the CSBF Program, the size of the loan amounts that could be guaranteed and the total percentage of the losses that lenders are allowed within their portfolio of loans.
The official Industry Canada MRRS strategic outcome Competitive Businesses are Drivers of Sustainable Wealth Creation is directly related to the CSBF Program. The CSBF Program is situated in the Program Activity Architecture under the program activity Entrepreneurial Economy and is its own defined sub-activity element.
top of page3.2 To what extent is there a marketplace financing gap for SMEs—i.e., to what extent are SMEs disadvantaged relative to non-SME's in obtaining financing from the financial markets?
To what extent does the CSBF Program fill the marketplace gap and meet the financing needs of SMEs?
Findings
Based on the literature reviews there is no consensus on a standard definition of a financing gap, but rather a widespread belief that SMEs have more difficulty obtaining financing than large firms. SMEs for which the level of risk is higher than the risk threshold of financial institutions have difficulty obtaining financing, but this would also be the case for large firms with the same level of risk. This means that while there may be a gap, it is a "high risk loan gap," not an "SME gap". Evidence identifies those businesses with the highest risk characteristics as: very young businesses, which would include start-ups; those with insufficient collateral; and those SMEs operating in less stable industries, such as Food and Beverage services. In addition there are some types of expenditures that lenders consider to be risky because of the difficulty in recovery in the event of a default; particularly expenditures related to leasehold improvements.
While the main finding is that there is no financing gap, the main factors that influence lenders to offer the CSBF Program to potential borrowers are lack of collateral and small size of firm. Therefore a gap appears to exist for very young businesses with limited experience, lack of collateral and which have a high credit risk score. As a result, the CSBF Program fills a marketplace financing gap for these types of firms.
Discussion
This question examines whether there is a financing gap for SMEs, but not whether there is a financing gap for those SMEs as defined by the CSBF Program (for-profit, gross revenues under $5M).
The list of studies reviewed for this evaluation include the OECD's SME Financing Gap, Theory and Evidence, KPMG's evaluation of the UK Small Firms Loan Guarantee Scheme, Green's analysis of Credit Guarantee Schemes for Small Business, Equinox's analysis of Working Capital Financing and the CSBF Program, CFIB's 2007 Banking Matters Survey and, the SBFD's gap analysis document. The analysis of this question was also based on the review and analysis of Statistics' Canada's SME-FDI data, as well as interviews with lenders and borrowers.
A number of researchers have tackled the issue of a possible "financing gap" for SMEs, but one of the challenges in carrying out this research has been that there is no commonly accepted definition of a financing gap.
Based on the research consulted, three prevalent views exist on the topic of the "SME financing gap". All of these views relate to the same underlying concept, and the differences lie mainly in the level of restrictions that the definition imposes.
Defining the Gap
Three main definitions are used in the literature:
- SMEs have difficulty obtaining financing.
- SMEs have more difficulty obtaining financing than large firms (i.e., because factors used in lending decisions are, in general, disadvantageous to SMEs, such as the level of risk of the loan).
- SMEs have more difficulty obtaining financing than large firms simply because they are SMEs (i.e., because of biases).
| Definition 1 | Definition 2 | Definition 3 |
|---|---|---|
| OECD: "A financing gap exists if a sizeable share of economically significant SMEs cannot obtain financing from banks, capital markets, or other suppliers of finance." | Used implicitly by many authors, based on the fact that, in general, loans to SMEs are riskier. | CFIB: There is discrimination against small and younger firms…18 |
| Equinox: "A gap exists when identifiable groups in the population are unable to obtain financing at any price."19 | Equinox: "A gap exists where groups of businesses are systematically denied access to financing that they ought to, based on objective criteria, be able to access.20 | |
| KPMG (UK): A financing gap is a situation where two borrowers with an equal probability of repayment have an unequal probability of obtaining credit."21 |
SMEs have Difficulty obtaining Financing
This interpretation of the "financing gap" is the most intuitive and the broadest. It is the one used by the OECD in its report, The SME Financing Gap: Theory & Evidence22 which simply states that SMEs have difficulty obtaining financing, although they are clear that evidence to support this finding is limited. According to the OECD, a "financing gap" exists if "a sizeable share of economically significant SMEs cannot obtain financing from banks, capital markets or other suppliers of finance".
The OECD postulates that there are four categories of financing gaps: inherent structural weaknesses in the financial system; the use of capital markets as a source of capital as opposed to the banking system; financial systems which marginalize SME's of specific types and in specific industrial segments; and country-specific policies that marginalize SME's of specific types and in specific industrial segments.
The paper Gaps in SME Financing: An Analytical Framework23 uses a very similar definition. According to this paper, the gap is a situation in which "identifiable groups in the population are unable to obtain financing at any price". The paper argues that the idea of a gap conveys the concept of a shortage, which in economic terms translates as demand being larger than supply. As a consequence, this gap can only exist if there is an imperfection and the total demand for loans by borrowers is not equal to the total supply of loans from lenders and the loan market is not in equilibrium (markets cannot clear).
The concept of specific types of SMEs not gaining access to financing was also adopted in SBFD's analysis of the SME-FDI data. It is important to emphasize the difference between the concept of SME used in the SME-FDI data analysis and that being used in the context of the CSBF Program. The SME-FDI uses the Statistics Canada definition of an SME; an enterprise that employs fewer than 500 employees and generates an annual gross revenue of less than $50 million. The CSBFP definition is a subset of that and is considerably more restrictive, as, in order to be eligible for the CSBF Program, an SME has to have gross revenues or projected revenues of less than $5 million.
The US SBA gap analysis study, also discussed the concept of the inability of specific types of SMEs to obtain financing.
SMEs have more Difficulty obtaining Financing than large Firms
The second interpretation of the gap, which is closely related to the first interpretation, states that SMEs have more difficulties obtaining financing than larger firms.
SMEs are defined as enterprises that have fewer than 500 employees and have annual revenues of less than $50 million24. Their structure, age, and business track record differ significantly from those of large firms, and it is believed that these factors affect their probability of obtaining financing.
This interpretation of the financing gap is used consistently across the literature and it conveys the message that SMEs are generally not as credit-worthy as larger firms. Some of the reasons that are frequently cited for this are as follows:
- SMEs, because of their age, do not have collateral to obtain credit (compared to larger firms that do).
- SMEs do not have an established business track record.
- In general, loans to SMEs are systematically perceived to be riskier than loans to large firms.
SMEs have more difficulty obtaining financing than large firms because they are SMEs
The third interpretation, and the most restrictive, states that SMEs have more difficulties obtaining financing than large firms because they are SMEs—i.e., not necessarily because their loan is riskier. This interpretation of the gap implies that SMEs are disadvantaged in obtaining financing simply because they are SMEs, not for reasons related to the risk of the loan.
According to this interpretation, the main reasons why financial institutions would deny financing to an SME just for being an SME would include:
- Lender's aversion to lending to SMEs (i.e., favouritism toward large firms).
- Lack of business interest in lending smaller amounts (e.g., because of higher relative costs of processing small loan applications).
- Lack of information about the company (e.g., because of the short life of the organization).
Existence of a Gap
Based on the evidence in the literature, it is difficult to support the existence of a financing gap for SMEs. Most of the studies reviewed have concluded that no conclusive evidence exists to support the concept of a financing gap. For example:
- The OECD study found that, even using definition 1, there is no conclusive evidence to support the existence of a financing gap.
- Research done by Equinox Consulting also concludes that there is no evidence to support a financing gap.
- Research conducted by Industry Canada concludes that the number of SME loans rejected is low, which supports the argument that there is no gap.
There are some studies that state that a financing gap exists, but they provide no data to support this. Examples are the KPMG UK Evaluation, the US SBA gap analysis, and the 2007 survey report by the CFIB, Banking Matters25.
top of pageOther Forms of Gaps
While a gap has been difficult to establish from the evidence examined as part of many pieces of literature and other studies, it is recognized that SMEs do have difficulty obtaining credit in various circumstances, and in certain industries.
Difficulties Obtaining Credit
Based on the results of the lender interviews conducted in this study, the slight majority of lenders mention that SMEs do indeed have more difficulties obtaining financing compared to other firms, but these difficulties are most often related to banks' aversion to risk (i.e., they stated that, if one adopts definition 2, there is a gap). Analysis indicates that 47% of lenders interviewed mentioned that SMEs did face difficulties obtaining financing, 33% of respondents indicated that SMEs did not have difficulties obtaining financing, while 20% were not able to provide an answer.
Industrial Sector
The Statistics Canada SME-FDI survey groups responses by the following industries: Agriculture/Primary, Manufacturing, Wholesale and retail, Professional services, Knowledge-based industries, Accommodations and food services, and Other industries. The rates of loan rejection or, "non-authorized credit" vary significantly from one industry to another, but the findings do provide an insight about the rate of credit approval by sector.
It is important to note that the percentage of each industrial sector seeking credit approval varies over the 2004 and 2007 SME-FDI surveys. When examining the rates of approval by industrial sector, it is difficult to identify which specific industrial sectors have more difficulties obtaining loans compared to others, as the rankings change significantly between the two surveys. Also, the industrial sector breakdown changes between the surveys. In 2004, Tourism was identified (and constructed) as a separate sector; while 2007 it was included in "Other Industries". In 2007 Accommodation and Food Services was identified as a separate sector; while in 2004 it was included in "Other Industries".
In 2004, of the seven industrial sectors listed above, and of those SMEs requesting debt financing, the one that seemed to have the most difficulties obtaining credit approval was the manufacturing sector, which had 64.2% of its requests approved. However, when examining the 2007 data, that industrial sector had the third highest approval rate of 87.5%26.
In 2004, in the case of SMEs in the Knowledge Based Industry (KBI), their rate of credit approval at 70.2% was the second lowest. In 2007, KBI had the third lowest rate of credit approval at 84.5%.
Note that within the context of the CSBF Program, the majority of loans are in the Other Services sector and the "Food and Beverage" subsector of Accommodation and Food Services27. As mentioned above, the 2004 SME-FDI does not break out this industrial sector but rather included it under "Other Industries". In 2007 the SME-FDI does break out the findings by this sector, and finds that 80% of those requesting credit in the Accommodation and Food Services Sector had the credit authorized.
Size of Business
The Statistics Canada SME-FDI survey findings on rates of approval based on the size of business are more consistent across time compared to the breakdown by industry. The SMEs that have the highest rate of approval are those with over 99 employees.
Smaller firms have more difficulties getting financing, and this is true particularly for the firms without employees and those with 1 to 4 employees. Firms without employees had a rate of approval of 79.5% (the lowest level) in 2004, and of 85.5% (second lowest level) in 2007. Similarly, firms with 1 to 4 employees had a rate of approval of 81.2% (the second lowest level) in 2004, and of 84.6% (lowest level) in 2007. Even though the rates of approval may seem high, they are slightly below the averages, which were 83.2% in 2004 and 89% in 2007.
Gaps in Products Offered
While not specifically defined in the literature, another concept of gap in financing for SMEs could be with respect to the financing products offered in the commercial marketplace. There have been various studies commissioned by the Industry Canada SME-FDI analysis group and the SBFD group, which have examined whether gaps exist in financing for working capital and risk capital, including venture capital. This discussion will not explore venture capital, which is very high risk and usually involves taking an equity stake in a company.
In the 2006 Study on Working Capital Financing and the CSBF Program, Equinox examined the requirement for working capital, whether there was a gap for this product, and whether the reason for seeking credit for working capital influenced the turn-down rates. From both the qualitative and quantitative review, the data was not consistent with the hypothesis that applications for working capital loans are turned down any more frequently that other loans, given age, size, sector, and other reasonable factors in the loan decision.
The OECD28 places particular emphasis on financing gaps experienced by innovative SMEs (ISMEs); those SMEs that seek to exploit innovation for growth and competitive advantage. In the particular case of ISMEs, a financing gap exists when it comes to the type of financing, as debt financing (as opposed to equity financing) is not suitable for ISMEs and, makes obtaining financing more complicated.
Another gap that may currently exist was the one left by the end of the Capital Leasing Pilot Project, which had been offered by CSBF Program from 2002–2007. In absence of that program, assets such as new equipment and used equipment that has a remaining economic life greater than the term of the lease can no longer be financed through a government loan guarantee program. Although judging by the fact that the pilot was discontinued due to a lower than anticipated number of companies participating as a result of high levels of approval for these types of loans through conventional means, the existence of this gap can be questioned.
Findings from Lenders and Borrowers
During this evaluation study, interviews with both lenders and borrower representatives included questions about whether there were certain products that they felt represented a gap under the CSBF Program.
Lenders provided an extensive list of additional products they felt could be offered to borrowers through the CSBF Program without necessarily increasing the level of risk, which may be representative of a gap. The following kinds of financing were most commonly mentioned and supported:
- Working capital (thought to be no more risky than leasehold improvement loans)
- Rentals
- Inventory
- Purchase of shares (when the borrower is purchasing a business)
- Goodwill and intangibles
- Franchise fees
- Current account financing
- Renting of space
Borrower representatives mentioned a variety of fees (franchise fees, consultant fees, etc.) and support for market development and brand development (although one of the three borrower representatives did not agree with expanding the types of assets covered by the CSBF Program).
Reasons for Loan Rejection
While there is disagreement over the definition of a gap, a review of the literature found that studies focus on the reasons for loan rejection, and provide essentially the same reasons regardless of what definition is being used for the "financing gap." In addition the SME-FDI surveys also provide information about the reasons for loan turndowns.
Therefore, the following analysis will focus on the reasons why SMEs are believed to have a higher rate of loan rejection.
Main reasons
The most frequent reasons SME loan applications are turned down, according to the literature, are:
- Asymmetric information (i.e., lenders do not have the same amount and quality of information as borrowers)
- Lack of relationship with banks
- Small business size
- Principal/agency problems
- Lack of management skills and poor business plan
- Lack of a track record and collateral
- Conservative nature of financial markets.
Many of these are related to the perceived higher level of risk associated with loans to many SMEs.
According to the 2007 survey Banking Matters conducted by CFIB, reasons cited by their members as reasons for difficulties in obtaining credit include: small size of business, fewer years of experience in business, and that the business is in hospitality sector.
Reasons Identified in the Statistics Canada SME-FDI Surveys
In 200429, only 18.5% of SMEs approached a credit supplier in the previous twelve months, while in 200730, only 18% did.
In 2004 in the case of all SMEs, the number one reason why credit suppliers refused to provide credit is "Insufficient income, sales or cash-flow," accounting for 30.4% of all rejections. "Other reasons31" was the second reason for refusal (23.5%), "Insufficient collateral security" was the third reason for refusal (18.1%), and, "Poor credit experience or history" was the fourth reason (14.3%).
In 2007, in the case of all SMEs, the number one reason why credit suppliers refused to provide credit is "Other" accounting for 43% of all rejections. "Insufficient Collateral" and "Business is too young" were the refusal reasons that had the second highest percentage (25%), and, "Insufficient sales, income or cash flow" was the fourth reason for refusal at 24%.
Rejection reasons by industry are very sparse and are not available for all industries. Based on the limited data available32, 9% of SMEs in the "Other Industries" sector were turned down for an unspecified reason. In the "Manufacturing" sector, 6% of loan applicants were turned down due to "Insufficient Collateral" and, 2% of SMEs in the "Accommodation and Food Services" were turned down due to "Business operates in an unstable industry" and, 2% were turned down due to the fact that the "Business is too young". In 2004, in the case of SMEs in the Knowledge Based Industry (KBI), 30.4% were refused due to "Insufficient income, sales or cash flow".
Reasons Identified by Lenders
Lenders who believe SMEs have difficulties obtaining financing were asked about the reasons that influence their opinion. All of these lenders believe that it is particular SME characteristics that make them ineligible to get financing as these characteristics increase the risk profile of the SME. Lenders presented the following as reasons why SMEs get turned down (in random order):
- Financial health of SME
- Lender having doubts about the capacity of SME to repay loan
- Low capitalization of SME
- Type of collateral presented
- Industrial sector in which SME does business
- Age of SME
- Lack of track record
- Lack of investment from firm's owners.
In summary, there is no conclusive evidence to indicate that SMEs have more difficulty obtaining financing than large firms simply because they are SMEs—i.e., SMEs are not disadvantaged relative to large firms. However, firms that are higher risk with regard to their likely ability to repay loans do have more difficulty obtaining financing than lower risk firms, and many SMEs, such as start-ups, fall into this high risk category.
top of page3.3 Are there viable alternatives to a federal loan-loss sharing program, which would not rely on delivery by the federal government?
Findings
There are no attractive alternatives to a federally managed loan loss guarantee program similar to the CSBF Program, yet offered by other sectors. Interviewed lenders did not see any incentive for private financial institutions to offer an equivalent loan guarantee program and they were not aware of any existing loan loss guarantee programs either in Canada (aside from the CSBF Program) or around the world that did not rely on government involvement.
A potentially viable alternative could be a loan loss reserve fund program, into which the federal government contributed, but otherwise was not directly involved in the program delivery or claims process. This type of program could have some relatively minor advantages to the CSBF Program, mainly administrative simplicity, but it would reduce the degree of control of the government in the claims process, which may not be acceptable. For a program with as large a loan portfolio as the CSBF Program (about $1 billion per year) and consequent large loan losses, taxpayers may want certain controls on claims payments (e.g., assurance that guidelines were followed, assurance that loans were used for the intended purposes).
A few loan loss reserve programs have been implemented in Canada. One federal government program, WED's Loan and Investment Program, has existed since 1995 and could serve as a model. INAC has just launched a new "Loan Loss Reserve Initiative" for medium and large aboriginal businesses, in partnership with the BDC. In the recent past, Heritage Canada had piloted a loan loss reserve program, which was subsequently abandoned when the lender advised that they would no longer participate in the program because of the high risk.
The concept of a government-supported system of mutual guarantee associations was considered in this evaluation. These are popular in the European Union, and serve mainly to address the problem of asymmetric information between borrower and lender, often within specific sectors. However, this issue, while identified as one of several reasons for potential difficulties in obtaining credit in Canada, has not been a core reason or a significant issue. Some of these associations also serve to guarantee loans made through conventional lenders to businesses within their sector. This role would require the implementation of a legislative and regulatory system to allow them to exist. These kinds of associations could reduce the options available to the federal government for direct intervention to support SMEs with the objective to stimulate economic development.
The question of alternative programs was presented to interviewed lenders and none of them was able to present an alternative. Lenders believe that the CSBF Program should be federally administered and that the responsibilities for managing a similar program should not be transferred to private sector organizations. Lenders also mentioned that financial institutions such as theirs would not be interested in offering such a program.
The 2004 BearingPoint evaluation also sought to explore viable alternatives to federal loan-loss sharing program. "Viable alternatives" were considered to be different types of programs that would not rely on the delivery of the program by the federal government33. In these alternatives, the federal government would still be responsible for guaranteeing the loans, but the administration of the program would be devolved to other organizations (private sector lenders, provinces or BDC).
The 2004 evaluation report concluded that the alternatives would be impractical for three main reasons34:
- The administration of the program requires very few resources (in 2008–2009, the program had 31 FTEs and a salary budget of $2 million) which makes contracting out the administration not a very interesting cost saving measure.
- Policy decisions made by Industry Canada are politically sensitive.
- Large amounts of federal money are at stake.
All these reasons apply to all three categories of alternatives—i.e., delivery by the private sector, the provinces, or the BDC. Devolution to the provinces or the BDC would have additional disadvantages. Devolution to the provinces would have the additional disadvantage of being unable to ensure uniform program delivery across the country. Devolution to the BDC would have the additional disadvantage that lending organizations would most likely be uncomfortable with the BDC having information on their loan portfolios, since the BDC also has a commercial mandate.
In the current context, the findings reached in the 2004 BearingPoint evaluation still holds true.
Discussion
This question was interpreted as whether there were different types of alternative programs that would not rely on the delivery of the program by the federal government—not alternate systems that would mirror the current program but without the federal government involved in the program delivery. This means that the federal government would not be involved in the registration of loans or in the decisions concerning claims.
The approach to this question was based on the review of literature where alternative options to having the federal government deliver the program were considered. The results from the literature review, and other publicly available program documentation, were complemented with the feedback obtained from lender and borrower interviews.
Research was conducted to establish if alternatives to having a federally managed loan guarantee program exist, and two options were considered:
- A mutual guarantee association system and,
- A loan reserve fund.
Mutual Guarantee Associations
Mutual Guarantee Associations are private societies formed by potential borrowers, possibly together with other partners. There must be a legal and regulatory environment under which they can operate.
The main rationale for these associations in the countries in which they exist, mainly the European Union, appears to be to provide better information to lenders regarding potential loans by virtue of local knowledge and entrepreneur representation, thus addressing the problem of asymmetric information between borrower and lender. The association thus plays the role of an intermediary between the businesses and banks; businesses join the association to obtain credit from banks and the association negotiates with banks to secure loans for its members.
Green35 presents these associations as the best option as they are perceived to be better equipped to deal with the problem of "asymmetric information", meaning that borrowers have more information than lenders regarding the viability of their projects and their ability and willingness to repay, so lenders have difficulty distinguishing between good and bad loans36.
Lack of information for evaluating loan applications does not appear to be a significant problem in Canada. In addition, there is no indication in the literature that mutual guarantee associations support riskier loans than would be supported by lending institutions on their own if they had access to complete information regarding the loan.
Loan Loss Reserve Fund Programs
Definition
In this type of program the government contributes funds to a loan loss reserve fund managed by private sector lending institutions. The purpose of the loan fund is to provide incremental (i.e., high risk) loans to SMEs. The government enters into agreements with the lending institutions, which specify the parameters around the loans and claims to ensure a high degree of incrementality. The institutions then set up specific loan funds (often targeted toward specific purposes or borrowers), and manage all the administration related to the loan. In the event of claims, the lending institution charges a certain percentage of the losses to the reserve fund, which is usually specified in the agreement with the government as a percentage of the loss. The government does not have any administrative involvement with the loan, either from determining whether the loan is eligible to be guaranteed by the reserve fund or assessing the validity of claims and subsequently paying on the claim.
The apparent advantage of these types of programs is a lower degree of government involvement in the claims process (and consequent administrative cost savings). The lenders are simply allowed to charge a percentage of their loan losses to the reserve fund with no (or few) questions asked, providing they follow the terms of the agreement with the government. On the other hand, because of this "blank cheque" feature of the claims process, these programs are generally characterized by a high degree of government involvement in the process to establish parameters of a loan loss fund, so, on balance, there may be no significant administrative cost savings in this structure. The lack of government involvement in the claims process may actually be a disadvantage of this type of program. For a program with as large a loan portfolio as the CSBF Program (about $1 billion per year) and consequent large loan losses, taxpayers may want certain controls on claims payments (e.g., assurance that guidelines were followed, assurance that loans were used for the intended purposes).
top of pageWestern Economic Diversification Canada—Loan and Investment Program37
WED has set up a variety of Pan-western, sector-oriented loan fund agreements with chartered banks and federal Crown corporations.
Through the Loan and Investment Program, WED partners with independent western financial institutions to offset a portion of the risk they experience when lending to small businesses. By contributing to this loan-loss reserve to offset a portion of the risk, WED encourages financial institutions to provide loans to higher risk clients who would otherwise have trouble accessing capital. WED contributes to a loan loss reserve, equal to between 10 per cent and 20 per cent of the value of loans issued. This reserve may be used to offset a portion (up to 80 per cent) of net losses on defaulted loans, but may not exceed WED's total contribution to the reserve. The loan loss reserve is created and maintained by the capital provider.
Eligible clients apply directly to the financial institutions partnered with WED under this program, and, the financial institutions, using their own capital, authorize and issue loans.
Losses are partially mitigated through the taking of security from the borrowers, and others, and by WED's and the capital providers' contributions to Loan/Investment Loss Reserve(s). Net losses will be determined once the secured assets are seized and liquidated. The amount that may be charged as net losses to a Loan/Investment Loss Reserve may include the principal balance of the loan/investment, the accrued interest, and all reasonable collection costs, including agency, receivership and legal costs and any out-of-pocket expenses incurred by the capital provider.
From the beginning of the program in 1995 until September 2008, WED's loss support contribution of $37 million has leveraged 3,291 loans totaling $250 million. It is estimated that this financing has helped businesses create more than 7,200 jobs and increase revenues by $910 million.
The following examples illustrate different WED Loan Fund Agreements:
Vancity Capital
- Offers a "Growth Capital Loan Program".
- Loan can be used for general working capital, equipment, R&D, market development, product development, new production and services capacity, export expansion.
Coast Capital Savings
- Offers a "Micro Loan Program".
- Loan can be used for R&D leading to commercialization, pre-commercial and commercial product development, marketing development, new production and services capacity, working capital through the use of lines of credit.
Servus Credit Union
- Offers a "Micro Loan Program".
- Loan can be used for getting product/service ready for sale, developing or enhancing product or service, marketing, working capital.
Department of Canadian Heritage (PCH)—Loan Loss Reserve Fund (LLRF)
The Loan Loss Reserve Fund38 was set up in 1998 to help Canadian cultural industries cope with the problem of inadequate financial resources. This program was launched in partnership with the Royal Bank of Canada (RBC) as a pilot project for the publishing industry under the Loan Program for Book Publishers (LPBP). The main objectives of the program were:
- Increase access to capital for targeted industries (e.g. book and/or magazine publishers, and sound recording, film and video, and multimedia producers);
- Assist in the expansion and diversification of Canadian-owned and controlled cultural industries through the provision of incremental sources of capital to companies operating in these sectors; and
- Strategically invest public funds in a manner that significantly leverages private sector funds by moving commercial financial institutions into higher-risk, less common financial aspects of cultural industries
Under the terms of the program, the federal government provided funds to financial institutions in the form of repayable contributions (loan loss reserve). These contributions helped build the loan reserve fund, the pool of capital available for loan to the targeted cultural industries. The purpose of the repayable contributions was therefore to partly cover losses incurred by the loan reserve fund and to leverage investment from the partner commercial financial institution.
Repayable contributions were not to exceed 20% of the financial institution's loan loss reserve fund, or a maximum of $5 million. Each fund offered loans to eligible companies across Canada through the commercial financial institution's branches.
In the case of a default, the financial institutions would recover up to 90% of its net losses from the reserve (after taking reasonable action to recover its collateral), which meant that PCH was responsible for up to 90% of net losses. This PCH liability could not, however, exceed the maximum contribution set out in each agreement, for the whole loans portfolio. Upon dissolution, the contributions repayable to the federal government would amount to the funds advanced less the agreed portion of losses on the portfolio of loans. The agreements with the commercial financial institutions terminated no later than 10 years or when the maximum amount of the government contribution had been disbursed.
In late 2001, RBC declared its intention to end its participation in the LPBP because of the low volume of loans and the high risks. In January 2002, the LPBP stopped accepting new applications. However, the program remained active for previously approved lines of credit. In September 2004, 10 publishers still had an active approved line of credit with RBC under the LPBP.
Indian and Northern Affairs Canada (INAC)—Loan Loss Reserve (LLR)
In the context of this pilot project, INAC will partner with BDC to establish a very small number of reserve fund arrangements with lenders such as banks, credit unions, and commercial financial institutions. The reserve fund will be used by financial institutions as collateral to finance loans to medium and large First Nation businesses whose assets needed to secure the loan are located on reserve. Loans to individual businesses will not exceed $500,000, and, loans to community-owned businesses will not exceed $5 million39.
Summary of Lender Interviews
When asked about other credit guarantee systems that do not rely on the public sector that would be viable alternatives to the CSBF Program, 100% of respondents mentioned that they were not aware of such a program, either in Canada or elsewhere in the world.
When asked if lenders would be interested in delivering the program, most of them confirmed that organizations such as theirs would not have any interest in delivering such a program and that such a role is best left to the government.
This opinion is confirmed by past experiences such as the Canada Student Loans program. Between 1995 and 2000, Canada's chartered banks were responsible for putting up private capital for student loans, as well as for the administration of the program (in exchange for a 5% risk premium). However, in February 2000, the chartered banks announced that they would not continue lending on a reimbursement for loss basis because it was not profitable for them. At that time, there were also concerns that the banks were trying to turn a social program into a profit-making venture and there were concerns about the service being provided to students. A new direct financing model was put in place in August 2000 in which the federal government uses public funds to disburse as student loans, without any meaningful involvement with the banks (except for an agreement allowing students to deposit their loans at these banks).
Summary of Borrower Representative Interviews
When asked about other credit guarantee systems that do not rely on the public sector that would be viable alternatives to the CSBF Program, all respondents mentioned that they were not aware of such a program, either in Canada or elsewhere in the world.
top of page3.4 What is the extent of overlap and duplication between the CSBF Program and other public sector loan programs? To what extent could the financing needs of SMEs that are being met by the CSBF Program be met equally well by some other government program (s)?
Findings
Multiple options exist for SMEs seeking financing, including federally funded and provincially funded programs. Of the loan programs available, the one offered through the Business Development Bank of Canada is most similar to the CSBF Program. Other alternative loan programs target specific groups, regions, industrial sectors or specific demographic groups.
BDC has a broad suite of products targeted at all SMEs which overlap with the CSBF Program, and is the best alternative to it. BDC offers financing options that are similar to those being offered by the CSBF Program; "Term Loans" and," Subordinate Financing". Of its total transactions in small loans, 76% of those were $250,000 or under, the threshold of the CSBF Program (during the period of this evaluation). The BDC also partners with Community Futures Development Corporations, under the Community Futures Program, to offer services to rural entrepreneurs. The BDC is not restricted as to the financing terms or interest rates it charges for its products, which are based on the risk assessment of the applicant and priced to the market. BDC does not provide loan guarantees to conventional lenders for term loans. However, as of 2009, it does provide loan guarantees to conventional lenders for lines of credit being used by SMEs for working capital. Also in 2009, in a pilot project with INAC, the BDC will be establishing loan loss reserves with specific commercial lenders for loans directed towards Aboriginal businesses.
The Community Futures Program, a federal program supported by regional development agencies and delivered through a Pan-Canadian network of not-for-profit corporations, provides loans and other financial products to rural SMEs. Although the value of the loans is smaller than those guaranteed under the CSBF Program, the maximum amount of $150,000 is more than the average size of a CSBFP loan. Rural SMEs represent 33% of the loan portfolio of the CSBF Program.
Eight provinces have loan guarantee programs specifically for businesses, and six of those programs are available for start-ups, which represent the majority of CSBFP borrowers. However all of these programs are either more restrictive as to the businesses which are eligible (most common exclusions are restaurants, bars, retail trade and real estate), or they will only provide a guarantee on smaller loan sizes. Two programs do offer significantly higher loan limits than the CSBF Program. Most significant is that five other provincial loan guarantee program for term loans (Manitoba, Québec, P.E.I. and Newfoundland) have a financing rate that meets or exceeds the 90% allowable under the CSBF Program. The high CSBF Program financing rate was identified by lenders to be one of the reasons why they would offer SME loans under the CSBF Program. Some Provinces, whose population resides in mainly rural areas, refer SMEs seeking financial assistance to programs offered or supported by Regional Development Agencies, usually under the Community Futures Program.
Discussion
The approach to this question was based on stakeholder interviews as well as the review of publicly available documentation describing other programs. It is difficult to compare programs to the CSBF Program, as some of the specific program details (maximum loan amount, interest charged, fees, etc.…) are not publicly available and often depend on the negotiation between the borrower and the particular institution.
Business Development Bank of Canada
The Business Development Bank of Canada (BDC) is a federal Crown corporation, the only financial institution solely dedicated to Canadian SMEs (as per the broader Statistics Canada definition). BDC offers financing solutions directly to SMEs during all stages of development, from start-up to expansion with terms that complement private sector banks. As a result, they support projects that are in general, of higher risk40.
BDCs financing products are more flexible and include a larger array of eligible asset types than what is covered under the CSBF Program. They do offer SMEs two financing options that are similar to those being offered by the CSBF Program; "Term Loans" and "Subordinate Financing". Unlike the restriction placed on financing terms and interest rates under the CSBF Program, the BDC does not face these limitations and prices to the market after a credit risk assessment of the applicant to ensure an appropriate financial return. The rate charged to clients also takes into consideration the cost of funds, plus factors to cover operating expenses and the risk of each individual loan41.
As of 2009, the BDC also offers an operating line of credit guarantee to conventional lenders. BDC does not provide loan guarantees to conventional lenders for term loans.
Term Loans
Using information that is publicly available, BDC's term loan program has some similarities to the CSBF Program, but it has broader reach (all SMEs under the Statistics Canada definition) and it is more flexible with its terms. "Flexible solutions" include: providing bridge financing to cover planning costs, deferred principal payments, progressive or seasonal repayment options, long term financing, and choice of floating or fixed interest rates. Loan limits would be based on the credit risk assessment of the applicant as well as the assessment of the business proposal.
Financing is available for all stages of the business: start-up, expansion, maturity, or, transition. The loans are available for activities ranging from starting a business, buying equipment, buying commercial real estate, building construction, business planning, innovating, selling in international markets, to selling a business.
An analysis of BDC Term Loan product against the CSBFP Term Loan product shows similarities between the two; however the comparison is not complete as the loan loss rate is not specifically known for this product.
Subordinate Financing
Subordinate Financing is available to companies that are successful but lack the collateral for a conventional loan42.
BDC presents subordinate financing as a hybrid of debt and equity financing. It is similar to debt because cash flow is required to repay the loan, but at the same time the terms of repayment are more flexible than conventional debt financing. It is also associated with equity financing because BDC can receive stock options and/or royalties, depending on the terms of the agreement between the parties.
Subordinate financing can be used in three different cases: management buyouts, mergers & acquisitions, and working capital for growth.
Operating Line of Credit Guarantee Program
BDC does not offer lines of credit as part of their financial product portfolio. However, to help SMEs gain access to capital in the current period of economic uncertainty, BDC is offering a new, time-limited working capital guarantee program, which began in early 2009.
The Operating Line of Credit Guarantee will be delivered under the Business Credit Availability Program, and would allow BDC to guarantee lines of credit that financial institutions already extend to their clients. This guaranteed portion goes above and beyond what the banks are already committing. Through this program, financial institutions and BDC will be sharing the risk.
The Operating Line of Credit Guarantee applies to operating lines of credit with authorized limits of a minimum of $400,000 and a maximum of $40 million.
Other Points of Comparison between the BDC and CSBF Program
Loan Size: In 2007, of the BDCs total transactions in small loans, 76% of those were $250,000 or under43; the upper threshold of the CSBF Program (during the period of this evaluation). In fiscal 2008, the BDC moved to implement a sustainable Small Business Strategy focusing on those small business clients with total commitments of $250,000 or less.
Client Base: In 2009, the BDC has a base of 28,000 clients and makes 75,000 client contacts per year44. In 2007–08, the CSBF Program had a total of 37,960 active loans (although there may not necessarily be a 1:1 correlation to number of clients).
Locations: BDC has a network of 90 locations and 10 satellites. BDC has formal partnerships with more than 220 Community Futures Development Corporations (see description below), a cross-country network of contact points located mostly in rural areas. These partnerships enable the BDC to reach entrepreneurs who live near those centres. Using this network, the BDC supported more than 1,000 entrepreneurs in fiscal 2008–200945.
The CSBF Program is offered through a network of approximately 1285 private-sector lenders who are able to participate in the program, with about 14,600 points of service across Canada. Rural clients represent 33% of the portfolio.
Commercial Lenders and the BDC
Commercial lenders use BDC's products to complement a conventional product that they provide in order to better meet client's needs. The majority of lenders see BDC as a partner rather than a competitor. In particular, lenders will often refer SME clients to the BDC for the purposes of gaining access to working capital: a product considered risky by conventional lenders46 and an option currently not available through CSBF Program.
Referrals will also be made when a client is undercapitalized, or is looking for a higher value loan that the conventional lender feels is too risky.
top of pageOther Federal Government Programs providing Assistance to SMEs
Regional Development Agencies
The Atlantic Canada Opportunities Agency (ACOA), Western Economic Diversification Canada (WED), Canadian Economic Development for Quebec (CED-Q), are three federal regional economic development agencies (RDAs) which support economic activities in their respective regions and as a result provide programs to assist businesses, mainly those at the SME level (Statistics Canada definition). Industry Canada's FedNor branch also offers support to SMEs in this capacity for northern and eastern Ontario.
These agencies deliver support to SMEs through partnerships with both for profit and not-for-profit organizations. None of the programs offered by these agencies are comparable to the CSBF Program. Only ACOA and FedNor offer financing directly to SMEs. Only ACOA offers a loan-type product, which is interest-free.
Community Futures Program
The Community Futures (CF) Program is a federal pan-Canadian program supporting rural SMEs. It is delivered across Canada on behalf of the federal government by Community Futures Development Corporations and Community Business Development Corporations (CFDCs/CBDCs), not-for-profit, incorporated organizations, all linked under the umbrella of the Pan Canadian Community Futures group47. There are 268 of these corporations across Canada. The CF Program is funded through contributions from the Regional Development Agencies (ACOA, WED, CED-Q) and Industry Canada's FedNor branch.
The type of SME assistance under the CF program varies depending on the region, but most CFDCs provide financing through loans, loan guarantees or equity investments. The maximum amounts for loans are different depending on the province where the CFDC is located. The western provinces (BC, Alberta, Saskatchewan and Manitoba) and Québec have a maximum loan amount of $125,000. The remaining provinces have capped the amount at $150,000.
The BDC partners with CFDCs to reach entrepreneurs who live in rural areas when their financing needs cannot be met under the CF Program.
Commercial Lender Referrals to the Community Futures Program
Two lenders specifically stated that they would refer rural clients to CFDCs, who deliver the Community Futures Program.
Provincial Programs
Provincial strategies focused towards assisting businesses vary greatly. While all provinces and territories offer some form of assistance programs to businesses, they vary significantly and are often segmented by industrial sector (fisheries, agriculture, manufacturing, environmental) or specific purposes (commercialization, exporting). Many provinces, especially those which have a more rural population refer SMEs to the CFDCs (delivering the Community Futures Program) in their province. For a general overview of the types of assistance by province, see Annex D. For the purposes of this discussion, only provincial loan guarantee programs will be discussed.
Eight provinces have loan guarantee programs specifically for businesses, and six of those are available for start-ups, which represent the majority of CSBFP borrowers. However all of these are either more restrictive as to the businesses which are eligible (most common exclusions are restaurants, bars, retail trade and real estate), or the programs will only provide a guarantee on smaller loan sizes. See Annex D for the specific details and how they compare specifically to the CSBF Program parameters. In some cases the information about the parameters was either not publicly available or is negotiated with individual clients. All information was obtained through provincial and program websites.
In the west, Manitoba offers three loan guarantee programs, the most of any province. Two programs are for term loans. The Business Start Program is targeted specifically to start-ups or those which have been operating less than 12 months and provides up to $30,000 for start-up costs at a financing rate of 100%. This program excludes businesses in financial services, insurance, real estate, and primary production. The Rural Entrepreneur Assistance Program is targeted to businesses with less than $2M in annual income, providing up to $200,000 for the purchase of fixed assets, inventory or working capital at a financing rate of 90%. In addition to excluding the same types/sectors of businesses as the first program, it also excludes restaurants. The last guarantee program is the Rural Small Businesses Operating Credit Guarantee. It has the same terms as the Entrepreneur Assistance Program, but it covers operating lines of credit. Restaurants are eligible under this program. The loss sharing ratio was not identified for these programs.
Alberta offers a Commercial Loan Program, which is available to any size business, operating in Alberta. It offers term loans up to $5M to start or expand a business and purchase capital assets for a maximum period of 20 years. The loss sharing ratio was not identified on the website.
In Atlantic Canada, all four provinces offer loan guarantee programs. In New Brunswick the Business Guaranteed Loan Program is open to any size business including start-ups, although it excludes many specific types of businesses (please refer to Annex D). Three business exclusions of particular note are retail trade, food catering, and warehousing – all of which form a good portion of the CSBF Program loan portfolio. This Program offers terms loans, which can be used for capital expenditures and working capital.
In Nova Scotia, the Small Business Financing Program is offered in an exclusive arrangement with Credit Unions in the province. It is open to any business although it does have some exclusions (refer to Annex D) and each application is evaluated on a case-by-case basis. A maximum of $150,000 is available for working capital either through a term loan or a line of credit. 75% of the value of the loan is guaranteed.
P.E.I. offers the Entrepreneurship Loan Program, open to most industry sectors. The maximum value of loans is $50,000 with interest charged at a floating rate of prime plus two per cent. The loan is 100% guaranteed to a maximum of five years. The program also is available for working capital loans to a maximum of $25,000.
Newfoundland SME Enterprise Fund offers SMEs in specific sectors term loans for fixed assets, leasehold improvements, working capital, and intangible assets, to a maximum of $500,000 per project at a financing rate of 80%. 100% of the loan is guaranteed as it is provided directly by the NL Department of Innovation, Trade and Rural Development.
Québec has a strong strategy to help SMEs and provides them with a large variety of financing programs. Investissement Québec offers two loan guarantee programs: Small and Medium Business (SMB) Financial Program and the RENFORT Program, available to any size business. Both programs offer a 100% financing rate. Both programs focus on a wide range of sectors covering a broad variety of businesses including: manufacturing, biotechnology, pharmaceutical, information technology, aeronautics and aerospace (see Annex D for full list). The programs provide financing at a firm's different stages and, for a variety of different uses: start-up or expansion, equipment purchase, building construction or expansion, increase in production capacity, modernization or increase of working capital, exporting (sales outside Quebec), market development, innovation, and, consolidation or strategic alliance.
The SMB Program offers a minimum amount of $50,000 without identifying a maximum, which appears to depend on the business proposal. The interest rate on the loan is set by the financial institution. The RENFORT program was created to help SMEs weather the current economic slowdown. Businesses must have generated positive funds for at least two of the last three years and the total of the funds generated over the last three years is positive. They must demonstrate that their liquidity problems are temporary and that their profit outlook is good. The minimum amount of the loan under guarantee is $250,000 and, maximum amount is $15 million for a period not exceeding 10 years.
Commercial Lender Referrals to Provincial Programs
Lenders were questioned specifically about their practices of referring clients to provincial programs if their institution was not willing to extend credit. Lenders in Québec indicated that they frequently refer clients to Investissement Québec's RENFORT program, which allows for margins and longer term financing. Québec lenders see Investissement Québec as a partner rather than a competitor. Other lenders also stated that they would refer clients to provincial programs, although only a small percentage of them actually referred to provincial programs by name. The main reason why lenders refer clients to other programs is to provide a better service to their clients, whose products most often complement or enhance what the lender was able to offer.
18 CFIB. (2007). Banking Matters. p. 3. (Return to Reference 18)
19 Equinox Management Consultants Ltd. (2002). Gaps in SME Financing: An Analytical Framework. p. 7. (Return to Reference 19)
20 Ibid. p. 8. (Return to Reference 20)
21 KPMG Management Consulting (UK). (1999). An Evaluation of the Small Firms Loan Guarantee Scheme. (Return to Reference 21)
22 OECD (2006). The SME Financing Gap: Theory & Evidence. (Return to Reference 22)
23 Equinox Management Consultants Ltd. (2002). Gaps in SME Financing: An Analytical Framework. (Return to Reference 23)
24 Equinox Management Consultants Ltd. (2002). Gaps in SME Financing: An Analytical Framework. (Return to Reference 24)
25 CFIB. (2007). Banking Matters. p. 3. (Return to Reference 25)
26 Statistics Canada—SME-FDI (2007), Table 9a. (Return to Reference 26)
27 CSBFP Annual Report 2007–08. (Return to Reference 27)
28 OECD—The SME Financing Gap: Theory & Evidence (2006). (Return to Reference 28)
29 Statistics Canada—SME–FDI (2004), Table 3. (Return to Reference 29)
30 Statistics Canada—SME-FDI (2007), Table 2. (Return to Reference 30)
31 "Other reasons" was offered as a response category in the Survey, but was not defined. (Return to Reference 31)
32 Equinox Management Consultants Ltd. (2002). Gaps in SME Financing: An Analytical Framework. (Return to Reference 32)
33 BearingPoint (2004). Evaluation of the Canada Small Business Financing Program Final Report. p. 22. (Return to Reference 33)
34 Ibid. (Return to Reference 34)
35 Green, Anke. Credit Guarantee Schemes for Small Business, September, 2002. (Return to Reference 35)
36 BearingPoint (2004). Evaluation of the Canada Small Business Financing Program—Final Report. p. 25. (Return to Reference 36)
37 More information about the program can be found in WED's Departmental Performance Report at: http://www.tbs-sct.gc.ca/dpr-rmr/2007-2008/inst/wco/wco-eng.pdf. (Return to Reference 37)
38 Canadian Heritage (2005). Summative Evaluation of the Loan Loss Reserve Fund (LLRF) (http://dsppsd.pwgsc.gc.ca/collection_2007/ch-pc/CH44-121-2005E.pdf). (Return to Reference 38)
39 http://www.ainc-inac.gc.ca/ai/mr/nr/s-d2008/bk000000151-eng.asp?p1=209557&p2=1063351. (Return to Reference 39)
40 Entrepreneurs first Annual report 2009 (PDF). (Return to Reference 40)
41 Entrepreneurs first Annual report 2009 (PDF). (Return to Reference 41)
42 Entrepreneurs first Annual report 2009 (PDF). (Return to Reference 42)
43 BDC Corporate Plan Summary 2009–2013. Available at: Business Development Bank of Canada (PDF). (Return to Reference 43)
44 BDC Corporate Plan Summary 2010–2014. Available at: Business Development Bank of Canada (PDF). (Return to Reference 44)
45 BDC Annual Report, 2009. Available at: Business Development Bank of Canada (PDF). (Return to Reference 45)
46 Entrepreneurs first Annual report 2009 (PDF). (Return to Reference 46)
47 Entrepreneurs first Annual report 2009 (PDF). (Return to Reference 47)
4.0 Success
4.1 To what extent were the loans made under the program incremental?
Findings
A loan under the CSBF Program is considered incremental if it would not otherwise have been advanced to a qualifying SME, or is on more favorable terms or is advanced under more attractive conditions48.
In order to determine whether or not loans advanced under the CSBF Program are incremental, Equinox developed a credit-scoring model or incrementality index in order to emulate those used by commercial lending institutions. Factors identified through the SME-FDI surveys as reasons given for loan turndown, were used to construct the model. The main factors that influence the incrementality index are: age of firm; revenues; size of loans; and number of employees.
Since 2004, the levels of incrementality for the CSBF Program have steadily increased as the model has been applied to CSBFP data. In the 2004 evaluation, incrementality (full plus partial financial incrementality) was estimated to be approximately 75%. Between 2004 and 2007, the trend moved upwards steadily from 75% to around 78%49. The latest estimate of incrementality (full plus partial) for the CSBF Program has increased more than previously anticipated and is now estimated between 80% and 85%.
In the analysis of the results pertaining to the factors influencing incrementality, the 2007 SME-FDI data, stratified to separate CSBFP clients, revealed that CSBFP loan recipients scored more poorly on key indicators of creditworthiness (capacity to repay, age of primary owner, size of firm, etc.) than counterpart term loan borrowers that did not receive loans under the terms of the CSBF Program. Moreover, 2007 recipients scored more poorly on these creditworthiness factors than had CSBFP recipients in 2001. These factors, while influencing incrementality are also factors of increased risk.
Discussion
The approach to the analysis of this question was based on the review and analysis of existing studies, primarily the 2004 evaluation, and studies by Equinox Management Consultants and Canada Works Limited (formerly Equinox).
The 2004 evaluation of the CSBF Program was able to reach definitive findings regarding the different types of incrementality. The current evaluation reviews the issue to determine whether or not the situation has changed significantly since that time (at least up until the current financial market upheaval).
Measuring incrementality is a challenging task, for several reasons. First, it requires an assessment of the counterfactual: what proportion of approved loans disbursed under the CSBF Program would not otherwise have been approved? It is also challenging because financial institutions that provide CSBFP loans are responsible for approving and administering the loans. Industry Canada program administration does not review or oversee individual loan applications. Accordingly, there is little opportunity to directly observe the extent of loan incrementality at the time loans are adjudicated50.
Defining Incrementality
Full Financial Incrementality
A CSBFP loan demonstrates full financial incrementality if no loan would have been granted to the borrower if the CSBF Program had not existed. This means that the borrower would not have been able to qualify for a loan without the existence of the program51.
Partial Financial Incrementality
A CSBFP loan demonstrates partial financial incrementality if a smaller loan would have been granted to the borrower if the CSBF Program had not existed.
Loan Quality Incrementality
A CSBFP loan demonstrates loan quality incrementality if the loan is more advantageous to the borrower, in ways unrelated to the amount of the loan, than the loan the borrower would have had if the CSBF Program didn't exist. There are different types of loan quality incrementality:
- More favourable terms than the loan the borrower would have had in the absence of the CSBF Program.
- Timelier basis than the loan the borrower would have had in the absence of the CSBF Program.
- Loan was part of a broader financing package than would have been provided to the borrower in the absence of the CSBF Program52.
Measuring Incrementality
Lending institutions have increasingly adopted a risk-based approach to lending, based on the use of credit scoring models. Development of a credit-scoring model involves the collection of information on a set of loans and then following the payment performance of the loans over a particular period of time. Logistic regression, using specific factors of a loan, is the basis of credit scoring. This methodology is widely used by financial institutions to determine whether or not credit should be extended to a potential borrower. The regression is performed on a set of predictor variables to predict an outcome (such as loan decision). These variables can include data such as firm and business owner attributes including, among others: industry sector, age of borrower firms, type of loan, owner characteristics, size of loan and size of business. Financial institutions regard their internal credit scoring models as proprietary, confidential commercial information, analogous to trade secrets, and treat and protect them accordingly. They are therefore unavailable for research purposes.
To estimate levels of incrementality of the CSBF Program, research was undertaken by Equinox to "reverse engineer" commercial lenders' credit scoring models and assess the extent to which loans advanced under the CSBF Program would have been turned down for a conventional loan, thereby measuring incrementality of the Program.
Information was obtained from the Statistics Canada Surveys of SME Financing (SME-FDI) about businesses who applied for a term loan, and the reasons given to those who had their request turned down. Those factors were then used to develop a credit scoring model. Based on the results obtained from the research, it was concluded that the main factors that influence the incrementality index are: age of firm, revenues, size of loans, and number of employees.
The model was then applied to those loan applications for non-guaranteed loans using data on firms comparable to those which had received CSBFP loans to ensure that it had a goodness of fit (i.e.: it corresponds to the outcomes (turned down or not) of the decisions). The resulting model was then used to assess CSBFP loans as to whether or not the applications would have been turned down in the absence of the CSBF Program.
At the extreme, if the guaranteed loans were incremental and if the model were reliable, then the model would predict that all of the CSBFP loans would have been turned down. The proportion of such loans that the model predicts as being turned down is, under this logic, a direct measure of incrementality.
Applying the Incrementality Model
In 2004, to estimate levels of incrementality of the CSBF Program (full financial, plus partial financial), Equinox used the data from the 2001 and 2002 SME-FDI Surveys to run through the credit scoring model that they had developed (by the means discussed above). It was determined that 50 to 55% of the loans made under the CSBF Program were fully financially incremental53, an additional 25% of CSBFP loans had been "partially financially incremental" 54, and loan quality incrementality was estimated at 17.1%. These results translated into a point estimate of the level of incrementality of 74.8% with a 9% margin of error.
In 2009, Canada Works (formerly Equinox) attempted to update the 2003 credit scoring model using results of loan turndowns identified in the 2007 SME-FDI Survey. However the findings of the survey differed significantly from earlier iterations, as the rate at which loan applications were rejected in 2007 appeared to be half that of 2004 and approximately one-third the rate of loan turndowns in 2000 and 2001. This very small number of loan turndowns was too small a number of cases from which to statistically attempt to draw inferences about patterns in the population in a reliable manner. [Note that corresponding to loan turn downs, is the rate of credit authorization, which in 2007 was 87%, significantly higher than other years.]
Given the constraint of the sample size (those who had loans turned down), it was decided to use the 2003 credit scoring model and populate it with the 2007 SME-FDI survey data. The results of the model confirmed the perception of higher incrementality: it is estimated that the current incrementality levels of the CSBF Program is between 80% and 85%. This can be interpreted that there is a higher share of riskier loans in the CSBFP portfolio.
In the analysis of the results pertaining to the factors influencing incrementality, the 2007 data revealed that CSBFP loan recipients scored more poorly on key indicators of creditworthiness (capacity to repay, age of primary owner, size of firm, etc.) than counterpart term loan borrowers that did not receive loans under the terms of the CSBF Program. Moreover, 2007 recipients scored more poorly on these creditworthiness factors than had CSBFP recipients in 2001.
top of page4.2 What has been the economic performance of firms in receipt of loans under the CSBF Program (e.g., impact on survival rates, sales, profits, gross employment)?
Findings
In several key areas, CSBFP borrowers outperform comparable SMEs who have not received a CSBFP loan.
SMEs who are CSBFP borrowers have consistently higher levels of business survival compared to non-CSBFP borrowers. They are able to increase their business investments (total assets) at a faster pace when compared to non-CSBFP borrowers. Their companies also experience higher levels of sales growth.
CSBFP borrowers experience greater employment growth compared to non-CSBFP borrowers, and their employment levels increase at a faster pace. There does not appear to be an impact on profits as a result of obtaining a CSBFP loan.
Discussion
The approach to this question was based on the review of existing studies; the 2004 BearingPoint evaluation as well as the 2004 and 2008 longitudinal impact studies undertaken by Statistics Canada.
Based on the statistical analysis conducted, CSBFP borrowers, overall, perform better in most metrics compared to non-CSBFP borrowers. The 2004 evaluation, even though it only focused on job creation (see Annex F), presented a positive impact of the program on SMEs. Both the 2004 and 2008 longitudinal studies point to the same positive effect.
CSBFP participants, when followed across several years (in this case between 2001 and 2006), perform better than non-CSBFP borrowers in areas such as survival rates, sales, employment, business investments and contributions to GDP. The impact on SME's profits, however, was difficult to measure and the tests were inconclusive.
A trend is noticeable when looking closely at the evolution of measures such as sales and business investment. In the case of these measures, for all cohorts55, the starting levels for CSBFP borrowers are lower than for non-CSBFP borrowers. With time, and due to the fact that the rate of growth for CSBFP borrowers is higher than non-CSBFP borrowers, the trend switches and CSBFP borrowers are able to surpass the values of non-CSBFP borrowers. At the end of the analysis period, there is a large gap in the values for sales and business investment, where values for CSBFP borrowers are significantly higher compared to non-CSBFP borrowers.
Statistics Canada Longitudinal Economic Impact Studies
Statistics Canada longitudinal studies in 2004 and 2008 sought to estimate the effect of a CSBFP loan on an SME's (as defined by the CSBF Program) economic performance. The assumption was made was that without the CSBFP loan, CSBFP SMEs would have performed at levels similar to those of a comparable set of SMEs.
The 2008 study examines CSBFP clients longitudinally from 2000 to 2006. The 2008 study is more comprehensive as it follows each cohort of CSBFP borrowers that received CSBFP loans in 2000, 2001, 2002, 2003, 2004, and 2005 longitudinally until 2006. This means that the performance of CSBFP borrowers that received loans in 2000 was tracked for each year (2001 through to 2006). The detailed results of the 2008 study are presented here, as they are more comprehensive than those of 2004, and the findings are similar. For 2004 findings, please refer to Annex F.
Impact on Survival Rates
The hypothesis analysis revealed that, CSBFP borrowers had consistently higher survival rates than the comparison group. In all lags, CSBFP borrowers had a higher rate of survival compared to non-CSBFP borrowers56 in every single case considered.
When following the 2000 cohort across six years, the survival rate of CSBFP borrowing firms was 69%, compared to 66.2% of non-CSBFP borrowers. Similar rates were found in the 2001 study group (70.9% and 69.7% respectively).
Impact on Sales
The CSBFP group experienced greater sales gains over each of the five lags compared to the comparison group57.
For instance, in the case of the 2001 cohort, over the five lags (between 2001 and 2006), sales grew by $900 million in the case of CSBFP borrowers, compared to a growth of only $500 million in the case of non-CSBFP borrowers58.
The detailed analysis is presented below.
2001 Cohort
- Level of sales for CSBFP borrowers is lower than for non-CSBFP borrowers in 2001 ($3,163 million for CSBFP borrowers vs. $3,402 million for non-CSBFP borrowers)
- Rate of growth of CSBFP borrowers' sales is higher than that of non-CSBFP borrowers:
| Sales—Yearly Growth Rates | 2001 | 2002 | 2003 | 2004 | 2005 | 2006 |
|---|---|---|---|---|---|---|
| CSBFP Borrowers | 14.16% | 4.04% | 2.71% | 3.89% | 1.37% | |
| Non-CSBFP Borrowers | 7.38% | 0.85% | 1.98% | 3.89% | -1.13% |
- In 2003, sales of CSBFP borrowers surpass sales of non-CSBFP borrowers.
- Throughout the five lags (2001 to 2006), the growth in sales for CSBFP is 28.50%, compared to only 13.43% for non-CSBFP borrowers.
2002 Cohort
The 2002 cohort follows the same trend as the 2001 cohort.
- Level of sales for CSBFP borrowers is lower than for non-CSBFP borrowers at the start ($2,874 million for CSBFP borrowers vs. $3,087 million for non-CSBFP borrowers)
- Rate of growth of CSBFP borrowers' sales is higher than that of non-CSBFP borrowers
| Sales—Yearly Growth Rates | 2002 | 2003 | 2004 | 2005 | 2006 |
|---|---|---|---|---|---|
| CSBFP Borrowers | 12.32% | 4.80% | 4.40% | 0.91% | |
| Non-CSBFP Borrowers | 3.69% | 2.31% | 3.88% | -0.44% |
- In 2003 (a year after the beginning of the cohort), sales of CSBFP borrowers surpass those of non-CSBFP borrowers.
- Throughout the four lags (2002 to 2006), the growth in sales for CSBFP borrowers was 24% compared to only 9.7% for non-CSBFP borrowers.
Impact on Profits
The impact on profits was not as conclusive as the impact on other financial measures. Based on the data generated by the study, the growth in profits was similar across the two groups59.
When there was a difference in profit performance between CSBFP borrowers and non borrowers, CSBFP borrowers performed better. These cases were not very prevalent. A situation where non-CSBFP borrowers perform better than CSBFP borrowers never occurred.
Impact on Employment
CSBFP borrowers experienced higher employment growth compared to non-CSBFP borrowers.
Over the 5 years, the CSBFP borrower group had higher employment growth than non-CSBFP borrowers60. CSBFP borrowers had between 5% and 9% growth in their employment levels over that of the non-CSBFP borrowers group.
The analysis of the 2001 reference study group over five lags reveals that employment among CSBFP borrowers increases by higher rates than for non-CSBFP borrowers. Between 2001 and 2006, the number of employees for SMEs in the 2001 cohort increased by 42 employees, compared to the non-CSBFP borrower group which had a decline of 2,881 employees61.
Analysis for the 2002 cohort along the lags between 2002 and 2006 presents growth around the 82% mark: employment grew by 83.27% among CSBFP borrowers, compared to 81.55% for non-CSBFP borrowers.
It should be noted that these data on direct employment growth at CSBFP borrowing firms do not take into consideration the effects of job displacement. For example, a CSBFP loan may enable restaurant A to expand (and thereby create employment at A), but this may draw employees away from restaurant B, thereby reducing employment at B. Some studies have shown that displacement can be significant in loan guarantee programs.
Impact on Business Investment
In this study, growth of business investment was measured as the growth of average total assets62.
In this case, the CSBFP borrower group had consistently higher rates of investment growth compared to the non-CSBFP borrowers.
The data shows that the level of business investment of CSBFP borrowers is usually lower than for non-CSBFP borrowers in the base year, but, with time, the level of investment of CSBFP clients matches that of non-CSBFP and even goes beyond it. This is particularly true in the case when there are a high number of lags.
The analysis of the business investment trend for the year 2000 cohort of CSBFP borrowers reveals that it follows a similar trend to that followed by the impact on sales. The level of business investment for CSBFP borrowers was $1,071,506, compared to $1,306,402 for non-CSBFP borrowers for the year 2000. In 2006, after six lag periods, the level of investment for CSBFP borrowers was $2,155,976, compared to $1,575,488 for non-CSBFP borrowers. This translates into an increase of 101.2% in the case of CSBFP borrowers, compared to a rate of growth of just 20.6% in the case of non-CSBFP borrowers63.
The same tendency is prevalent when examining the 2001 study group. In the year 2001, CSBFP borrowers had lower level of business investments ($859,846), compared to $881,197 for non-CSBFP borrowers.
Throughout the lags, business investment for CSBFP borrowers increased at a faster pace and surpassed non-CSBFP borrowers' business investment levels. Between 2001 and 2006, CSBFP borrowers in the 2001 cohort, grew their business investments by 68%, compared to the non-CSBFP borrower group, which only grew it by 59%64.
Impact on Value Added (GDP)
The impact on value added (GDP) is measured by the total sum of wages plus profits. In every study year between 2000 and 2006, the CSBFP borrower group experienced an increase in their overall level of contribution to GDP.
In 2001, CSBFP borrowers contributed $2 billion to GDP, and in 2006, they contributed $2.7 billion, an increase of 35% over 6 years.
In comparison, in 2001, the group of non-CSBFP borrowers contributed $2.2 billion to GDP, and in 2006, they contributed $2.6 billion, an increase of 18% over 6 years65.
top of page4.3 Which firms/industries and loan characteristics create the most economic impact (and is there a link between the level of risk and economic impact)?
Findings
It was not possible to determine whether there is a link between the risk factors of SMEs in receipt of a CSBFP loan, and the resulting economic impact experienced as a result of obtaining financing. The overall impact in the economy of specific industries (in particular those that make up the CSBFP portfolio) was not conclusive.
The age of firm and industrial sector are primary sources of risk within the portfolio. Due to the high concentration of young SMEs (less than five years old) in the portfolio and the fact that the employment impact of CSBFP borrowers is higher than non-CSBFP borrowers, it can be inferred that younger SMEs have a higher impact on the economy. Throughout the life of the program, firms that have less than 20 employees have had an increasing impact in the economy as a result of their higher increase in sales.
Discussion
This question was not addressed in the 2004 evaluation. With the availability of studies such as the 2004 and 2008 longitudinal CSBFP economic impact studies (Statistics Canada), it was estimated that it would be easier to measure the economic impact of the CSBF Program, especially along the lines of employment growth, sales, business survival rates, and, business investment. It was anticipated that these studies, together with the study on portfolio risk would provide enough data to determine if there was any correspondence between the level of risk and the level of impact of the loan. However, drawing findings out of the limited amount of data available was a challenge (see study limitations). At this point, the impact of specific loan characteristics or loan risk levels is still unknown.
The approach to the analysis of this question was to explore the types of loans that are riskier, because of their higher propensity to default, and then use the data from the 2004 and 2008 longitudinal studies to attempt to estimate the economic impact of these loans.
This question will be addressed at a high level here, as the economic (cost-benefit) study of the CSBF Program provides a more in-depth analysis on overall economic benefits, and its findings are examined under the next question.
Estimating the impact of specific firm and loan characteristics is a very challenging task. Given the high concentration of riskier SMEs (those in particular industries and younger firms), it becomes difficult to estimate the effect of specific loan risks in the Canadian economy.
Determinants of Risk
A study by Equinox on the sources of the risks associated with the CSBF Program showed that age of firm and industrial sector are the two primary determinants of risk within the portfolio.
The youngest firms are the most risky and loans to firms in the "Food services & drinking places" sector and "Retail trade" sector were particularly risky and pose unusual impacts on portfolio risk. This is particularly important due to their significant weight in the CSBFP portfolio, representing 25% and 15% respectively (2007–08). The "Food services & drinking places" sector is also among the most risky in that claims occur two to three times more often than firms in the reference category, "Other services". In particular, non-franchises in the "Food services & drinking places" sector are even more likely to generate claims.
Contrary to previous research, loans to franchises and loans for the purpose of leasehold improvements were not so much sources of risk in themselves but seem risky because they are relatively more common within the risky "Food services & drinking places" and "Retail trade" sectors.
Claims are relatively more likely to arise from larger loans. Likewise, loans to firms that were required to provide corporate or personal collateral were also less likely to generate claims. Larger firms, as measured by number of employees, were less likely to default.
Applying a proportional hazards model to the 2006–2008 profile of the CSBFP portfolio, it is estimated that claims will be received on 15.9% of loans. This compares with the historical rate of approximately 10.7%. This confirms the expectation that trends in the profile of the portfolio is towards yet greater levels of risk.
Economic Impact of SMEs in Receipt of CSBFP Loans
Statistics Canada Longitudinal Economic Impact studies looked at indicators that would gauge the economic performance of small businesses which took part in the CSBF Program. The 2008 study does not present the specific impact of CSBFP loans by industry concluding that the "CSBF Program has a similar outcome on businesses; regardless of which industry they fall in"66. The data available in these studies is limited, such that it might not be able to properly depict the macro economic effect of the CSBFP loans in the Canadian economy.
Findings regarding sales and employment were obtained by size and age of firm, as follows.
Sales
Over the five year period 2001–2005, the CSBFP borrower group experienced important sales gains. Firms of all sizes experienced sales gains at every period between 2004 and 2006. Businesses without employees experienced the greatest sales growth compared to other employment size groups. However, SMEs that have between 1 and 19 employees experienced the sharpest increase in sales during the study period (1998–2006).
In 2004, testing was conducted to determine if specific loan characteristics were related to increases in the level of sales. The categories considered were: purchase or improvements of real property, leasehold improvements, equipment or software. Unfortunately, the regression coefficients were highly unstable and the results were not reliable67. This testing was not subsequently repeated in 2007.
Employment
The studies found that the highest increase in employment between 1998 and 2001 has been experienced by SMEs with 50 or more employees. Between 2001 and 2006, CSBFP borrowers had a slight increase in their number of employees. This period of time saw non-CSBFP employment decline. Even though there was no noticeable increase based on the age of the firm, given the fact that there is a higher representation of younger firms among CSBFP borrowers, (51% of CSBFP borrowers are young firms, and 36% of these borrowers are start-ups, based on the 2004–2005 SME-FDI data), we can imply that the increase in employment was concentrated in firms that are 5 years and younger. See Annex G for the specific findings under each study.
top of page4.4 What factors pose the greatest risk to the program's ability to achieve its intermediate and long-term objectives?
Findings
Since its inception in 1999, the CSBF Program has experienced a 49% drop in the number of loans registered. This realized risk and the reasons for it, is of greatest concern to Industry Canada officials.
According to CSBFP staff, the biggest risk to the program is that it may not be perceived to be an attractive vehicle by the lenders due to program design elements such as items eligible under claims, interest rate caps, and other design features. The second most important risk is perceived to be individual lender internal policies, actions, etc. which may impair ability to achieve goals of the Program. This may include the heavy reliance on credit scoring rather than assessment of an individual business proposal.
According to lenders, the main risk to the existence of the program is that financial institutions will eventually not want to offer the program, due to three main reasons: the program is not financially profitable for the financial institutions; the heavy administrative burden of the program; and, the difficulties that arise when financial institutions file claims. The revenues generated from a CSBFP loan do not compensate lenders for the time and effort required setting up the loan and, if required, to make a claim. The resulting low level of profitability discourages lenders from offering the program. Lenders see the heavy administrative burden and difficulties with the claim process as another major risk to the existence of the program. The administration and claims process is all paper-based. Some lenders have decided not to offer the program after negative experiences with CSBFP loan claims, including not having sufficient information about what is acceptable, amounts being contested, and having claims rejected.
Another issue that was identified is that the CSBFP portfolio is heavily concentrated in a few very high risk sectors, thus decreasing the extent of cost recovery that is possible.
The CSBF Program has begun to undertake efforts to mitigate some of the lender associated risks. There is now a focus on better communication with lenders to increase the knowledge about the program. The feasibility of automating some processes so as to alleviate the heavy administrative burden, is being examined.
Discussion
The approach to this question is based on a risk workshop involving a variety of stakeholders working with the CSBF Program at Industry Canada, as well as interviews with lenders.
The number of CSBFP loans has been decreasing year after year since 1999. From a maximum of 17,741 loans in 1999–2000, the number of loans has reached its lowest point in 2007–2008 at 9,015 loans, a reduction of almost 50%.
This downward trend raises concerns about the future of the program. To determine the main threats to the program, lenders, borrowers and CSBFP staff were surveyed about the factors they perceive are the main risks to the program.
Even though their perspective is radically different, there is agreement among lenders and CSBFP staff on the main risks to the program.
CSBFP staff identified the main risk to the program to be that lenders may not see the program as an attractive vehicle due to discrepancies about items eligible under claims, the cap on interest rates and other design features.
According to lenders interviewed, the main risk to the existence of the program is financial institutions not offering the program, because of three main reasons: the program not being financially profitable for the financial institutions, the heavy administrative burden of the program, and, issues arising when financial institutions file claims.
Lenders also mention knowledge of the program as an important risk, a risk that has a lower ranking according to CSBFP staff. The lack of consistent knowledge of the program across different levels within a lending organization may translate into the program not being offered to a client that could benefit from it.
To mitigate some of the above mentioned risks, the CSBF Program has implemented some measures such as increased communication with lenders (to increase the level of knowledge of within the organization) and is examining the possibility of automating some of its processes to reduce the paper burden. Areas such as the interest rate that lending institutions are allowed to charge (which impacts their profitability), are areas that need to be explored. Please refer to Annex H for a discussion of the mitigation measures being undertaken by the program.
Highlights of CSBF Program Risk Workshop
The following are the risks discussed during the risk workshop with CSBFP stakeholders at Industry Canada. Risks are presented in descending order (most important at the top) by impact and likelihood.
- Risk that the Program is not perceived to be an attractive vehicle by the lenders due to Program design, such as items eligible under claims, interest rate caps, and other design features. (Risk #3)
- Risk that individual lender internal policies, actions, etc. may impair ability to achieve goals of the Program. (Risk #24)
- Risk that ability to change the Program is hindered by bureaucracy. (Risk #23)
- Risk that management has a risk-averse culture, limiting opportunities for the Program. (Risk #20)
- Risk that lenders place more weight on financial viability and credit scores than business case potential, thereby limiting the reach of the Program. (Risk #6)
- Risk that inefficiencies in the Program delivery reduce the attractiveness of the Program to lenders. (Risk #27)
- Risk that Program information is not disseminated effectively through the lenders. (Risk #26)
- Risk that the benefits of the Program are not understood, measured and/or communicated at large, reducing support for the Program. (Risk #15)
- Risk that demand for CSBFP loan guarantees might be heavily concentrated in a few very high risk sectors, decreasing the extent of cost recovery that is possible. (Risk #14)
- Risk that the needs of the targeted beneficiaries and stakeholders under the Program are not understood and/or acted upon. (Risk #9)
The relative significance of each of these risks, as well as the perceived likelihood and impact of each of these risks is illustrated in the diagram below:
top of page
Highlights of Lender Interviews
As part of the interview process, lenders were asked their opinion on which are the most important risks to the program.
The majority of lenders presented two factors as the most important risks to the program: lenders deciding not to offer the program because it is not profitable to them, and, lenders deciding not to offer the program because of the heavy administrative burden and issues with claims.
Both of these key risks are consistent with the most significant risks identified by CSBFP management (i.e. the risk that the Program is not perceived to be an attractive vehicle by the lenders due to Program design, such as items eligible under claims, interest rate caps, and other design features). (Risk #3).
Some lenders also mentioned a lack of knowledge of the program as a risk for the program, although this risk is mostly related to the fact that some particular lenders do not do many CSBFP loans and therefore are less comfortable with the program. (Risk #26).
Lenders deciding not to offer the program because it is not profitable
Currently, lenders argue that the revenue generated from CSBFP loans does not compensate for the hours and effort that this type of loans entails. Managing this type of loan, whether it is setting up the loan or preparing a claim, is more time consuming than any type of standard loan. When taking into account the interest rate they are allowed to charge (minus the share of the interest rate that needs to be remitted to the government), the revenues generated by lenders out of a CSBFP loan are very slim (if any).
One particular lender has established a working group to create an economic model to determine the level of profitability of CSBFP loans. The outcome of this analysis will guide them in their decision to continue or discontinue involvement in the program.
Lenders deciding not to offer the program because of the heavy administrative burden and issues with claims
Most lenders mention the administrative burden as one of the main risks for the program. They mention the high amount of forms that need to be filled out (especially for leasehold improvements) as a major nuisance.
Lenders also mention issues with claims as a significant deterrent. It is lender's perception that the claims staff at the CSBF Program is very strict and focus mostly on reasons not to pay the claims, rather than to pay them.
Some of the lenders interviewed expressed a high level of discontent with the program and, were very passionate about not offering the program. They mention past negative experiences, when their claims were refused, as the main reason why they are no longer offering this product to clients.
Risks Realized
Throughout the life of the program, two of the risks have been realized: some lenders have stopped offering the program as it is perceived to be unprofitable, because of its heavy administrative burden or because of past issues with claims. As well, the level of knowledge about the program changes drastically across lenders and across individual organizations, a factor that impacts the likelihood of the program being presented to some clients.
Lenders deciding not to offer the program
Between the beginning of the program and now, there has been a steady decrease of the number of CSBFP loans made. From 17,741 in fiscal year 1999–2000, the number of loans has decreased to 9,015 loans during fiscal year 2007–2008, a decrease of 49.2%.
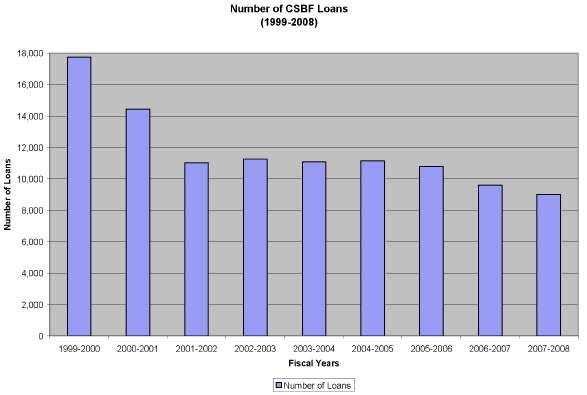
As the chart above shows, the number of CSBFP loans has continuously decreased over time. There was a modest increase in 2002–2003 and 2004–2005, but the overriding tendency is to the decrease.
The table below presents the yearly change in the number of CSBFP loans, and confirms the trend downwards.
| Fiscal Year | Number of Loans | Number of Loans—Yearly Change (%) |
|---|---|---|
| 1999–2000 | 17,741 | |
| 2000–2001 | 14,442 | -18.60% |
| 2001–2002 | 11,016 | -23.72% |
| 2002–2003 | 11,263 | 2.24% |
| 2003–2004 | 11,085 | -1.58% |
| 2004–2005 | 11,143 | 0.52% |
| 2005–2006 | 10,790 | -3.17% |
| 2006–2007 | 9,596 | -11.07% |
| 2007–2008 | 9,015 | -6.05% |
| Total | 106,091 |
In the interviews, lenders voiced their aversion to CSBFP loans and their lack of interest in offering it. Some lenders have already made the decision to stop offering it and other lenders are closely analyzing the profitability of the program.
Program information is not disseminated effectively through lending organization
When lenders were asked about lending officer's level of knowledge of the CSBF Program, there was a variety of answers. The majority of lenders (42%) ranked their level of knowledge as average, while 38% said that their level of knowledge was good. 6.7% ranked their level of knowledge as poor and the same percentage ranked their level of knowledge as excellent.
Most lenders indicate that knowledge of the CSBF Program varies significantly throughout the same organization. Lending officers who do a lot of CSBFP loans have a better grasp of the program, while those within the same organization who do not do as many CSBFP loans will be less knowledgeable of the program. To ensure that lending officers have at least a basic knowledge of the program, all lending organizations have CSBFP relevant information available for their lending officers (through their intranet, on-boarding activities), but it is only natural that only the officers who make heavy use of the program possess a better level of knowledge. This pattern should be avoided, as the less experience the lending officer has on the program, the less it knows about it, which may in turn imply that the less this officer will present the program to its clients.
top of pageOther Possible Reasons for Realized Risks
The reasons for the significant drop in the number of CSBFP loans granted drop have been examined from the perspective of the program characteristics but not from the perspective of the economic environment as a whole.
Accessibility to credit over the first nine years of the program has been relatively easy, especially because it was coupled with low interest rates.
Accessibility of Credit (1999–2009)
The CSBF Program has existed during a time when interest rates have been historically low. Bank of Canada prime interest rates dropped to levels as low as 2.25% in 2002 and 2004. Business prime interest rates also dropped to lows of 4% as depicted in the graph below. Access to financing was easy to obtain, whether using a personal loan for business purposes or a business loan.
In comparing responses between the 2004 and 2007 SME-FDI surveys, there was also a drop in the number and proportion of SMEs that requested debt financing in 2007 compared to 2004 levels. Of those that requested debt financing, 18.5% in 2004 and 12.8% in 2007, the vast majority was approved for financing in both years (81% and 87%, respectively).
| Debt Financing | 2004 | 2007 | ||
|---|---|---|---|---|
| No. of SMEs | % | No. of SMEs | % | |
| Seek Credit | 250,821 | 18.5% | 202,531 | 12.8% |
| Credit Approval | 203,718 | 81.2% | 175,901 | 86.9% |
With the high approval rates, a hypothesis could be made that having access to cheaper funds reduced the demand for programs such as the CSBFP, which in turn could explain the drop in the number of loans.
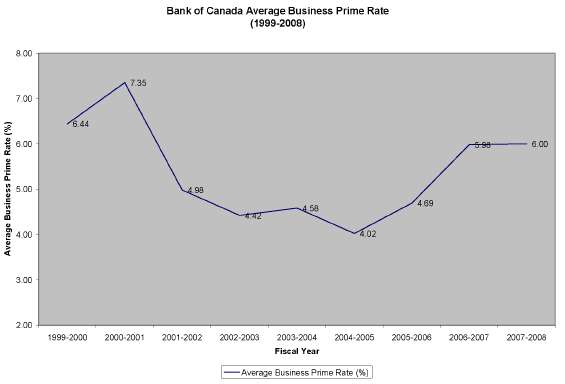
However, when examining the trends in the number of CSBFP loans and comparing them to the trends in the average yearly interest rate, it is clear that there is no direct relationship between the two. The graph below presents the evolution of these two variables.
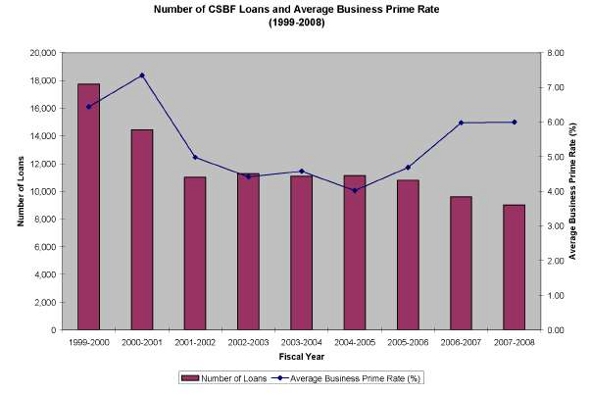
However, this hypothesis does not take into account the high level of lender discontent with the program and the fact that some of them have stopped offering the program or are considering discontinuing it at their institutions. Given the key role that lenders play in the delivery of the program, lender's decisions to offer or not offer the program may have a bigger impact in the number of loans than the interest rate.
48 Canada Works Limited (2009). Canada Small Business Financing Program: Updated Analysis of Incrementality p. 1. (Return to Reference 48)
49 Equinox (2008). Sources of Portfolio Risk and Revenue Generation of the Canada Small Business Financing Program—Phase 2. p. 16. (Return to Reference 49)
50 Equinox (2008). Sources of Portfolio Risk and Revenue Generation of the Canada Small Business Financing Program—Phase 2. p. 16. (Return to Reference 50)
51 BearingPoint (2004). Evaluation of the Canada Small Business Financing Program, Final Report. p. 32. (Return to Reference 51)
52 Ibid. p. 33. (Return to Reference 52)
53 BearingPoint (2004). Evaluation of the Canada Small Business Financing Program, Final Report. p. 34. (Return to Reference 53)
54 Ibid. p. 35. (Return to Reference 54)
55 Note that the term "cohort" in the 2008 longitudinal study represents one calendar year. (Return to Reference 55)
56 Statistics Canada (2008), Economic Impact Study of the Canadian Small Business Financing (CSBF). p. 7. (Return to Reference 56)
57 Ibid. (Return to Reference 57)
58 Ibid. (Return to Reference 58)
59 Statistics Canada (2008), Economic Impact Study of the Canadian Small Business Financing (CSBF). p. 8. (Return to Reference 59)
60 Ibid. (Return to Reference 60)
61 Ibid. (Return to Reference 61)
62 Ibid. p. 12. (Return to Reference 62)
63 Statistics Canada (2008), Economic Impact Study of the Canadian Small Business Financing (CSBF) p. 48. (Return to Reference 63)
64 Ibid. p. 48. (Return to Reference 64)
65 Ibid. p. 8. (Return to Reference 65)
66 Statistics Canada (2008). Longitudinal Economic Impact Study of the Canada Small Business Financing (CSBF) Program. p. 18. (Return to Reference 66)
67 Ibid. p. 14. (Return to Reference 67)
5.0 Cost Effectiveness
5.1 To what extent has the program been able to achieve cost recovery? What are the reasons for this?
Findings
Since its inception, as it is currently structured, the CSBF Program has not been fully cost recoverable. Cost is been defined as "the cost of claims on defaulted loans and leases". Costs are directly proportional to the risk inherent in the CSBFP portfolio of loans. The cost recovery rate for the program's two first cohorts has been forecasted at 67.7% of the first cohort (1999–2004) and 58.9% for the C2 cohort (2004–2009).
Loan risks arise as a result of the age of the firms and the sector in which the business operates. Age of firm is an important determinant of risk. Younger firms are riskier. Industrial sector is also an important determinant of risk. Firms in the "Food Service and drinking places" followed by "Retail Trade" sectors are riskier compared to firms in other industrial sectors. The CSBFP portfolio has a higher level of risk due to the high concentration of younger SMEs, as well as those in the "Food services and Drinking Places" and in the "Retail trade" sectors.
The CSBF Program covers loan losses for those loans that are considered high risk. Conventional lenders would probably not undertake to provide these loans if it were not for the CSBF Program. This translates into high levels of incrementality of the program, representing approximately 80–85%, as presented in a previous question.
With the high level of incrementality that the program has attained and the fact that the C2 cohort (those receiving loans between April 2004-March 2009) is riskier and is occurring during a time period where the demand for the program may be higher, it is anticipated that the gap between claims and fee revenues will continue to exist and most likely expand.
Discussion
The analysis of cost-recovery was based primarily on the in-house cost recovery forecasting work that has been done by CSBF Program, complemented with the review of a research paper on the sources of portfolio risk. There is no discussion of realized claims, which are presented in the Program Description section of this document.
For the purpose of the cost recovery discussion, cost has been defined as "the cost of claims on defaulted loans and leases being balanced by revenues on loans and leases over a period of ten years."68 (Note that the costs associated with the leasing claims are not included in the discussion that follows.) Other costs, such as the salaries of the CSBFP staff and the costs of administering the program are not included in this definition of cost.
The CSBF Program goals of incrementality and cost recovery work in opposite directions. Because the program has a relatively high level of incrementality, it also faces high levels of risk.
Cohort Definition
Each five year period of the program represents one cohort. The C1 cohort is defined as the group of all CSBFP loans granted between April 1999 and March 2004, while the C2 cohort is defined as the group of all CSBFP loans granted between April 2004 and March 2009.
Forecasting
The Program forecasts the potential claims that may materialize. For each fiscal year, the model forecasts the loan defaults over ten year period, the maximum term permitted under the CSBF Program. The actual realization of claims may however, occur at any point over the term of the loan.
The Program has developed more accurate forecasting models in response to the OAG recommendations in 2002. The statistically rigorous econometric models incorporate variables such as the interest and unemployment rates, but also rely on past trends of loan defaults. The claim forecasts generated by these new models for claims associated with loans made from 1999 through 2004 have turned out to be very close to the actual claims made associated with these loans – in particular, the difference between the forecasted claims and actual claims for loans during this period is only about 0.5% of the total value of loans granted during this period.
Net Costs
The Program calculates net costs by taking the value of the loans issued in the year and subtracting both the fees received and the forecasted claims for those loans. The forecasted claims amount is aligned against the value of the loans in the year in which they are made, even though the actual realization of the claim may occur at a future point. Once realizations of claims actually occur, the net cost is revised.
The net cost of the C1 cohort over the possible ten year terms of the loans was estimated at $138.9 million as at March 31st, 2009.
The net cost of the C2 cohort over the possible ten year terms of the loans has been estimated to be $196.4 million as at March 31st, 2009.
The forecasted total cost over the possible 10-year term of the CSBFP loans made during each of the C1 and C2 cohorts, is approximately $335.3 million, or $244.8 million on a net present value basis (with a discount rate of 5%).
Cost Recovery
Since its inception, the CSBF Program has not been fully cost recoverable. The cost recovery rate for the program's two first cohorts has been forecasted at 67.7% for the first cohort (1999–2004) and 58.9% for the C2 cohort (2004–2009), using the total amount of all expected claim payments, over the ten years of each year's cohort.
For the C2 cohort of loans, the cost recovery percentage is expected to be lower compared to the C1 cohort. As of March 31st 2009, it was estimated that it will be 58.9%.
A summary of key cost recovery data is presented below, based on forecasted defaults:
| C1 Cohort (1999 to 2004) | C2 Cohort (2004 to 2009) | |
|---|---|---|
| Total Revenues (forecasted as of March 31st, 2009) | $291.6 million | $280.9 million |
| Total Claims (forecasted as of March 31st, 2009) | $430.5 million | $477.4 million |
| Net Cost (forecasted as of March 31st, 2009) | $138.9 million | $196.4 million |
| Cost Recovery Percentage | 67.7% | 58.9% |
Future Cost Recovery (5 years)
C1 Cohort
The C1 cohort has been running for a long time. The last year of that cohort was 2003–2004. Given the fact that loan defaults occur most often during the second and third year of the loan and that lenders have a window of three years to file claims, major changes to this cohort are not expected.
C2 Cohort
The last year of the C2 cohort was the fiscal year 2008–2009. Given the fact that this cohort is relatively young, there is a probability that the actual expenses to date can change significantly.
Volatility is expected, considering that this cohort will probably be significantly affected by the 2007–2009 economic slowdown.
Risk Affecting Claims
Achieving a desirable balance between default costs and fee revenues, while maintaining a high degree of incrementality, is a challenge in a loan guarantee program. To do so it is important to examine drivers of risk and sources of revenues within the CSBFP loan portfolio and to determine how risks might affect both incrementality and cost recovery.
Equinox undertook an analysis of the CSBFP portfolio of loans to determine, through regression analysis, which factors posed the greatest risks to the program.69 The results were used to develop a simulation model that may be used by the CSBF Program to examine how changes in portfolio composition and program parameters collectively affect the estimated balance between fee incomes and losses from honouring claims. This model is very new and it is not addressed here.
The Equinox examination of the impacts of loan and borrower attributes on the risk of the CSBFP loan portfolio confirms that SMEs in the "Food services and drinking establishments" and in the "Retail trade" sectors pose the highest risk. Younger firms also present higher risks to the portfolio.
Program statistics show that there has been a trend towards higher concentrations of SMEs in riskier industrial sectors such as "Food Service and drinking establishments" and "Retail Trade". This increases the CSBFP portfolio overall level of risk and represents a threat to the cost recovery objective of the program. SMEs in these two sectors account for 40% of the CSBFP portfolio.
While leasehold improvement loans and loans to franchises are not inherently riskier per se, they are more prevalent in the "Food services and drinking establishments" and in the "Retail trade" sectors, which are riskier sectors and as mentioned, represent a significant share of the CSBFP portfolio.
As was mentioned in the previous sections, the level of incrementality of the program has increased in the last few years and this has had an impact on the cost recovery aspect of the program, as claims have also increased.
Please see Annex I for a more detailed discussion regarding the forecasted claims.
top of page5.2 What are the economic benefits of the program compared to its costs?
Findings
The CSBF Program has generated significant benefits to Canadian society. Total net benefits of the program are estimated to be $4,869.7 million. The total net present value of costs of the program is $728.5 million. The total net present value of benefits of the program is $5,598.2 million.
The CSBF Program has a positive impact on the viability of SMEs including growth in sales revenues, firm survival rates, and growth in total assets. Although overall employment levels at CSBFP firms did not generally grow when both surviving firms and those that went out of business were examined, surviving firms exhibit employment growth. SMEs applying for CSBFP loans must identify employment creation on their loan application forms. These numbers are very optimistic compared to actual realizations. However, CSBFP firms are able to retain an average of 18,000 more jobs each year when compared with similar SMEs.
SMEs receiving loans under the CSBF Program submitted additional federal income tax remittances from incremental salaries and wages being paid by CSBFP firms, and additional GST revenues as a result of loan expenditures made by CSBFP borrowers.
Although the CSBF Program is not cost-recoverable when administration and registration fees are the only revenues used in the calculation, it can be considered cost-recoverable over the study period when federal income taxes and GST are considered.
With respect to secondary effects of CSBFP loan expenditures in the economy, an average of 4,800 additional jobs was created with suppliers that sold loan-eligible assets to CSBFP firms each year. However, these figures do not adjust for any displacement that may occur.
Discussion
A separate Cost Benefit analysis study of the CSBF Program was undertaken to complement the evaluation and inform this question. The complete report can be found in Annex J.
Background
The Cost-Benefit Analysis was conducted over a nine-year time period from 1999–2000 to 2007–2008. The analysis period includes the time period since the creation of the CSBF loan guarantee program in 1999–2000. The costs and benefits, as well as broader economic impacts associated with loans provided in any given year are realized during a lag period, in some cases even near the end of the maximum 10-year amortization period for loans. 2008–2009 has been excluded from the analysis due to a lack of data for that specific period at the time of this study.
Approach and Methodology for the Cost-Benefit Study
Analysis of Costs and Benefits
Costs
As part of the Cost-Benefit Analysis, the cost of resources to administer the program, coupled with any other costs directly incurred by parties involved (e.g. Industry Canada, lenders, borrowers, etc.) that would otherwise not be borne in the absence of the CSBF Program, have been analyzed.
The costs that were analyzed include:
- Salaries and benefits of Industry Canada staff involved in the administration and management of the CSBF Program;
- Direct operating expenditures for the CSBF Program including IM/IT leases, travel costs, supplies, and professional contracts;
- Capital expenditures including purchases of IT systems and other tangible assets;
- Costs of loan defaults to Industry Canada (payment of claims); and
- Costs of loan defaults to lenders (loan losses).
Benefits
A number of direct benefits of the CSBF Program that result from administering the program have been analyzed, as well as the impact on the economy of loans made through the program and related/supporting expenditures. Benefits are broadly defined as the activities bearing economic impact as a result of CSBFP-related activities in the economy.
Benefits assessed include:
- Interest revenues earned by lenders from CSBFP loans;
- Additional salaries and wages paid by borrowers;
- Impacts of payments made to suppliers as a result of CSBFP loans;
- Incremental indirect impacts from expenditures of suppliers to suppliers (multiplier effects); and
- Registration and administration fees paid by borrowers to Industry Canada.
As part of the analysis of net program benefits, benefits have been apportioned for the percentage of total economic impact that can be attributed to the CSBF Program (i.e., only those impacts that are incremental to the status quo are analyzed). The description of benefits does not include an adjustment for the rate of incrementality (i.e. percent of CSBFP borrowers who would have received a loan in the absence of the CSBF Program), however this adjustment has been made when analyzing the net benefits of the program.
In order to analyze the costs and benefits of the CSBF Program, data was obtained from a number of sources including Statistics Canada, the CSBF Program database, interviews with representatives of lender organizations and stakeholder organizations, and a number of reports.
Analysis of Broader and Secondary Economic Impacts
There are a number of broader economic impacts of the program that are relevant to understanding the overall benefits and impacts of the program on key participants (e.g. government of Canada, borrowers, Canadian public) that are not typically included in a social cost-benefit analysis. Selected fiscal impacts of the program that provide insight into the cost-recovery of the program when tax revenues are assessed, the employment impacts of the program measured in terms of jobs, and impacts on the viability of small businesses that participate in the program were analyzed.
top of pageEstimated Costs of the CSBF Program
| ($M) | 1999/ 2000 | 2000/ 2001 | 2001/ 2002 | 2002/ 2003 | 2003/ 2004 | 2004/ 2005 | 2005/ 2006 | 2006/ 2007 | 2007/ 2008 |
|---|---|---|---|---|---|---|---|---|---|
| Total Costs (Current Dollars) | 1.908 | 18.680 | 52.223 | 82.493 | 86.134 | 91.647 | 86.438 | 96.285 | 116.923 |
| A. Salaries and Benefits of Program Staff | 0.988 | 0.900 | 1.154 | 1.852 | 2.404 | 2.521 | 2.581 | 2.039 | 2.339 |
| B. Direct operating Expenditures of CSBF Program | 0.335 | 0.522 | 0.765 | 1.212 | 1.036 | 1.108 | 0.982 | 0.947 | 0.773 |
| C. Capital Expenditures | - | - | - | - | - | - | 0.330 | 0.360 | 0.390 |
| D. Claims Paid on Loan Defaults | 0.495 | 14.769 | 43.444 | 68.791 | 71.664 | 76.460 | 71.679 | 80.289 | 98.723 |
| E. Loan Default Costs to Lenders | 0.091 | 2.489 | 6.859 | 10.637 | 11.030 | 11.557 | 10.865 | 12.650 | 14.699 |
Salaries and Benefits of Staff Administering CSBF Program
The costs to manage and administer the program are needed to assess the full annual costs of the program to the Government. The cost of salaries and staff benefits of who manage the CSBF Program, register loans and claims, process claims, and are responsible for program policy and research for the CSBF Program were estimated and analyzed.
CSBFP salaries, benefits and corporate management have grown from $987,692 in 1999/2000 to $2,338,557 in 2007/08 as a result of an increase in the combined total of new loans registered and claims made against the CSBF Program. Staff time required to register, process and audit a claim for a CSBFP loan is significantly greater than the total time required to register a new loan. This led to a significant increase in estimated costs in 2001/02 when a greater number of claims were being made against the program.
Operating Expenditures
Administrative costs of the program include operating expenditures such as overhead costs (e.g. training for staff, etc.) and direct operating costs (such as resources, products, contracting, and IM/IT). Industry Canada reports against these items together as Operating & Maintenance expenditures.
Operating and maintenance costs for the CSBF Program averaged about $850,000, and ranged between a low of $335,000 in 1999/2000 and a high of $1,212,000 in 2002/03. Operating and maintenance expenditures were highly variable from year to year since they include costs that are not generally tied to the number of loans issued under the program nor claims made. Estimated O&M expenditures attributable to the CSBF Program were relatively low in 1999/2000 and 2000/01 as a result of a high number of claims that were processed against the SBLA program, and lower total O&M expenditures of the SBFD.
Capital Expenditures Claims Paid on Loan Defaults
Capital expenditures were reported separately for the SBFD only for 2005/06, 2006/07, and 2007/08. For 1999/2000 to 2004/05, capital expenditure data for the SBFD were recorded with capital expenditures for other programs and it is not possible to accurately separate out the costs attributable only to this program.
Capital expenditures between 2005/06 to 2007/08 were between $330,000 and $390,000. Since details about the nature of the capital expenditures made were not available (e.g. IT systems, vehicles, etc.), it was not possible to amortize the costs over the useful life of the asset.
Claims Paid on Loan Defaults
Claims paid against CSBFP loan defaults have been growing steadily since the introduction of the CSBF Program. For any given cohort of loans, the majority of claims occur about two to four years after the year in which the loans were issued. Although the average loan amounts have been steadily growing over the study period, the average claim size has remained relatively stable in the range of $45,000–$49,000 between 2000/01 and 2006/07, with a slight increase to about $54,000 in 2007/08.
Certain industry sectors were found to account for a high share of claims paid. The largest total claims paid on loan defaults have been observed in the Food & beverage services, Other services, Retail trade, and Manufacturing sectors. For several industry sectors, the share was disproportionately high. The Food & Beverage Services and Manufacturing sectors accounted for 33.1% and 13.2% of claims respectively, whereas the total loans issued to SME's in those sectors represent 24.9%, and 8.3% of the total value of loans issued.
The largest share of total claims paid against defaulted loans were attributable to new SMEs that were less than one year old, mainly due to the fact that the greatest number of loans granted under the CSBF Program was by far to SMEs less than one year old. Loan default claims for equipment and leasehold improvement loans were disproportionately greater than default claims for real property loans.
Loan Default Costs to Lenders
The default costs to lenders are calculated on the loan amount after all repossession actions, and personal guarantees are realized. The lender loss represents 15 per cent of loan principal outstanding on defaulted loans after any realizations were made.
Lender losses were comparatively low between 1999/2000 and 2001/02 as a result of fewer claims being submitted during that time. Increases in lender losses observed in 2006/07 and 2007/08 were due to an increase in the number of claims made and the average claim size per defaulted loan, rather than an increase in the size of the total loan portfolio.
The assessment of claims paid to lenders is based on an assessment of eligible claims by Industry Canada. The amount requested by lenders may be reduced, or in some cases, rejected based on an assessment of information submitted by lenders.
top of pageEstimated Benefits of the CSBF Program
| ($M) | 1999/ 2000 | 2000/ 2001 | 2001/ 2002 | 2002/ 2003 | 2003/ 2004 | 2004/ 2005 | 2005/ 2006 | 2006/ 2007 | 2007/ 2008 |
|---|---|---|---|---|---|---|---|---|---|
| Total | 645.4 | 694.3 | 666.1 | 637.3 | 798.0 | 852.7 | 982.7 | 1,030.4 | 878.1 |
| A. Administrative Expenditures by Lenders: Salaries and Wages | - | - | - | - | - | - | - | - | - |
| B. Direct Operating Expenditures by Lenders | - | - | - | - | - | - | - | - | - |
| C. Interest Revenues on Loans | 20.896 | 57.376 | 34.398 | 34.152 | 62.448 | 47.231 | 77.065 | 99.727 | 101.330 |
| D. Incremental Profits for CSBFP Borrowers | - | - | - | - | - | - | - | - | - |
| E. Salaries and Wages Paid by Borrowers | - | 78.743 | 187.661 | 129.624 | 239.190 | 288.862 | 363.573 | 408.612 | 264.658 |
| F. Payments to Suppliers as a Result of Loans | 348.183 | 302.386 | 234.277 | 249.027 | 260.385 | 271.257 | 284.767 | 274.110 | 268.269 |
| G. Incremental Indirect Impacts from Expenditures of Suppliers to Suppliers | 242.937 | 212.698 | 165.222 | 176.017 | 184.454 | 191.506 | 200.897 | 192.328 | 187.608 |
| H. Administration and Registration Fees Paid | 33.426 | 43.138 | 44.569 | 48.432 | 51.545 | 53.839 | 56.367 | 55.664 | 56.201 |
Interest Revenues on Loans
Interest revenues on loans represent revenue to lenders, where net revenues are the difference between the interest charged to borrowers, and lenders' cost of capital plus administration fees. Assumptions on the lenders' cost of capital were confirmed through interviews with lenders and the Canadian Bankers Association. The net revenues are used to pay for salaries and wages, benefits, direct operating expenditures, and are also profits to lenders. Net interest revenues to lenders were between $20.9 million and $101.3 million during the study period.
Salaries and Wages Paid by Borrowers
Additional salaries and wages are a measure of value created through employment driven by loan receipts, and subsequent capital investment. The Economic Impact Study of the Canadian Small Business Financing Program (2008) conducted by Statistics Canada found an increase in average wages paid by CSBFP borrowers when compared to a similar group of SMEs. For the analysis, it was assumed that increases in average wages by CSBFP borrowers above a comparison group are incremental (i.e. these borrowers would not have received financing elsewhere and no growth in average wages above the comparison group would have taken place).
Total additional salaries and wages have grown from about $79 million in 2000/01 to $265 million in 2007/08. The majority of total additional wages is a result of higher growth in average wages in CSBFP firms than comparable SMEs, rather than growth in total employment across CSBFP firms.
Impacts of Payments to Suppliers as a Result of Loans
Direct expenditures by borrowers on loan-eligible capital investments have positive economic impact, in that they stimulate demand for goods and services in the Canadian economy. Statistics Canada's Input-Output model was used to estimate the impacts of loan expenditures in the Canadian economy in the year the expenditure was made. Specifically, direct GDP at basic prices by industry was the measure used to value the contribution of loan expenditures to growth in the economy.
The average contribution of CSBFP loans to direct GDP was about $277 million each fiscal year. Direct GDP resulting from loan expenditures was at its highest in 1999/2000 when the total value of loans issued was the greatest. As a result of a decrease in the total value of loans issued in subsequent years, the contribution to direct GDP also declined. The vast majority of value-added/contribution to GDP is accrued by the manufacturing, retail and wholesale trade, and construction industries. The professional, scientific and technical services sector also accounted for a large contribution to GDP.
Indirect Impacts from Expenditures of Suppliers to Suppliers
Expenditures by suppliers to suppliers result in indirect incremental expenditures in the Canadian economy (salaries, wages and benefits, profits). Specifically, indirect GDP at basic prices by industry was the measure used to value the contribution of supplier expenditures to growth in the economy.
Indirect GDP resulting from loan expenditures was $242.9 million in 1999/2000 and gradually decreased to $187.6 million in 2007/08. Indirect GDP accounts for a large share of the impact of loan expenditures in the economy.
Throughout the study period, indirect GDP at basic prices represented about 18.5 per cent of loan expenditures. Although the Manufacturing and wholesale trade sectors continue to account for a large share of the contributions to GDP, Transportation and warehousing; Finance, insurance, real estate and rental and leasing; and Professional, scientific and technical services also account for a significant share of the contribution to GDP.
Administration and Registration Fees Paid by Borrowers to Industry Canada
Administration and registration fees paid by borrowers are equivalent to service charges paid to Government as a supplier. A two per cent registration fee is paid on the total value of the loan when it is registered by the lender with Industry Canada. An administration fee of 1.25 per cent per annum is paid on the outstanding value of each loan. Total registration fees declined from $27 million in 1999/2000 to $20 million in 2007/08 as a result of a decreasing value of loans issued each year. Administration fees have grown from $6.5 million in 1999/2000 to $33.6 million in 2007/08.
top of pageEstimated Net Program Benefits
Assumptions
Discount Rate
A discount rate of 5 per cent was used to calculate the present value of costs and benefits, which was based on the average Bank of Canada 10-year bond rates over the time period analyzed.
Rate of Incrementality
The rate of incrementality was applied to benefits that were incremental to CSBFP borrowers. Therefore, it is assumed that 75% of incremental benefits that were a result of financing obtained through the CSBF Program.
top of pageTotal Program Benefits
The benefits of the CSBF Program to the economy exceed the costs by a significant margin. The net present value (NPV) of net program benefits is over $4.5 billion between 1999/2000 to 2007/08. For every dollar of costs incurred in relation to the program, it was estimated that an average of $7.20 in benefits were accrued.
Sensitivity Analysis
A sensitivity analysis was conducted that includes two additional scenarios (low and high scenarios) where the values of key benefits and assumptions are varied. The main Cost-Benefit analysis presented above constitutes the "medium" scenario.
The following key assumptions were varied to arrive at the high and low scenarios:
- Discount rate;
- Rate of incrementality;
- Costs of funds to lenders or business prime rate;
- Total additional salaries and wages; and
- Share of loan expenditures that contribute to direct and indirect GDP growth.
The sensitivity analysis showed that program benefits significantly exceed program costs even when benefit-cost model assumptions are varied. The difference between the scenarios is mainly due to the differences in additional wages paid by borrowers, and the impact of loan expenditures on suppliers. In the High Scenario, the net program benefits were estimated to be about $6,611.7 million and the benefit-cost ratio was 9.3. In the Low Scenario, the net program benefits were estimated to be about $3,568 million and the benefit-cost ratio was 6.2.
top of pageBroader and Secondary Economic Impacts
Employment
Analysis in the Statistics Canada Economic Impact Study (2008) indicated that certain cohorts of CSBFP borrowers experience overall employment growth as a group, for all other cohorts there was an observed decrease in the number of employees over time. However, CSBFP borrowers experienced growth in the number of employees, when adjusted for firm survival rates.
Total employment that may be attributed to loans issued under the CSBF Program has grown steadily from about 3,300 in 2000/01 to a peak of about 34,000 in 2004/05 largely due to the increasing cumulative number of loans registered with the program and positive incremental employment during that time. Total employment subsequently decreased to just over 15,000 in 2006/07 and 2007/08 as a result of a reduced incremental employment and a slight decrease in the number of new loans being issued each year. The incremental employment figures discussed here represent additional employment growth above a comparison group of SMEs, rather than overall employment growth (for several cohorts of borrowers, total employment was decreasing).
Borrowers are required to estimate additional employment as a direct result of the loan on the CSBFP Loan Registration Form. These job creation numbers are then included in the Annual Reports of the CSBF Program. These self-reported measures of employment vary significantly from objective measures based on Statistics Canada analysis and are unlikely to be a reliable source of information of job creation as a result of the program.
| Employment/ Firm | 2000/ 2001 | 2001/ 2002 | 2002/ 2003 | 2003/ 2004 | 2004/ 2005 | 2005/ 2006 | 2006/ 2007 | 2007/ 2008 |
|---|---|---|---|---|---|---|---|---|
| Self-reported | 55,314 | 95,572 | 122,235 | 146,776 | 169,146 | 150,094 | 120,584 | 102,727 |
| Statistics Canada | 3,337 | 9,698 | 20,402 | 26,036 | 34,198 | 24,630 | 15,194 | 15,405 |
As a result of expenditures made by borrowers to acquire assets using loans issued through the CSBF Program, additional employment is also created. It was estimated that an average of 4,800 additional jobs (direct FTEs) were created per year as a result of loan expenditures, before any adjustments for displacement.
Impacts on SME Viability
Analysis of impacts of the CSBF Program on the viability of SMEs indicated a positive impact on growth in sales revenues, firm survival rates, and growth in total assets. Increases in sales revenues by CSBFP firms when compared to other SMEs were estimated to contribute up to $5.6 billion (2004–2005), however there has been a downward trend in more recent years. In addition, CSBFP firms had consistently higher survival rates which translated into several hundred more CSBFP firms surviving each year for each cohort of borrowers, when compared to other SMEs.
Additional growth in total assets of CSBFP borrowers when compared with similar SMEs is highly variable from year to year. Total additional business investment as represented by growth in total assets for CSBFP borrowers was always greater than for comparable SMEs with the exception of 2002–2003.
Fiscal Impacts
Although the CSBF Program is not cost-recoverable when administration and registration fees are the only revenues used in the calculation, it can be considered cost-recoverable over the study period when federal income taxes and GST are considered. Additional federal income tax remittances resulting from incremental salaries and wages being paid by CSBFP firms were an average of about $39 million each fiscal year. Furthermore, additional tax revenues were accrued to both the Government of Canada and provincial governments as a result of loan expenditures made by CSBFP borrowers. In particular, GST remittances to the federal government averaged about $24 million a year. These findings have implications for the overall cost recovery of the CSBF Program.
68 Canada Small Business Financing Act—Annual Report 2006–2007 (PDF). (Return to Reference 68)
69 Equinox. Sources of Risk and Revenue Generation of the Canada Small Business Financing Program, Phase 1 and 2 (2008). (Return to Reference 69)
6.0 Program Delivery
6.1 What are the factors that influence lenders to offer this program to potential clients?
Findings
The majority of lenders consider a combination of multiple factors when assessing a client for credit products. Lenders assess what is most commonly referred to as the five Cs of credit: capacity, capital, collateral, conditions, and character. Due diligence is required to assess the risk that the lender may incur when extending credit. Factors that play a significant role in obtaining a business loan are: business plan, the individual asking for the loan and the SME management team.
Lenders assessing a client for a business loan do so for their own institution's products first. After undertaking their due diligence in assessing the client and the type of credit being sought, a decision is made as to whether the lender is willing to undertake the risk. If it is determined that the risk is higher than the lender is willing to take, then the lender can either refuse the request or refer the client to other options. As seen previously, lenders often refer higher risk SME clients to the BDC. Or, if the lender wants to retain the loan within their institution, they will seek to decrease their risk by offering the loan under a loan guarantee program, such as the CSBF Program.
The key factor influencing lenders to offer the CSBF Program to potential clients was lack of collateral. Size of firm and age of firm were tied as the other two top reasons for offering the client the loan under the Program. Industrial sector, a factor that has often been associated with loan default risk, was only identified as the top reason by 13% of lenders.
Knowledge of the CSBF Program also is a factor that influences lenders to offer the program. The level of awareness of lending officers' is average to good. While most financial institutions provide CSBF Program training to lending officers and provide easy to access references through the intranet or internal publications, lenders stated that they also rely on previous experience with the program and entrepreneurship centers for their main sources of information on the CSBF Program.
According to borrower representatives, the main reasons why lenders would present the CSBF Program include issues with the SME's owner financial situation (lack of collateral, bank's credit scoring) and lack of information about the business.
Discussion
The source of information for this question was based exclusively on the interviews to lenders and borrower representatives. The interview process also revealed the factors that push lenders to offer the CSBF Program to their clients rather than to offer them one of their own standard loans.
Both lenders and borrower representatives were presented with a list of factors that are most often identified in academic literature as reasons why SMEs are denied financing. They were asked to rank them in order of importance to the financing decision, particularly when considering whether to offer a loan under the CSBF Program, and were also asked if they had any other specific reasons that would cause a decision to deny credit to SMEs. The factors were as follows:
- Size of firm
- Age of firm
- Firm's Industry
- Lack of collateral
- Lack of client's history with financial institution
- Issues related to firm owner's financial situation
- Issues with business fundamentals
- Not enough information about firm's business
Lenders
Lender's responses varied as to their rankings of the above reasons. The following table presents the rankings provided by lenders and their justification.
| Rank | Factor | Justification |
|---|---|---|
| 1 | Lack of collateral | Banks need to know the value of assets that back its loans |
| 2 and 3 | Size and age of firm | Age of firm, especially in the case of startups is crucial and is a good measure of loan risk. |
| 4 | Industrial sector | SMEs in specific sectors have higher probabilities of defaulting on loans |
| 5 | Lack of client's history with financial institution | Lenders would offer a CSBFP loan to clients who do not have a history with their institution. The relationship with the client would develop throughout the duration of the CSBFP loan and the lender may be able to offer client a regular loan in the future. |
Some lenders declined to rank the factors and mentioned that they adopt a "complete picture" approach when assessing a borrower's file. Rather than focusing on one specific area of the SME, these lenders look at all factors before making a decision. To those lenders, the key factors included the business plan, the individual asking for a loan and the SME's management team.
Lack of collateral
The most often selected "top" factor as to why lenders would offer a loan under the CSBF Program was lack of collateral. This was selected as the top factor by 30% of lenders. Lenders selected this as the number one factor because banks need to know there is value to the firm's assets, as this is the only way the bank can recover some of the funds lent if there was a default.
In most cases, lenders would define "collateral" as the firm's assets. However, in cases when the SME did not have an acceptable level of assets, lenders would examine the borrower's personal assets.
Size and age of firm
Size of firm and age of firm were also quoted as top reasons to use the CSBF Program, both of them with 17% of the responses. When it comes to size of firm, five lenders (17%) selected that factor as the most important factor, but, at the same time, two lenders explicitly mention that size is not a factor. Lenders who picked this factor as the main one argue that size is important to them because of the $5 million in revenues cap to be eligible for the CSBF Program.
Lenders were varied in their opinion as to the degree that the age of the firm influenced their consideration as to whether to use the CSBF Program. Some lenders mentioned that "in the life of a start up, age of the firm is very important (whether the business is in its first year or third year) and, that the first two years are "critical". Other lenders said that they use age of firm as an indicator of the level of risk. If the business has existed for a few years and has some credit history, the lender will be able to check past behavior, which is often the best indicator of future behavior.
Firm's industry
Firm's industry was selected as the top factor by 4 lenders (13%). Opinions on the industrial sector as a critical factor in the decision to present a CSBFP loan are very different and often contradict each other. For instance, two lenders responded that they do not systematically look at industry and that to them it is not a significant factor. In comparison, lenders who selected it as a top reason had very strong reasons to do so.
When it comes to the industrial sector, some lenders have a list of "banned" industries (i.e. adult entertainment, gambling) and some lenders actually have a list of strategic sectors in which they would like to have loans.
Lack of client's history with financial institution
It is noteworthy that only one lender mentioned this as one of the main reasons to offer the client a CSBFP loan. This lender uses the CSBF Program until the client has an established reputation with the financial institution. Once the lender was comfortable with the client, he presents standard loans rather than one under the CSBF Program.
Multiple factors
Five lenders, 17% of those interviewed, did not single out one factor that would cause them to offer a loan under the CSBF Program.
A significant share of lenders do not focus on one aspect in particular when making their lending decisions, rather they look at the combination of the different factors. Lenders agree that being riskier with regard to one factor (age of firm, or firm's industry) does not disqualify a potential borrower. Lenders would look for other, stronger factors that would compensate for the weaknesses in the other areas.
The majority of lenders mentioned that when it comes to making a decision about a loan they pay particularly close attention to three main factors: the business plan, the individual asking for the loan, and the management team.
Level of knowledge of the CSBF Program
When it comes to the level of knowledge of the program by financial institution's lending officers, most of the responses were "average" to "good". Lenders mention that CSBFP resources are readily available to lending officers either through the intranet or other in-house material. Some lenders stated that the level of knowledge of their officers was low, and that they have taken measures to remedy this.
Financial institution's lending practices
When asked about the context in which the CSBF Program is presented to clients, all lenders mentioned that the program is presented after an initial detailed discussion with the client (some lenders would carefully analyze the file before meeting the client for the first time). The majority of lenders would prefer to give the client a standard loan from their own organization rather than one guaranteed under the CSBF Program. When describing the process followed, lenders mention that the process for a standard loan and a CSBFP loan is the same, and the same due diligence and rigour is applied to the client's file for either loan. If after careful analysis the client does not meet the requirements for a standard loan, the lending officer will present the CSBF Program.
In the case of startups, some lenders present the program sooner, as the CSBF Program is the only option available to them. Lenders were keen to indicate that acceptance into the CSBF Program is not automatic and that borrowers need to meet specific requirements in order for their application to be accepted.
Borrowers
Borrowers do not have in-depth knowledge as to the specific factors that lenders use to assess their credit application, nor their weighting, although there are many sources of advice on this issue provided by business organizations (such as the Canada Business Network) and lending institutions themselves (many of whom offer advice to SMEs on how to ensure they present a good case for lending requests).
In the interviews with borrower representatives, only two were able to rank the reasons that influence lenders to offer the program, and their answers are radically different.
One borrower representative stated that the main trigger leading lenders to present the CSBF Program is related to issues with the SME's owner, the second factor being "lack of collateral", and "other" (credit score) as the third. According to this respondent, banks conduct a credit score on borrowers, and this has a negative impact on the SME's chances of getting financing. For instance, people who have had financial difficulties in the past would not have an acceptable credit score and would not be able to obtain financing, even though they may have a strong business case.
The other borrower representative stated that the top reason why lenders present the CSBF Program is when there is not enough information about the firm's business. Also mentioned as additional reasons for the program to be presented was a series of SME's intrinsic characteristics including: age of firm; size of firm; and the firm's industry.
top of page6.2 To what extent do potential clients request that the CSBF Program be used when it is indicated that their application might otherwise not be successful?
Findings
Overall, according to lenders, the majority of borrowers do not explicitly request the CSBF Program, although borrowers' awareness of the program has increased in the last few years. Lenders who deal with CSBFP loans on a regular basis mention that borrowers are aware of the program and sometimes ask for it. However, lenders who do not deal with CSBFP loans on a regular basis were more prone to say that the level of awareness of borrowers was low, and that borrowers did not ask for the program.
Generally there is a low level of awareness about the CSBF Program, particularly within its own client population. Two surveys were conducted to determine awareness of the program, one in 2001 and the most recent one in 2007. A sample of both CSBFP borrowers' and comparator group of SMEs with characteristics similar to borrowers, were surveyed. The findings are similar between two surveys. Only three-quarters of the CSBFP clients recalled the program in general and only 25% by name – despite the fact that all of the companies received a loan under the program in the 12 months prior to the survey.
There is also very limited knowledge of the CSBF Program among the general SME population. Not many SMEs, neither CSBFP clients nor non-CSBFP clients whose characteristics are similar to CSBFP clients, were able to identify the program or provide details about it. Most CSBFP borrowers became aware of the program through their lending officer; although the majority said that the program was not presented to them as an option. Most non-CSBFP borrowers mentioned that the lending officer did not explicitly present the CSBF Program to them.
Discussion
The approach to this question was based on the review and analysis of two reports: the 2001 CSBFA Awareness Study70, examined as part of the 2004 BearingPoint evaluation of the CSBF Program; and the 2007 Phoenix study on Awareness and Satisfaction. Because this evaluation question was not specifically asked in the two Awareness surveys, and another borrowers survey was not conducted for this evaluation, the discussion of this question also considers the awareness of the CSBF Program by SMEs; both those who are CSBFP clients, and those SMEs who are not CSBFP clients, but who have similar characteristics to them. The analysis of the two survey reports was complemented by interviews with lenders. The level of awareness of the program could have an effect on whether an SME specifically requests that the lender offers them their loan under the CSBF Program.
Research papers and studies reviewed for the 2004 evaluation as well as the 2007 Phoenix study raised the issue of the low level of borrower awareness. For instance, the 2001 awareness study states that only 81% of business managers from SMEs benefiting from the CSBF Program at the time of the survey were aware of a federal program that guarantees SME loans. The 2007 Phoenix study reflects a similar lack of awareness when it comes to the program.
Lenders were specifically asked whether SMEs raise the CSBF Program when discussing loan options. In examining the extent to which the program is either requested by SMEs or presented to them, the findings of the 2007 Awareness Survey and the results of lender interviews were compiled into four categories: SMEs general awareness of federal government loan guarantee programs; SMEs awareness of the CSBF Program by name; SMEs awareness of the specific CSBF Program parameters; and, whether the CSBF Program was specifically presented to the SME by the loans officer.
Awareness of federal government loan guarantee programs
To measure the level of awareness of federal government guaranteed loan programs, survey respondents were asked if they were aware of a federal government programs that guaranteed the loans of small businesses and shared the risks with the financial institution.
71% of all CSBFP borrowers claimed to be aware of a federal government program, while the balance was not aware of them. Among non-CSBFP borrowing SMEs, only 28% of them were aware of such government programs, a significantly lower percentage compared to the 2001 percentage71.
Awareness of the CSBF Program by name
To determine the level of awareness of the CSBF Program in particular, respondents who were aware of the federal programs that guarantee loans of small business were asked if they knew the name of any of those programs.
Among CSBFP borrower firms, only 4% of borrowers identified the CSBF Program by name without any additional help, and, when provided with help, 25% of executives of CSBFP borrowing organizations were able to identify the program. Among non-CSBFP borrowing SMEs, the level of awareness is even lower compared to that of CSBFP borrowers. Only 19% confirmed awareness of the program by name, and this in an aided manner.
No conclusive answer was obtained from lender interviews about the lenders' perception of borrowers' awareness. Responses echoed to a certain extent, the results of past studies, but provided some nuances as to the type of awareness.
Lenders' response varies significantly based on their level of involvement with the CSBF Program. When analyzing the interview results, responses were split among two "involvement" categories:
- Lenders who do not deal with CSBFP loans on a regular basis, and,
- Lenders who deal with a significant volume of CSBFP loans.
| Lender's Volume of CSBFP Loans | Perceived Awareness Level of Client | Evolution of Awareness Level |
|---|---|---|
| Low | Low level of awareness—Clients seldom raise possibility of CSBF Program to lending officer | N/A |
| High | Higher level of awareness—There are repeated instances in which the client brings up the CSBF Program to the lending officer | Clients' awareness level has increased over the last four years. |
When asked about whether clients mentioned the CSBF Program when meeting lending officers, the responses from lender interviews were varied, ranging from "No" (5%) to "Very few" (20%), to "Not often" (15%), to Some (15%) and then to Yes (45%). The level of lending may be a factor that influenced the responses, as lenders who do not have very many loans under the CSBF Program were more prone to say that borrowers did not bring up the program very often. Lenders who have a high volume of loans under the CSBF Program had seen more borrowers come in with existing knowledge about the program.
Lenders who said that borrowers actually bring up the program mentioned two particular contexts in which this takes place. Borrowers who are existing CSBFP clients have a tendency to ask for it again, and, also, entrepreneurs who have attended an entrepreneurship information session or have had advice from their accountants know about the program. According to lenders, a lot of clients are informed about the program by entrepreneur centers who suggest presenting the CSBF Program as their financing option in their business plan.
Lenders also note that borrowers' level of awareness of the CSBF Program has increased over the course of the last few years due to the knowledge acquired through previous experiences with the program, the availability of CSBF Program information on the internet, and the knowledge acquired through visits to entrepreneur centers (where borrowers are encouraged to include the CSBF Program in their business plan).
Knowledge of specific CSBF Program parameters
To determine the level of knowledge about the CSBF Program, respondents who claimed to be aware of the CSBF Program by name were asked what they knew about it72. Among CSBFP borrower firms, about 40% of the respondents who claimed to be aware of the program by name were unable to provide substantive feedback about it.
Among non-CSBFP borrowing SMEs, 58% said that they knew nothing about the program. Even though these numbers still reflect a lack of information about the program, they present an improvement over the 2001 numbers.
CSBF Program Presented by Loan Officer
Managers of SMEs who were refused financing were asked if the loan officer had brought to their attention any loan guarantee programs offered by the federal government to small businesses73.
Among CSBFP borrowers, 76% responded that the program was not presented to them as an option, while 10% of them responded that the program was indeed presented to them.
Among non-CSBFP borrowing SMEs, 96% stated that they were not informed about such a federal program.
70 COMPAS Inc. (2001). Canada Small Business Financing Act Awareness Study. (Return to Reference 70)
71 Phoenix Strategic Perspectives Inc. (2007). Canada Small Business Financing Program (CSBFP) Awareness and Satisfaction Study. p. 29. (Return to Reference 71)
72 Phoenix Strategic Perspectives Inc. (2007). Canada Small Business Financing Program (CSBFP) Awareness and Satisfaction Study. p. 32. (Return to Reference 72)
73 Ibid. p. 28. (Return to Reference 73)
7.0 Other Observations
Four additional questions were included in both lender and borrower representative interviews to provide additional feedback to Industry Canada.
These questions were related to the loan granting process, potential changes in the delivery of the program to deal with the current economic slowdown, as well as questions soliciting stakeholder's feedback on the changes recently made to the program and, potential future changes.
The following list is a summary of the data collected through these interviews.
Highlights of Lender Interviews
Lenders requiring Proof of Loan Turndown
Lenders were asked if they required borrowers to demonstrate that they have been turned down for a non-guaranteed loan. This is common practice in the US, where participants in the SBLA program are required to provide proof that they have been turned down for a non guaranteed loan (the "credit elsewhere" condition).
The majority of lenders (90%) responded No to this question and the remaining 10% responded 'N/A'. No 'Yes' responses were presented.
Some lenders qualified their answer and provided additional feedback:
- Lenders don't need to ask for this information, as they always do a credit check. When performing that credit check, lenders would be able to see if another financial institution has accessed the individual's credit file.
- In some financial institutions, the majority of their lenders are already clients of the bank, and therefore this type of information would be readily available.
- One lender responded that information such as the borrower being turned down by another financial institution would be part of the initial conversation between lending officer and borrower.
- Some lenders mentioned that knowing that the borrower had been turned down for a loan somewhere else, would make them think harder about giving them a loan (borrower may become problematic to lender).
- Most lenders would prefer to provide the client one of their own in-house products. The loan officer would therefore analyze the file based on their particular standard application and borrower's experiences with other lenders would be disregarded.
- If a borrower has been rejected for a non guaranteed loan, it will also be rejected for the CSBF Program, as lenders don't grant loans based only on the guarantee.
Changes in Lender Behaviour or, Borrower Behaviour due to the Economic Slowdown
Lenders were asked whether their financial institution had changed its approach towards CSBF Program and if they had noticed changes in the numbers of CSBFP borrowers, the types of loans granted as well as the amounts financed since the economic downturn started.
The majority of lenders (90%) responded No to this question, 3% responded Yes and the remaining 7% was not able to respond.
Responses from lenders varied significantly depending on the region where the lender was located. Lenders located in specific areas in Manitoba, Alberta and the Maritimes mentioned that the economic slowdown has not been felt in their communities, while some lenders located in northern Québec and southern Ontario mention that their region has been hit very hard by the economic downturn.
Changes in Lender Behaviour
The majority of lenders responded that the official loan guidelines have not changed since the economic slowdown started. However, lending officers are more alert and stricter when it comes to their due diligence.
Listed below is a summary of the feedback obtained:
- One lender mentioned that the financial institution hasn't changed the way it lends, but lending officers are more diligent. They now wait for confirmation of assets and collateral, something that they didn't do before when they had a good potential client in front of them.
- Another lender mentioned that more attention is paid for specific elements of their "due diligence" such as the assessment of management, the business plan and that the existence of a relationship with the Bank.
- Another lender mentioned that the lending rules at his financial institution haven't changed, but that new interest rate directives were implemented. However, these new interest rate directives apply to all types of firms, not just SMEs.
- Some lenders mention that their institution has decided not to get involved in specific industrial sectors that have been hit hardest by the economic downturn, such as the lumber industry. Following this decision, no loans will be granted to firms in those sectors.
Changes in Borrower Behaviour
Lenders in areas that have been hit the hardest by the economic slowdown, such as the regions that are highly dependent on the car manufacturing industry have noticed a change in borrower behaviour.
- For instance, in an area where a large cluster of car parts manufacturers have closed down, the time period between November 2008 and February 2009, was very slow and there as almost no lending. Since then, the level of activity has picked up and business has been very busy.
Another lender who is not located in the hardest hit areas mentioned that the demand for loans started to slow down around June, 2008 and almost completely dried up in September, 2008, especially coming from startups. After September 2008, things have slowly picked up and there haven't been many changes in last few months.
Lenders located in areas that have not been hit as hard by the economic turndown have very different perspectives as to how borrowers have been behaving throughout this economic downturn. Some have noticed a change, and some haven't. Lenders' responses are very dependent on how the region has been affected (if at all).
- Some lenders mention that they haven't seen any changes in borrower's behaviour yet. They anticipate changes in 2010.
- Some lenders have seen an increase in the number of requests and the number of borrowers. A large share of these people is people wanting to start their own businesses.
- Another lender mentioned that in his region there was a lower level of credit applications
- A representative of a large financial institution mentions that since the downturn, there has been an increase in loans on default.
Views on Possible Program Modifications
Lenders were presented with seven different program modifications. They were then asked to estimate the impact that some of these modifications would have on them as well as in the program.
| Possible Modification | Agreement/ Disagreement | Potential Impact |
|---|---|---|
| Increasing/decreasing $5 million annual sales ceiling for business eligibility | Yes: 47% No: 43% N/A: 10% | Most lenders would support an increase in the sales ceiling although a significant number of borrowers would also disagree with these changes. Lenders who support this change argue that increasing the ceiling will allow the program to keep up with inflation, would allow targeting more established businesses and spread the risk of the entire loan portfolio. According to them, such a measure would increase the number of loans made. Lenders who disagree with the measure argue that taking the ceiling beyond $5 million would dilute the SME target population. Some lenders believe that increasing the ceiling will increase the number of loans up to a certain extent. However, some of the firms that have more than $5 million in revenues may be eligible for a non guaranteed loan and won't need the program. No lender suggested bringing it down, because that would have a negative impact on the number of loans. |
| Changing eligible expenditure asset classes | Yes: 67% No: 23% N/A: 10% | Most lenders would see a change in eligible expenditure asset classes as positive, as it would allow them to reclaim customers who are currently being sent to BDC. Including the following assets in the CSBFP portfolio would better meet customer's needs:
|
| Allowing application/ renewal fees | Yes: 87% No: 7% Somewhat: 3% N/A: 3% | This is a very important issue for lenders. Profitability is a key factor in deciding whether to offer the program or not. At this point, the general perception from lenders is that it is not profitable to offer the CSBF Program. Allowing lenders to charge application and renewal fees would certainly make the product more profitable for them and will increase their willingness to offer it to their clients. The following is a summary of the key points brought forward by lenders during the interviews:
Lenders who don't agree with additional fees argue that adding more fees would make getting a CSBFP loan very expensive (fees would be very high). This would actually drive away the same people they are trying to help. |
| Changing annual administration fee process | Yes: 37% No: 40% Somewhat: 7% N/A: 17% | Lenders are almost split on whether this is a good modification or not. The majority seem to support status quo. However, an almost equivalent number of lenders would welcome at least some changes to the process. Possible changes to the program could be:
On the other hand, some lenders have no problem with the current process and don't see any need for a change. |
| Increasing/ decreasing 2% registration fee | Yes: 40% No: 47% N/A: 13% | There is no consensus on this topic, and the majority leans against any changes. Lenders, for instance, when they think about their own profitability, would advocate for an increase in the fee. At the same time, a fine line needs to be drawn, as if the fee is increased too high, the number of borrowers using the loan may decrease. Arguments presented by lenders who support an increase on fees:
Lenders who don't agree with this measure express their concern about the impact this would have on borrowers:
|
| Changing maximum allowable interest | Yes: 80% No: 17% N/A: 3% | The majority of lenders would support an increase in the interest rate they are allowed to charge, or, better yet, have the interest rate on the loan be set based on the risk level of the loan. As in the case of the modifications mentioned above, there is also opposition to removing the ceiling on interest rates, although this is the minority. Lenders who advocate for an increase in the interest rate charged mention:
|
| Decreasing loss sharing ratio | Yes: 13% No: 67% Somewhat: 7% N/A: 13% | The large majority of lenders would want this ration to remain untouched, although they would be open to an increase of the ratio.
|
| Other modifications | Include not for profit sector | Including them in the program will generate a higher volume of loans. |
Views on Program Modifications enacted in 2009 Budget
Lenders were asked about their perspective on the desirability and potential impacts of the program modifications that were enacted in the 2009 budget and effective on April 1st 2009.
| Budget 2009 Modifications | Agreement/ Disagreement | Potential Impact |
|---|---|---|
| Increasing the maximum loan size to $350,000 for equipment and leasehold improvements and $500,000 for real property. | Yes: 94% Somewhat: 3% N/A: 3% | Most lenders see this as a very positive and timely change.
Most lenders are very satisfied with the changes, although some will not offer clients with the full increase in the amounts.
Another lender is positive about the changes but warns about an increase in the number of claims.
|
| Increasing Lender's claim reimbursement on losses to 12% of the value of their portfolio, up from 10% (for those institutions with a loan portfolio above $500,000). | Yes: 37% No: 16% Indifferent: 42% N/A: 5% | Some lenders who are aware of the implications see it as a positive step. However, this measure will not have an impact on the loan officer, which explains the high number of lenders who were "indifferent". |
Highlights of Borrower Representatives' Interviews
Borrower representatives were asked very similar questions to those presented to lenders. The following responses reflect their perspective.
Lenders requiring Proof of Loan Turndown
Borrower representatives were asked about whether lenders required borrowers to demonstrate that they have been turned down for a non-guaranteed loan. Only one out of the three borrower representatives was able to provide an answer to this question. According to this borrower representative, borrowers are not required to demonstrate that they were turned down.
Changes in loan Amounts or, Borrower Behaviour due to the Economic Slowdown
Borrower representatives were asked if borrowers had changed the reasons why they use the program, and if the amounts required/borrowed have changed due to the economic slowdown. One borrower representative answered that no changes have occurred while a second borrower representative responded not being aware of major changes.
Views on Possible Program Modifications
Borrower representatives were asked their opinion about the impact that some possible program modifications would have on them. The seven program modifications below were presented to them.
| Possible Modification | Agreement/ Disagreement | Potential Impact |
|---|---|---|
| Increasing/ decreasing $5 million annual sales ceiling for business eligibility | Yes:33% No: 66% | The majority of borrower representatives did not support a change in the ceiling. According to them, the ceiling is reasonable and should not be increased or decreased. It should be kept as is so that the CSBF Program does not get diluted with larger firms but still allows those of a moderate size to be eligible for a loan. |
| Changing eligible expenditure asset classes | Yes: 66% No: 33% | Most believe that the list of CSBFP eligible assets should be expanded. Items to include:
Another suggestion was for the CSBF Program to move away from bricks and mortar. Some SMEs don't actually have a location as they are home based businesses (such as personal training at home). On the other hand, one borrower representative insisted that the list of eligible assets not be modified. According to them, there are no problems with keeping eligible expenditures as they currently are. |
| Allowing application/ renewal fees | No: 100% | There was consensus in the area of fees. According to them, CSBFP loans are already a higher cost loan. Adding further costs to the borrower is not would not be recommended. |
| Changing annual administration fee process | Yes:33% N/A: 66% | Process should be made less complicated. The administrative burden should be reduced. |
| Increasing/ decreasing 2% registration fee | Yes:33% No: 33% N/A: 33% | One responded that the registration fee should be reduced. It is too high. Another argued that, when taking into account the benefits of SMEs to the economy compared to the amount lent to the project, the registration fee should be waved. |
| Changing maximum allowable interest | Yes: 33% N/A: 66% | One responded that the interest rate should be reduced. The others did not really understand how the maximum allowable interest process works, and would require additional information before being able to respond. |
| Decreasing loss sharing ratio | N/A: 100% | None of the borrower representatives knows how this would impact borrowers. |
| Budget 2009 Modifications | Agreement/ Disagreement | Potential Impact |
|---|---|---|
| Increasing the maximum loan size to $350,000 for equipment and leasehold improvements and $500,000 for real property. | Yes:66% No: 33% | Two borrower representatives agreed with the change. To them, it was a welcomed measure, although they would have liked it to go higher. This change will make financing easier for SMEs, especially franchises that need larger loans. The increase in leasehold improvements was timely, as in fact, when taking into account inflation, they are similar to the 1995 amounts. On the other hand, one borrower representative did not agree as they don't see the increase relevant to most SMEs. They see it as a way to expand the program to larger companies, and move away from their target audience, SMEs. This borrower representative would be interested in seeing if future results validate whether these loans are still going to smaller companies or to larger firms. |
| Increasing Lender's claim reimbursement on losses to 12% of the value of their portfolio, up from 10% (for those institutions with a loan portfolio above $500,000). | N/A: 100% | Not aware how this will affect borrowers. |
8.0 Recommendations
As a result of the findings of this evaluation, there are opportunities for improvement in areas of Program Design, Delivery and Measuring Success.
Program Design and Delivery
Since the current program parameters were put in place in 1999, the number of loans under the program has fallen by 49%, and the total value of loans within the program portfolio has also decreased. Both lenders and program staff perceive that the largest risk to the program is that it is increasingly perceived to be an unattractive vehicle by the lenders due to program design features.
Recommendations:
- 1. Given that both borrowers' representatives and lenders during the interviews supported expanding the asset classes; consider the possibility of broadening the range of assets against which a CSBFP loan can be made, thereby increasing the attractiveness of the program to both lenders and borrowers.
- 2. Measures should be put in place that would make the program more appealing for the lenders to offer. These measures could include: providing increased flexibility regarding administration fees and interest rates; lowering the administrative burden for lenders, by assessing the feasibility of establishing an automated system for registration and claims in order streamline those processes; and considering whether a risk-based approach might be applicable to ensure the accuracy of claims. These measures should be balanced and should consider the impact on the borrower.
- 3. Increase communication with lenders and undertake more pro-active marketing of the program to the lending community. During the interviews, lenders placed particular emphasis on obtaining information about the program itself but more importantly about the types of expenses that are eligible for a claim. Providing lenders with an understanding of eligible claims would reduce their frustration with the claims process and may increase utilization of the program.
Measuring Success
The CSBF Program has two objectives – incrementality and cost-recovery. These objectives have an inverse impact on each other. The higher the incrementality of the program, the riskier the portfolio becomes, which leads to a higher incidence of claims. This decreases the ability of the program to achieve a high percentage of cost recovery. Given these, the Program is meeting these objectives as well as could be expected, and significant economic benefits are being generated to the Canadian economy.
The program is relevant; an incrementality rate of between 75–85% indicates that the Program is providing loan guarantees to SMEs who would be unlikely to receive a conventional loan. The program appears to be successful as the CSBFP borrowers have been able to achieve a higher level of economic performance than a comparator group of non-CSBFP borrowers with similar characteristics. Because the program has a relatively high level of incrementality, it also faces high levels of risk.
Since its inception, the CSBF Program has not been cost recoverable. The cost recovery rate has been forecasted at 67.7% for the first cohort (1999–2004) and 58.9% for the second cohort (2004–2009).
Between the high level of incrementality that the program has attained and the fact that the loan portfolio is riskier since 2004, it is anticipated that the gap between claims and fee revenues will continue to exist and most likely expand.
Recommendations:
- 4. Review the program's cost recovery objective, given that the program has not been fully cost recoverable. In reviewing this target consideration must be given to the balance between potential burden on borrowers, profitability for lenders and government accountability.
- 5. When communicating the results of the CSBF Program in the Annual Reports, care should be taken in presenting the job creation numbers estimated by borrowers at the time of the loan application, given the discrepancies between those and actual realizations.
Bibliography
- BearingPoint. (2004). Evaluation of the Canada Small Business Financing Program, Final Report.
- Cambridge. (1996). The Changing State of British Enterprise. Center for Business Research, Cambridge, England.
- Canada Works Limited. (2009). Canada Small Business Financing Program: Updated Analysis of Incrementality. June 2009.
- Canadian Federation of Independent Business. (2007). Banking Matters, November 2007.
- COMPAS Inc (2001). Canada Small Business Financing Act Awareness Study. April 2001.
- Equinox Management Consultants Ltd. (2002). Gaps in SME Financing: An Analytical Framework.
- Equinox Management Consultants Ltd. (2006). Working Capital Financing and the Canada Small Business Financing (CSBF) Program.
- Equinox Management Consultants Ltd. (2008). Sources of Portfolio Risk and Revenue Generation of the Canada Small Business Financing Program, phase 1.
- Equinox Management Consultants Ltd. (2008). Sources of Portfolio Risk and Revenue Generation of the Canada Small Business Financing Program, phase 2.
- Green, A. (2002). Credit Guarantee Schemes for Small Business: Theory and Practice.
- Industry Canada. (2008). Canada Small Business Financing Act Annual Report 2007–2008.
- Industry Canada. (2009). Borrowers under the Canada Small Business Financing Program.
- Industry Canada. (2009). Observational Evidence of the Rationale and Effectiveness of the CSBFP in Meeting Small Businesses' Access to Financing Needs.
- KPMG Management Consulting (UK). (1999). An Evaluation of the Small Firms Loan Guarantee Scheme, March 1999.
- OECD. (2006). The SME Financing Gap: Theory and Evidence.
- Phoenix Strategic Perspectives Inc. (2007). Canada Small Business Financing Program (CSBFP), Awarenesss and Satisfaction Study.
- Statistics Canada. (2004). Longitudinal Economic Impact Study of the Canada Small Business Financing (CSBF) Program.
- Statistics Canada. (2006). Survey on Financing of Small and Medium Enterprises, 2004.
- Statistics Canada. (2008), Economic Impact Study of the Canadian Small Business Financing (CSBF) and Consulting Services.
- Statistics Canada. (2009). Survey on Financing of Small and Medium Enterprises, 2007.
- US Small Business Administration. (2008). Competitive and Special Competitive Opportunity Gap Analysis of the 7(a) and 504 Programs—Final Report. January 2008.
| Recommendation | Management response and planned action | Management accountability | Action completion date |
|---|---|---|---|
Recommendation 1: Given that both borrowers' representatives and lenders during the interviews supported expanding the asset classes; consider the possibility of broadening the range of assets against which a CSBFP loan can be made, thereby increasing the attractiveness of the program to both lenders and borrowers. | Consideration will be given to a range of possible improvements to the CSBFP in the context of the comprehensive review which examines the provisions and operation of the CSBF Act during the five years starting April 1, 2004. | Director General—Small Business and Tourism Branch | Targeted implementation: January 2011 |
Recommendation 2: Measures should be put in place that would make the program more appealing for the lenders to offer. These measures could include: providing increased flexibility regarding administration fees and interest rates; lowering the administrative burden for lenders, by assessing the feasibility of establishing an automated system for registration and claims in order streamline those processes; and considering whether a risk-based approach might be applicable to ensure the accuracy of claims. These measures should be balanced and should consider the impact on the borrower. | Possible measures in this area will also be considered in the comprehensive review. CSBFP officials are currently engaged in discussions with participating financial institutions in order to actively pursue the application of electronic data & fund transfer processes to the administration of the Program. This would include providing financial institutions with the ability to conduct on-line registrations and payments through a secure web-based facility. | Director General—Small Business and Tourism Branch | Targeted implementation: January 2011 for changes to Program parameters Fall 2010 for improvements to electronic data and fund transfer processes |
Recommendation 3: Increase communication with lenders and undertake more pro-active marketing of the program to the lending community. During the interviews, lenders placed particular emphasis on obtaining information about the program itself but more importantly about the types of expenses that are eligible for a claim. Providing lenders with an understanding of eligible claims would reduce their frustration with the claims process and may increase utilization of the program. | Since the 2004 Evaluation a more proactive approach to communications with financial institutions has been implemented through regular meetings to address concerns, improved processes and regular discussions of portfolio trends and analysis. Communication efforts have also been strengthened through an increase in the quality and quantity of standardized information sent quarterly, reactivation of the quarterly Bulletin and increased discussion with lenders prior to final claims decisions being made. In addition, an interactive guide to using the CSBFP was developed and is available through the Program's website. Major lenders have stipulated that all communications regarding the Program be directed to head offices, which will then disseminate information to their branches. As such, the Program is reliant on the large financial institutions to effectively circulate information on the CSBF Program to front line loan officers. Turnover of front line staff can also create challenges in maintaining a high level of knowledge of the Program. In recent months, a new program pamphlet was published and sent to both non-active and active financial institutions. Quarterly Bulletins are now also being distributed through a web-based subscription list of self-identified lenders. CSBF officials have also recently implemented a strategy to proactively increase awareness of the program among SMEs through their intermediaries. Increasing awareness among SMEs will enable them to engage front line lending staff about the possibility of using the Program. This strategy has included various outreach activities with Associations, the Canadian Federation of Independent Business, business support organizations including the Canada Business Service Network and their regional partners, Community Futures Development Corporations, the Réseau des SADC du Québec, Chambers of Commerce and Boards of Trade, Small Business Enterprise Centres, and public libraries. Outreach activities include participation in trade shows, distribution of our pamphlets at events attended by other federal government departments, a pamphlet mail-out blitz and distribution of our newly designed web icon to facilitate external linking to our site. The program website has also been modified to enhance search engine optimization and more intuitive access to the web site's most viewed pages. | Director General—Small Business and Tourism Branch | Ongoing |
Recommendation 4: Review the program's cost recovery objective, given that the program has not been fully cost recoverable. In reviewing this target consideration must be given to the balance between potential burden on borrowers, profitability for lenders and government accountability. | Since its inception, the CSBF Program has not been fully cost recoverable. The Program has consistently aimed to achieve a reasonable balance between the Program's objectives of cost recovery and incrementality. As costs are directly proportional to the risk inherent in the CSBF portfolio of loans, recent increases in program incrementality and overall portfolio risk combined with a downturn in the economy has lead to lower levels of cost recovery. However, KPMG's analysis of the Program's costs and benefits found that while the Program is not cost-recoverable when administration and registration fees are the only revenues used in the calculation, it can be considered cost-recoverable over the study period when federal income taxes for additional salaries and wages paid by borrowers and GST remittances are considered. Officials will continue to monitor the balance between the Program's objectives to ensure that they do not place undue burden on any one stakeholder group. | Director General—Small Business and Tourism Branch | Targeted implementation January 2011 |
Recommendation 5: When communicating the results of the CSBF Program in the Annual Reports, care should be taken in presenting the job creation numbers estimated by borrowers at the time of the loan application, given the discrepancies between those and actual realizations. | Prior to this evaluation, the only information collected on job creation was provided by borrowers at the time the loan was disbursed. As the accuracy of these numbers has been questioned previously, CSBF staff have been careful to stipulate that employment numbers were estimates provided by the borrowers themselves. Moving forward, CSBF staff will adjust the methods used for reporting job creation statistics to align with those methods highlighted in the Evaluation Report. These statistics will be used in the preparation of the 2009–2010 CSBFP Annual Report. | Director General—Small Business and Tourism Branch | November 2010 |
Figure 1—Number of Loans/Average Size of Loans (1999-2008)
This chart depicts the number of loans issued under the CSBFP as well as the size of loans issued under the CSBFP throughout the period of 1999-2008. It is seen that the trends are contradictory: While the average size of loans is increasing, the number of loans is decreasing.
Figure 2—Total Value of Loans/Number of Loans (1999-2008)
This chart shows the evolution of the total value of loans compared to the number of loans between fiscal years 1999-2000 and 2007-2008. The chart shows that both have followed a similar trend over the years in question, falling slightly over the first three years and then staying fairly consistent in the following years.
Figure 3—Number of Claims (1999-2008)
This is a graphical depiction of table 4, which shows an upwards trend in claims paid over the years 1999 to 2008.
Figure 4—Claims Paid ($000) (1999-2008)
This is a graphical depiction of table 5, which shows an upwards trend in the total value of claims paid over the years of 1999 to 2008.
Figure 5—Number of Loans by Industry (% of total) (1999-2008)
This figure is a pie chart which presents the share of loans granted for the top seven industrial sectors. Food and Beverage Services leads the way at 18.0%, followed by retail trade at 15.1%, Transportation and Warehousing at 12.9%, Manufacturing at 8.0%, Construction at 5.7%, and Agriculture at 5.3%. Other services account for 18.6%.
Figure 6—Value of Loans by Industry (% of total) (1999-2008)
This figure is a pie chart which presents the percentage value of the top seven each industrial sectors within the total value of loans in CSBFP portfolio. Food and Beverage Services leads the way at 24.9%, followed by retail trade at 14.7%, Transportation and Warehousing at 9.4%, Manufacturing at 8.3%, Agriculture at 4.8%, and Construction at 4%. Other services account for 17.2%.
Figure 7—Average Loan Value by Industry ($000) (1999-2008)
This chart presents the average loan value by Industry. The average loan value between 1999 and 2008 in the food and beverage services industry was $124,300. The average for other services was $83,300, retail trade was $87,700, transportation and warehousing was $65,900, manufacturing was $93,800, agriculture was $81,000, and construction was $63,900.
Figure 8—Number of Loans by Firm Size (1999-2008)
This chart shows the number of loans broken down by the annual revenues of firms between 1999 and 2008. Firms with annual revenues between $0 to $100,000 received 12,369 loans, firms with annual revenues between $100,001 and $250,000 received 26,678 loans, firms with annual revenues between $250,001 and $500,000 received 26,443 loans, firms with annual revenues between $500,001 and $1,000,000 received 22,021 loans, firms with annual revenues between $1,000,001 and $2,500,000 received 14,587 loans. Finally, firms with annual revenues between $2,500,001 and $5,000,000 received 3,993 loans.
Figure 9—Value of Loans by Firm Size ($000) (1999-2008)
This chart presents the value of loans by borrower firm size. Firms with annual revenue between $0 to $100,000 received total loans of $611,433, firms with annual revenue between $100,001 to $250,000 received total loans of $1,814,333, firms with annual revenue between $250,001 to $500,000 received total loans of $2,395,417, firms with annual revenue between $500,001 to $1,000,000 received total loans of $2,426,174, firms with annual revenue between $1,000,001 to $2,500,000 received total loans of $1,755,890. Finally, firms with annual revenues between $2,500,001 to $5,000,000 received total loans of $518,924.
Figure 10—Percentage of Number of Loans by Age of Firm (1999-2008)
This is a pie chart that presents the distribution of the number of loans based on the age of the firm. Firms less than one year old received 51.45% of loans, firms one to three years old received 34.33% of loans, and firms more than three years old received 14.21% of loans.
Figure 11—Value of Loans by Age of Firm ($000) (1999-2008)
This is a bar chart that presents the value of loans based on the age of the SME. Firms that were less than a year old received a total of $5,539,907.40 in loans. Firms that were one to three years old received $1,124,449.50 in loans. Finally, firms that were more than three years old received $2,857,813.90 in loans.
Figure 12—Percentage of Number of Loans by Asset Type (1999-2008)
This pie chart presents the split of the number of loans based on asset type. Of all the loans given under the CSBFP, 64.82% were for equipment, 17.65% were for real property, and 17.53% were for leasehold improvements.
Figure 13—Percent of Total Value of Loans by Region (1999-2008)
This pie chart presents the percentage of the total value of loans that have gone to each region. Quebec accounts for 33.1%, Ontario accounts for 32.9%, 11.2% went to Alberta, 8.3% went to Atlantic Canada, 7.6% to British Columbia, 6.7% to the Prairies, and 0.2% to Northern Canada.
Figure 14—Impact of each of the risks
This figure illustrates the relative significance of each of the risks presented, as well as the perceived likelihood and impact of each of these risks. Each point on the graph represents a risk. As the perceived likelihood of the risk increases, the point representing that risk moves to the right on the graph. As the relative significance of the risk increases, the point representing that risk rises on the graph.
The four risks that are in the top right quadrant of the graph, and therefore perceived to be the most significant, are risk #3, risk #24, risk #23, and risk #20.
Figure 15—Number of CSBF Loans (1999-2008)
This bar chart shows the number of CSBF loans in each year from 1999 to 2008. It is seen that the number of CSBFP loans has continuously decreased over time.
Figure 16—Bank of Canada Average Business Prime Rate (1999-2008)
This graph shows the Bank of Canada Average Business Prime Rate from 1999-2008. The graph shows that it was 6.44% in 1999-2000, 7.35% in 2000-2001, 4.98% in 2001-2002, 4.42% in 2002-2003, 4.58% in 2003-2004, 4.02% in 2004-2005, 4.69% in 2005-2006, 5.90% in 2006-2007, and 6.00% in 2007-2008.
Figure 17—Number of CSBF Loans Average and Business Prime Rate (1999-2008)
This graph combines the last two graphs. It shows that the Average Business Prime Rate and the Average Number of CSBF Loans follows roughly the same trend.