
Final Report
Audit and Evaluation Branch
Industry Canada
March, 2008
Table of Contents
- Executive summary
- 1.0 Introduction
- 2.0 Methodology
- 3.0 Findings
- 4.0 Conclusion
- Management Response or
PDF version (10 KB, 2 pages)
Annexes (Separate document)
(Note: Annexes are available via an Access to Information)
- Appendix A: Steering Committee Members
- Appendix B: Map of Geographic Area Served by EODP
- Appendix C: Service Areas and Socio-Economic Profiles by CFDC
- Appendix D: Evaluation Matrix
- Appendix E: Data Collection Instruments
- Appendix F: Literature Consulted
- Appendix G: List of Key Informants
- Appendix H: Case Study Summaries
- Appendix I: Program Applications Received vs. Approved
- Appendix J: Best Practices in Project Selection
- Appendix K: EODP Indicators
- Appendix L: Other Comparable Programs
Tabled and approved at DEC on
This publication is available upon request in accessible formats.
Contact:
Multimedia Services Section
Communications and Marketing Branch
Room 264D, West Tower
235 Queen Street
Ottawa, Ontario K1A 0H5
Telephone: 613-948-1554
Fax: 613-947-7155
Email: ic.cmb-creative.ic@canada.ca
Permission to Reproduce
Except as otherwise specifically noted, the information in this publication may be reproduced, in part or in whole and by any means, without charge or further permission from Industry Canada, provided that due diligence is exercised in ensuring the accuracy of the information reproduced; that Industry Canada is identified as the source institution; and that the reproduction is not represented as an official version of the information reproduced, nor as having been made in affiliation with, or with the endorsement of, Industry Canada.
For permission to reproduce the information in this publication for commercial redistribution, please email: copyright.droitdauteur@pwgsc.gc.ca
Cat. No.Iu4-135/2008E-PDF
ISBN 978-1-100-10133-0
60483
Aussi offert en français sous le titre de l'évaluation finale du programme de développement de l'Est de l'Ontario.
Executive Summary
Introduction
This report presents the findings of the final evaluation of the Eastern Ontario Development Program (EODP). The evaluation was undertaken by Goss Gilroy Inc. (GGI) Management Consultants over the period of June to October, 2007.
The objectives of the evaluation were to respond to the requirements for an evaluation of the program as outlined in the program's Results-Based Management and Accountability Framework (October 2006). Results will also be considered for the renewal of EODP terms and conditions, scheduled to expire March 31, 2008.
Profile of EODP
The Eastern Ontario Development Fund (EODF) was established in 2004 as a pilot project to promote regional economic development in rural Eastern Ontario (excluding only Ottawa and Kingston). In August 2006, the Program was renewed under a new name, the Eastern Ontario Development Program (EODP). The objective of the EODP is to promote socio-economic development in rural Eastern Ontario leading to a competitive and diversified regional economy and contributing to the successful development of business and job opportunities and sustainable self-reliant communities.
The EODP is administered by FedNor, a federal regional development organization within Industry Canada and delivered through 15 Community Futures Development Corporations (CFDCs) serving Eastern Ontario.
FedNor provides contributions to the CFDCs who may either use EODP funds to carry out community and regional economic development activities solely or in partnership with others, or enter into contribution agreements with third parties ("secondary recipients"). Secondary recipients can include, among others, the private sector, non-profit organizations, municipalities, educational institutions, labour organizations, and First Nations organizations. Four main project types are funded:
- Business and skills development, including business planning, skills development and youth retention and attraction projects;
- Community development, including local initiatives and community capacity building projects;
- Access to capital projects; and,
- Regional development projects.
Over the initial 17 months of the program (EODF funding rounds 1 and 2), from October 25, 2004 to March 31, 2006, the program provided total funding of $18.2 million ($17.55 million grants and contributions). In July 2006, as the renamed EODP, the program was allocated $10 million ($9.6 million G&C) for 2006-2007 (round 3) and has been renewed for 2007-2008 with an additional $10 million ($9.4 million G&C) (round 4). Thus, including the current fiscal year, the EODP program (including EODF funding) has been allocated $38.2 million to date.
Methodology
The evaluation was guided by evaluation issues and questions outlined in the RMAF (2006). These issues and questions were further enhanced with additional items deemed required and relevant at the design phase of the evaluation. In order to ensure a high level of rigour in the evaluation, the following lines of evidence were employed:
- Document review;
- Literature review;
- Database review and analysis;
- Key informant interviews with FedNor officials, CFDC representatives, and stakeholders;
- Telephone interviews with significant secondary recipients;
- Online survey of project recipients;
- Community case studies; and,
- A survey of unsuccessful applicants.
Conclusions and Recommendations
Relevance
The evaluation found that needs vary to some extent across communities, however the top five most significant and pervasive needs of communities in Eastern Ontario were related to a loss of manufacturing jobs (once a large source of employment); out migration by youth; a lack of employment opportunities in general; ageing/inadequate physical infrastructure (such as roads, bridges and sewers), and support for tourism efforts. The evaluation concluded that EODP is a relevant program to address these (and other) needs (with the exception of ageing/inadequate infrastructure) and there is at least one (and often several) EODP funding streams that can be accessed to address the above-mentioned need in question1.
Design and Delivery
The evaluation concluded that the strength of the EODP is the use of the CFDC as its delivery agent. Because of their intimate knowledge of the local situation, CFDCs have used EODP funding to encourage new community initiatives, conduct strategic/planning studies, mobilize broader community stakeholders/players, and help form partnerships. Many CFDCs undertake the role of economic capacity developers in catchment areas where no one is playing that role.
There are opportunities for improvement, however. The short term (i.e. annual) nature of funding discourages strategic and long term projects that could be more effective in addressing community challenges. Also, the impact of the program may be reduced by distributing a relatively small amount of funding across many objectives. In addition, the evaluators concluded that allocating equal funding across CFDCs fails to acknowledge that some communities have a greater capacity to absorb funding and/or have more pressing economic challenges than others.
Recommendation #1 — Consideration should be given to revisiting the EODP funding formula for allocations to CFDCs, so that capacity and socio-economic variables play a role in the allocation of funding. Also, CFDCs should have increased flexibility for allocating funding to secondary recipients among the program components according to the local strategic priorities.
The evaluation concluded that in general, FedNor is playing an appropriate role in managing the EODP. There are additional opportunities for FedNor to bring its economic development knowledge to CFDCs and in the designing and scoping of community capacity building and regional projects. Also, FedNor should assess the need for additional tools, templates and training for CFDCs.
Although the approach to project selection can vary across CFDCs, the evaluation found that the selection processes used by CFDCs are effective and appropriate. However, the selection of regional projects has been and continues to be problematic.
Recommendation #2 — FedNor should continue to work with the CFDCs to improve the process for identification, design and approval of regional and sub-regional projects and should play a more proactive role in this process.
Success
Determining the extent to which EODP has achieved the immediate outcomes set out in the logic model for the last funding round (2006-2007) is difficult due to challenges related to the performance measurement strategy (see below for findings related to performance measurement). Nevertheless, the evaluation concluded that EODP projects have positively impacted businesses, organizations, and communities. For example, EODP projects have impacted revenue generating organizations in a number of ways, including:
- The expansion or creation of 43 businesses in 2006/07 alone;
- Increased sales revenues for 117 firms;
- Increased export revenues for 14 firms; and,
- Increased profits for 94 firms;
The evaluation found that EODP has had a number of important impacts on employment in Eastern Ontario. For example, EODP has contributed to:
- The retention of 502 employees;
- The hiring of 209 additional employees; and,
- Permanent positions for 185 youth interns at organizations in the region.
The evaluation found that EODP has helped organizations be more competitive in a number of important areas. For example, projects have enabled many organizations to improve customer service, accommodate more customers, provide a wider range of services, expand marketing activities, and develop new products.
The evaluation also found that communities have been strengthened by supporting the efforts of non-profit organizations, finding employment for young people, and investing in physical and social infrastructure. Many projects have yielded community benefits such as improved health services, increased tourism, better parks and recreation services, and improved community planning. The above examples likely under-represent the extent of the impacts of EODP, as the evaluation's data collection activities cover only a sample of EODP projects.
EODP appears to have a catalytic effect on the behaviour of organizations and communities. Not only do many other funding sources contribute to the projects EODP supports, EODP often appears to be the first to fund projects, and as such, acts as a lever for additional investment.
Because EODP projects are often quite small due to the small amount of program funding, their impacts may not be obvious to the larger community. For example, EODP funding recipients reported a number of positive impacts from their projects, however, they reported little change in their communities' overall competitiveness. Macro-economic statistics for Ontario communities support their observations. The statistics reveal that while all the 15 CFDC catchment areas have experienced improvements in at least some key macro-economic statistics, the same statistics for Ontario (excluding Toronto) show greater improvement.
Performance Measurement
The evaluation found that data are being collected that are consistent with the RMAF developed in October 2006. CFDCs require project funding recipients to submit final reports containing RMAF indicators and these data are then provided to FedNor in aggregate.
Data are being used for program renewal, communications and reporting purposes by both CFDC and FedNor managers. However, it appears that most of the data being collected are not yet being used to manage the program (e.g., assess relative effectiveness of program components, resource allocation decisions).
Overall program performance is difficult to determine due to a lack of quantifiable targets or benchmarks, and appropriate indicators. Specifically, many indicators in the 2006 RMAF logic model are not appropriate because they do not measure the immediate outcomes. The indicators that are appropriate for measuring immediate outcomes, however, have not been quantified in program documentation (i.e. no overall targets established, tracked or reported against). Without firm targets for the program as a whole to compare against, it is difficult for program management to determine the extent to which immediate outcomes have been achieved. Similarly, the indicators for the EODP intermediate outcome identified in the RMAF have not been quantified.
Recommendation #3 — Outcome indicators need to be revised and targets aggregated. Data on these indicators (and progress towards targets) should be collected and tracked by CFDCs and reported to FedNor within established reporting cycles to allow for aggregation. Qualitative data should also be collected and linked to quantitative data. (Qualitative data might include: extent to which an outcome is achieved, perceived quality of outputs, mitigating factors or challenges where outcomes not achieved, extent to which an outcome was exceeded.) It is recommended that qualitative input be coded and fields created so that findings can be aggregated and analyzed. FedNor should continue to further incorporate performance data into the management of EODP.
Alternatives, Cost-Effectiveness and Lessons Learned
The local level decision-making, assistance with project design, and overall flexibility of the program are characteristics that set EODP apart from other programs. While there are other programs at the federal and provincial levels that address regional economic development, EODP is somewhat unique. The large extent of leveraging and frequent involvement of partners in projects are both indicative of collaboration between FedNor, CFDCs and other departments and governments.
The program appears to be cost effective in the sense that most projects reviewed by evaluators created impacts with a relatively small investment. The evaluation found that EODP encouraged organizations to undertake projects that they otherwise would not have. Furthermore, EODP is frequently the first program to fund a project, which then leads to leveraging of funding from other programs.
There is room for program improvement, however. The EODP design does not acknowledge the important role that exporters, firms with strong local supplier links, and firms whose products and services substitute for imports can play in improving economic conditions in communities. Additionally, projects that improve technology and processes are not being specifically targeted (i.e. a specific program component looking at this area no longer exists).
Recommendation #4 — FedNor should encourage CFDCs to target their private sector funding to exporters, firms that substitute for imports, and firms with strong local supplier links. Given the current program objectives, projects that address technology should also be encouraged.
Overall, the evaluation concluded that EODP is an effective program that is contributing to economic and social development in rural Eastern Ontario businesses, organizations and communities. There is a need however, for better alignment between the stated objectives of the EODP and its current funding level and funding cycle (i.e. annual).
Recommendation #5 — Should funding levels and funding cycles (i.e. annual) remain unchanged, FedNor should revisit the objectives of the EODP to more closely align with what is realistically achievable.
Other Issues
The evaluation found that EODP is consistent with Section 41 of the Official Languages Act and is providing services of equal quality in both official languages in the requisite communities.
Where accepted by the management response, generally, the recommendations of the Formative Evaluation of the EODF in 2005 have been implemented or have begun to be implemented.
1 Note that, while EODP does address inadequate physical infrastructure in terms of building and other capital improvements, the program does not fund projects related to roads, sewers, bridges, etc. (Return to Text)
1.0 Introduction
This final draft report presents the findings of the final evaluation of the Eastern Ontario Development Program (EODP). The evaluation was undertaken by Goss Gilroy Inc. (GGI) Management Consultants over the period of June to October, 2007. The evaluation was overseen by a Steering Committee comprised of representatives from Industry Canada, FedNor and selected Community Futures Development Corporations (CFDCs) (see Appendix A for a list of Steering Committee members). The objectives of the evaluation were to respond to the requirements for an evaluation of the program as outlined in the program's Results-Based Management and Accountability Framework (October 2006). Results will also be considered for the renewal of EODP terms and conditions, scheduled to expire March 31, 2008.
The report is organized as follows:
- Section 1 presents a profile of the EODP;
- Section 2 presents the methodology for the evaluation;
- Section 3 presents findings by evaluation issue and question; and
- Section 4 presents the conclusions.
1.1 Profile of the EODP
1.1.1 Context
Rural communities in Eastern Ontario face medium- and long-term economic issues2 arising from a number of socio-economic challenges including:
- Youth migration to urban centres;
- An aging population;
- Low assessment tax base with minimal assessment growth;
- Highest commercial and industrial education tax rates in Ontario;
- Decline in the light manufacturing base;
- Stagnant and declining population growth; and
- Employment rates and household incomes below the provincial average.
Appendix B presents a map that identifies the geographic area served by the EODP. A more detailed examination of the socio-economic profile of the communities served by the EODP is presented in Appendix C.
1.1.2 Objective and Expected Results
The objective of the EODP is to promote socio-economic development in rural Eastern Ontario (excluding only Ottawa and Kingston) leading to a competitive and diversified regional economy and contributing to the successful development of business and job opportunities and sustainable self-reliant communities, by supporting community-based initiatives which: 1) stimulate business and community development opportunities; 2) attract and retain youth; 3) support skills development; 4) provide access to capital for new and existing business; and 5) support technological enhancements.
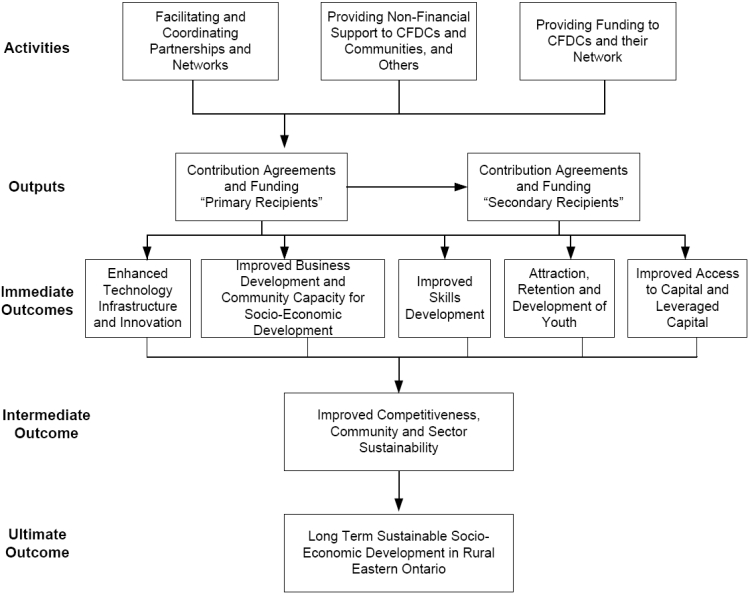
The program's logic model is presented on the following page (Chart 1). It depicts three main activities, and the following outcomes:
- Enhanced technology infrastructure and innovation (immediate outcome);
- Improved business development and community capacity for socio-economic development (immediate outcome);
- Improved skills development (immediate outcome);
- Attraction, retention and development of youth (immediate outcome);
- Improved access to capital and leveraged capital (immediate outcome);
- Improved competitiveness, community and sector sustainability (intermediate outcome); and,
- Long-term sustainable socio-economic development in rural Eastern Ontario (ultimate outcome).
1.1.3 Program Administration and Delivery
The EODP is administered by FedNor, a federal regional development organization. FedNor is Industry Canada's main point of presence in Northern and rural Ontario. In addition to the EODP, FedNor also administers two other core programs: the Community Futures (CF) Program and the Northern Ontario Development Program (NODP). The organization also delivers national initiatives in Ontario such as the Government of Canada Action Plan for Official Languages/ Francophone Tele-Learning Pilot Project Initiative.
The Eastern Ontario Development Fund (EODF) was established in 2004 as a pilot project to promote regional economic development in rural Eastern Ontario. The EODF was delivered through the 15 Community Futures Development Corporations (CFDCs) serving the area. In July 2006, the Program was renewed under a new name, the Eastern Ontario Development Program (EODP). The region served by EODP extends east from Durham Region, south of Algonquin Park and is bounded by the Quebec border (and excludes the cities of Kingston and Ottawa). The EODP continues to be delivered by the 15 CFDCs serving Eastern Ontario.
FedNor provides contributions to the CFDCs of Eastern Ontario and the Eastern Ontario CFDC Network Inc. ("primary recipients"), who may either use EODP funds to carry out community and regional economic development activities solely or in partnership with others, or enter into contribution agreements with third parties ("secondary recipients"). Secondary recipients can include, among others, the private sector, non-profit organizations, municipalities, educational institutions, labour organizations, and First Nations organizations.
In order to achieve the outcomes laid out in the logic model, four types of projects are funded by CFDCs for eight program components (see Exhibit 1.1).
| 3 New Program Components, EODP Framework, August 1, 2006. (Return to Text) | |
| Project Type | Program Component |
|---|---|
| Business and Skills Development | Business Planning |
| Skills Development | |
| Youth Retention and Attraction | |
| Community Development | Local Initiatives |
| Community Capacity Building | |
| Access to Capital | Access to Capital |
| Regional Development | Regional Operating |
| Regional Development Projects | |
Each project type is briefly described below:
- Business and skills development. Business planning supports private sector business development. Skills development supports the development of a labour force in Eastern Ontario that will meet the needs of the business community, encourage new local entrepreneurs, and attract external investment. Youth retention and attraction projects support initiatives (usually in the form of internships) which stem the out-migration of youth from Eastern Ontario and encourage young people to move to Eastern Ontario.
- Community development. Projects funded by local initiatives and community capacity building are focused on enhancing the community's capacity for economic development and diversification, and supporting the growth of existing businesses and the establishment of new businesses by local entrepreneurs, outside investors and potential exporters.
- Access to capital. These projects are intended to improve access to capital funds for new and existing businesses in Eastern Ontario.
- Regional development projects. These projects are intended to have tangible and sustainable economic benefits to Eastern Ontario and have the potential capacity to initiate change in the economic well-being of Eastern Ontario. Regional Project applications must impact a minimum of 4 CFDC catchment areas.
Projects of each of the first three types are funded and administered by each of the 15 CFDCs in their respective catchment areas. Regional projects are funded and administered by CFDC Network Inc.
1.1.4 Budget
Over the initial 17 months of the program (EODF funding rounds 1 and 2), from October 25, 2004 to March 31, 2006, the program provided total funding of $18.2 million ($17.55 million grants and contributions). In July 2006, as the renamed EODP, the program was allocated $10 million ($9.6 million G&C) for 2006-2007 (round 3) and has been renewed for 2007-2008 with an additional $10 million ($9.4 million G&C) (round 4). Thus, including the current fiscal year, the EODP program (including EODF funding) has been allocated $38.2 million to date.
Each year, the CFDCs and the CFDC Network meet with FedNor to allocate the funding for that fiscal year. For Round 3, the distributions were made as outlined in Exhibit 1.2.
| Item | Amount |
|---|---|
| Total budget | $10,000,000 |
| Less FedNor 4% for administration | $400,000 |
| Balance | $9,600,000 |
| Regional projects 10% (incl. admin) | $960,000 |
| Balance for CFDC projects (incl. admin) | $8,640,000 |
| Per CFDC ($8,640,000/15) | $576,000 |
At this meeting, the annual targets by project type and program component are also determined. Please refer to Exhibit 1.3 for Round 3 allocations. CFDCs are permitted to deviate from the targets by up to 50% to ensure the program can be tailored to meet local needs.
| Type/Component | Target Amount | Proportion of CFDC Budget |
|---|---|---|
| Business Development | $226,000 | 40% |
| Skills Development | $115,000 | 20% |
| Youth Attraction/Retention | $86,000 | 15% |
| Business Planning | $25,000 | 5% |
| Community Capacity | $175,000 | 30% |
| Local Initiatives | $60,000 | 10% |
| Community Capacity Building | $115,000 | 20% |
| Access to Capital | $115,000 | 20% |
| Administration | $60,000 | 10% |
| Total | $576,000 | 100% |
1.1.5 Program Funding for Grants and Contributions
Exhibit 1.4 presents a profile of the program funding for the three funding rounds occurring during 2004-2006 (EODF, rounds 1 and 2) and 2006-2007 (EODP, round 3).
| Rounds 1 and 2 (2004-2006) | Round 3 (2006-2007) | |||
|---|---|---|---|---|
| Component | # of agreements | $ value of agreements | # of agreements | $ value of agreements |
| Technology Infrastructure | 16 | $ 130,238 | NA | NA |
| Business Planning | 132 | $ 712,211 | 97 | $ 367,577 |
| Local Initiatives | 441 | $ 2,696,423 | 244 | $ 1,423,920 |
| Community Capacity Building | 95 | $ 3,143,209 | 87 | $ 2,030,597 |
| Youth Retention and Attraction | 233 | $ 2,681,216 | 125 | $ 1,188,882 |
| Regional Projects | 19 | $ 1,302,160 | 7 | $ 950,750 |
| Access to Capital | 132 | $ 3,097,142 | 66 | $ 1,608,411 |
| Skills Development | 473 | $ 3,081,656 | 254 | $ 1,124,056 |
| Total | 1541 | $ 16,844,255 | 880 | $ 8,694,193 |
The number of business planning projects has increased from 132 in the first two rounds (for an average of 66 per round) to 97 in round 3. Additionally, the number of community capacity building projects undertaken has increased from 95 in the first two rounds (for an average of 47.5 per round) to 87 in round 3. It is interesting to note that projects specifically pertaining to technology infrastructure are now collapsed into the other six project components for round 3.
2 Results-based Management and Accountability Framework (RMAF) for EODP, October 2006, Page 2. (Return to Text)
2.0 Methodology
2.1 Evaluation Issues
The final evaluation of the EODP was guided by evaluation issues and questions outlined in the RMAF (2006). These issues and questions were further enhanced with additional items deemed required and relevant at the design phase of the evaluation. Exhibit 2.1 presents the evaluation issues and questions. While not explicitly stated, the questions relevant to the Expenditure Review Committee are addressed. An evaluation matrix, which presents the corresponding indicators and lines of evidence is presented in Appendix D.
| Issues | Questions |
|---|---|
| Relevance | 1. What are the priority needs of the communities eligible for EODP support? |
| 2. To what extent is EODP relevant to these needs? | |
| Program Design and Delivery | 3. Is EODP design and the associated funding, terms and conditions appropriate? |
| 4. Is FedNor playing an appropriate supporting role to the primary recipients, in terms of providing advice, service and support? | |
| 5. Are CFDCs playing an appropriate supporting role to the secondary recipients, in terms of providing advice, service and support? | |
| 6. Is the EODP project selection process effective? Have the criteria been adhered to? | |
| Success | 7. Is EODP effective in meeting its objectives and within budget? |
| 8. Is EODP resulting in any unintended outcomes? | |
| 9. To what degree has EODP contributed to the development and retention of new and existing businesses? | |
| 10. To what degree has EODP improved competitiveness of rural Eastern Ontario businesses and/ or communities (intermediate outcome)? | |
| 11. To what degree has EODP contributed to sustainable socio-economic development in rural Eastern Ontario (ultimate outcome)? | |
| Performance Measurement | 12. Is appropriate performance information being collected, captured, safeguarded and used? Is data quality being assured? |
| Alternatives, Cost-Effectiveness and Lessons Learned | 13. Are there any overlaps with other government programs? Is FedNor collaborating with other departments and governments to reduce overlaps? |
| 14. Are the most appropriate and efficient means being used to achieve objectives, relative to alternative design and delivery approaches? | |
| 15. What is the value for money (VFM) of EODP (e.g., costs per project, costs per result)? | |
| 16. What lessons have been learned from EODP? | |
| 17. How do the delivery approaches of EODP compare to those of FedNor's other regional development programs (e.g., eligibility of a broader range of recipients under NODP) and other Regional Development Agencies (RDAs) (where possible). | |
| Other Issues | 18. To what extent is EODP meeting the requirements of Section 41 of the Official Languages Act (EODP is identified as a priority program)? |
| 19. To what extent is EODP contributing to the strategic outcomes laid out in Industry Canada’s Sustainable Development Strategy (2006-2009)? | |
| 20. To what extent have the recommendations (and management response) of the Formative Evaluation been implemented? |
2.2 Lines of Evidence
In order to ensure a high level of rigour in the evaluation, multiple lines of evidence were employed. In all, eight lines of evidence were implemented during the period of July 23 to October 24, 2007. Details for each line of evidence are presented below. Data collection instruments are presented in Appendix E.
2.2.1 Literature Review
GGI reviewed pertinent literature on community economic development with a focus on lessons learned from existing programs and practices. Examples of key sources consulted for this line of evidence include working papers on current thinking in regional economic development approaches from the Upjohn Institute, and several reports from Canadian and international sources. Please see Appendix F for a list of literature reviewed.
2.2.2 Document Review
GGI was provided with documentation pertaining to EODF and EODP, including the RMAF and RBAF, the formative evaluation, EODP planning documents, application guidelines, project summaries, regional profiles, etc. These documents were reviewed in order to respond to questions for the evaluation.
In addition, economic and demographic data from FP Markets – Canadian Demographics, were utilized in the analysis. FP Markets is an annual Financial Post publication providing key statistics for every census district and census metropolitan area in Canada. Data from the 2004 and 2007 publications were utilized to compare key statistics in Eastern Ontario census districts at the time the EODP program began versus today.
2.2.3 Database Review and Analysis
GGI reviewed and analyzed the EODP database for the first three rounds of funding (2004 to 2007, inclusive). Specifically, the analysis of the project database explored the questions relating to value for money (e.g., cost per project, cost per result) as well as progress towards and achievement of outputs and immediate, intermediate and ultimate outcomes.
2.2.4 Key Informant Interviews4
Interviews were completed with FedNor officials, CFDC representatives, and stakeholders. Appendix G presents a list of individuals consulted for the evaluation. Exhibit 2.2 presents the breakdown of the number of interviews by type of interviewee. As demonstrated in the Exhibit, a number of group interviews were conducted due to limited resources and a desire for inclusiveness (e.g., CFDC managers were asked to invite a member of the Board to participate in the interview, stakeholder interviews were grouped by type and representatives from several organizations were invited to participate). In the analysis, these are treated as one opinion unless individuals participating in the interview specifically voiced their own opinion for certain questions.
Interviewees were initially contacted by telephone with the exception of stakeholders where most were group interviews and logistics were more easily arranged via e-mail. All interviewees were sent a copy of the interview guide prior to the interview. Most interviews were conducted by telephone with the exception of those CFDC representatives interviewed as part of case studies or who were able to be in Ottawa for the interview. Also, one FedNor representative was interviewed in person in Sudbury. All interviews were conducted in the official language of choice of the respondent (in all, three interviews were conducted in French).
| Interview Type | # of Interviews | # of Individuals |
|---|---|---|
| Note 1: One interview included three respondents, although respondents chose to respond to each question individually, effectively serving as three interviews for the purpose of analysis. Note 2: Stakeholder interviews included the following six organization types: Eastern Ontario Wardens Caucus, Ontario East Economic Development Commission, Ontario Government, Colleges and Universities, Training/Workforce Development Boards, Municipalities. | ||
| FedNor (note 1) | 7 | 9 |
| CFDC | 18 | 20 |
| Stakeholder (note 2) | 7 | 12 |
| Total | 32 | 41 |
2.2.5 Telephone Interviews with Significant Secondary Recipients
GGI conducted 15 telephone interviews with recipients of significant contribution funding. In order to generate the list of projects from which GGI could sample, all CFDCs were asked to forward information for three projects they considered to be significant. The criteria CFDCs were asked to apply for the selection of projects included:
- Project should be material in terms of size and impact on the community;
- If possible projects should be in different components;
- Projects should be complete;
- Project recipients should be available;
- Project results should be easy to describe in an interview;
- Strategic projects that have spin-offs or other longer term impacts should be given priority.
GGI made the selection of the projects with a view to ensuring a balance of CFDC and program component.5 For most projects, initial contact was made by telephone and, where necessary, an appointment was set for the interview (otherwise, the interview took place at the time of initial contact). Fourteen interviews were conducted in English, one was conducted in French. Details regarding the completed interviews include:
- Program component: 4 Community Capacity Building projects, 3 Local Initiatives projects, 3 Skills Development projects, 2 Access to Capital projects, 2 Youth Internships projects, 1 Business Planning, and 1 Regional project;6
- Type of recipient: 8 not-for-profit organizations (including Chambers of Commerce and Associations), 3 municipalities, 2 educational institutions and 2 for-profit businesses; and,
- Number of employees (full time equivalents): an average of 35 employees and a median of 15 employees.
2.2.6 Online Survey
In preparation for the final evaluation, FedNor compiled a list of all project funding recipients for round 3 (2006-2007). At the evaluation design phase, it was decided that including funding recipients from previous rounds would be desirable in order to assess longer-term impacts of the program/fund. Thus, the database of funding recipients used for the formative evaluation (2004-2005, round 1 funding recipients) was combined with the database prepared for the current evaluation (2006-2007, round 3 funding recipients).7
GGI then worked with the databases to organize them by organization (in order to identify cases where more than one project was funded within an organization and/or more than one individual from the same organization received funding) and by program component (since individuals would only be asked questions based on the component for which they received funding). In cases where an individual was identified as having received funding for more than one project within the same program component, that respondent was asked to complete the same survey component more than once (and sometimes within the same funding year).
After a pretest with two respondents, the survey was launched September 7th, in both official languages. The survey was distributed using multiple links (one for each section of the questionnaire) in order to accommodate for multiple respondents for the same organization and multiple projects for one individual. Thus, in cases where more than one individual with an organization was identified in the database as having received funding, one e-mail was sent to both respondents with multiple links embedded identifying the contact name and funding year for each link. Only one response to the organizational section of the survey was required; therefore, the link for this section was sent to both potential respondents and respondents were asked to only complete the section once for the organization. Multiple links ensured that the questionnaire was accessible by more than one respondent at a time and allowed for respondents to skip sections that did not apply to them.
The survey was closed October 24th after sending three reminders to those potential respondents who had not yet completed the survey links sent to them. The response rate is presented in Exhibit 2.3.
| Survey Component:8 | Intro | LI | CCB | SD | YR&A | A2C | BP | Other |
|---|---|---|---|---|---|---|---|---|
| * e-mails sent (Return to Text) | ||||||||
| Total attempts* | 1049 | 270 | 323 | 400 | 215 | 80 | 340 | 1119 |
| Number bounced back | 185 | 37 | 76 | 68 | 36 | 19 | 74 | 203 |
| Total sent | 865 | 233 | 247 | 332 | 179 | 61 | 266 | 916 |
| Number completed | 330 | 143 | 91 | 237 | 85 | 24 | 90 | 338 |
| Response rate | 38.2% | 61.4% | 36.8% | 71.4% | 47.5% | 39.3% | 33.8% | 36.9% |
The exhibit indicates that the invitation was sent to 1,119 individuals (with a response rate, after bounce backs, of 36.9%), 1,049 organizations (with a response rate, after bounce backs, of 38.2%), and 1,628 projects (with an overall response rate, after bounce backs, of 50.8%). The overall response rate for all project types is 43.2 percent.
It is important to note that self-selection bias inherent in the online survey approach means that it is unclear the extent to which the responses from the approximately 63 percent of individuals who did not complete the survey would have differed from those that did complete the survey.
2.2.7 Community Case Studies
Three case studies were conducted in three communities located within three different CFDCs. Case study sites were identified in consultation with FedNor based on the following criteria:
- Geographically diverse;
- Communities should be diverse (e.g. large, medium and small);
- The nature of community success should vary (e.g., attracted industry, tourism, improved community planning).
Exhibit 2.4 presents salient details regarding those consulted for the case studies. All case studies were conducted in person over two days. Case study summaries are presented as Appendix H.
| Characteristic | Haliburton CFDC | Grenville CFDC | South Lake CFDC |
|---|---|---|---|
| Note 1: Includes double counting as two interviews were with individuals who were both stakeholders and project beneficiaries. | |||
| Community of focus | Village of Haliburton | Town of Prescott | Town of Georgina |
| # interviews | 12 | 6 | 6 |
| # individuals consulted | 12 | 7 | 6 |
| Types of interviews | CFDC (n=3); project beneficiaries (n=9) | CFDC (n=3); stakeholders (n=2); project beneficiaries (n=3) (note 1) | CFDC (n=1); stakeholders (n=1); project beneficiaries (n=4) |
2.2.8 Survey of Unsuccessful Applicants
In order to generate a list of unsuccessful applicants, CFDCs were asked to forward information. In all, 58 names from 12 CFDCs were provided to GGI with complete contact information. GGI made a preliminary selection of 25 applicants representing a cross section of CFDCs, program component and funding round (where known). In the end, due to the unavailability of some respondents, GGI contacted a total of 38 unsuccessful applicants and completed 20 interviews. In all, those organizations represented 25 unsuccessful applications. A mix of CFDC and program components was sought.
- Program component (out of 25): 16 Local Initiatives projects, 2 Community Capacity Building projects, 2 Skills Development projects, 2 Youth Internships projects, 2 Business Planning, and 1 Access to Capital project;
- Type of recipient (out of 20): 14 not-for-profit organizations (including Associations), 3 municipalities, 2 for-profit businesses and 1 educational institution; and,
- Number of employees (full time equivalents): an average of 103 employees with 4 organizations with more than 100 employees, 2 organizations with between 50 and 100 employees, 2 organizations with between 10 and 50 employees, 12 organizations with fewer than 10 employees.
2.3 Limitations to the Approach
Overall, the evaluation findings pertaining the evaluation issues of relevance, design and delivery, and alternatives are strongly rooted in the program documentation and interview findings. Several lines of evidence were employed to inform the evaluation issue of success (see Appendix D). While a number of challenges were encountered with the administrative data and online survey (described below), the overall reliability of the findings related to success is considered high. The limitations to the evaluation approach are presented below.
Document review: The economic and demographic data from FP Markets – Canadian Demographics are estimates developed from economic modelling by FP Markets using the 2001 Canadian Census and retail and demographic data provided by several Canadian market research firms. Thus, while developed using a robust model and based on multiple data sources as inputs, they remain estimates and should be treated with caution.
Database Review and Analysis: More details on this limitation are presented below under Section 3.4 (Performance Measurement). However, it is worth mentioning that the database analysis and its ability to respond to the indicators in the evaluation matrix was somewhat limited due to the lack of directly comparable data available at the community level (to allow an analysis of trends), lack of data on funding allocated at the project level for all reference periods, and the limited comparability between funding rounds (due to changes in the indicators collected). To address this, all efforts were made to mine the data for as much evidence as possible. As well, FedNor provided a supplementary database containing funding amounts at the project level (based on claims submitted to FedNor from CFDCs) for round 3 (2006-2007).
Online survey: The online survey presented a number of challenges, including:
- No project name. Many respondents were confused regarding which project they were being asked to provide details. Many respondent received funding for multiple projects since the inception of EODF/P, but respondents were only sent a link indicating the program component and year of funding, but no other details (as additional details were not available).
- No names/information for 2005/06. Given the large number of cases where organizations received funding for multiple projects, there may have been confusion around why the survey was not seeking input for projects funded in 2005-2006.
- No mandatory response to all sections. Due to the existence of multiple respondents within organizations, it was not possible to force respondents to complete all sections of the survey. Thus respondents could choose to not complete a section at all. Also, the first section was to be completed only once (in cases where there were multiple respondents within one organization), but it is possible that all respondents expected someone else to complete this section (and thus, no one completed it).
These challenges were mitigated to the extent possible via the pretest and subsequent clarification of the introductory e-mail. The limitations these challenges present to the interpretation of the data include: applicability of the findings to the missing round of funding (round 2); and, limitations related to self-selection bias due to lack of mandatory responses and confusion over which project was under consideration.
In fact, any survey where respondents are asked to self-select to participate (i.e., an invitation was sent to all project funding recipients where contact information was available and then it was left to the individual to choose to participate or not) is subject to self-selection bias. Self-selection bias can occur whenever the group of people being studied has any form of control over whether to participate. Therefore, it is not known whether the characteristics of the participants who chose to complete the survey are significantly different (in terms of their organizational characteristics, satisfaction, and opinions regarding the outcomes of their projects) than those who chose not to participate. In particular, research has shown that those with strong opinions or substantial knowledge may be more willing to spend time answering a survey than those who do not. This kind of bias can be mitigated in part with a higher response rate (thus implying that the respondents are more representative of the population). A response rate of almost 37 percent for individuals is, in fact, a reasonable response rate for an online survey. However, it remains unclear the extent to which the responses from the approximately 63 percent who did not complete the survey would have differed from those that did complete the survey.
4 This line of evidence does not include those interviewed as part of case studies with the exception of the CFDC respondents. (Return to Text)
5 The initial selection ensured that at least one project was identified for each CFDC, except those that would be participating in a case study. However, due to the inability to complete one interview and an overriding desire to get a cross section of program components, one CFDC did not have a project for which an interview could be completed. (Return to Text)
6 Adds to more than 15 because one interview respondent discussed two projects in two components as they were considered to be inextricably linked. (Return to Text)
7 Contact information for project recipients for 2005/06 (round 2) was not available as this information was not collected by FedNor from CFDCs for the purpose of the evaluation. (Return to Text)
8 Intro: Organizational Information; LI: Local Intiatives; CCB: Community Capacity Building; SD: Skills Development; YR&A: Youth Retention and Attraction; A2C: Access to Capital; BP: Business Planning; Other: Other Issues. (Return to Text)
3.0 Findings
3.1 Relevance
3.1.1 What are the priority needs of the communities eligible for EODP support?
Finding 1: Based on a review of relevant literature and documents, and interviews conducted with representatives from CFDCs and their catchment areas, the evaluation found that needs vary across communities. However, the most significant and pervasive needs are the loss of manufacturing jobs; the need to improve literacy and computing skills and retrain workers for other employment; a lack of support for tourism efforts; the out migration of youth; a lack of educational and employment opportunities; a short supply of skilled tradespeople; and the need to upgrade physical and communications infrastructure.
Findings in this section are based on: interviews with 15 CFDC Managers, community stakeholders, and representatives from community colleges and workforce development boards; FP Markets – Canadian Demographics, 2002 and 2007; visits to the Grenville, South Lake, and Haliburton CFDCs; and a review of EODP promotional materials and CFDC reports.
A comparative analysis of economic indicators over time for rural Eastern Ontario (since EODP commenced) to provincial average (with Toronto removed from the analysis) suggests that Eastern Ontario has actually fallen further behind the Ontario average. Some of the key economic indicators exhibiting this trend include: growth in average household income, business establishments, equity investments per household, and persons with trade certificates and persons with some university experience but no degree. This demonstrates a continued need for the program.Footnote 9
Needs vary across communities in Eastern Ontario, however, some needs are common to many communities. As illustrated in Exhibit 3.1, the loss of manufacturing jobs has affected more communities than any other factor (particularly, but not exclusively, along the 401 corridor). With a shift in recent years to low cost manufacturing in Asia, many communities have lost manufacturing jobs or entire plants such as Smiths Falls (Hershey), Harrowsmith (cheese factory), Cornwall (Domtar), and Chesterville (Nestle). Cornwall for example, used to have a thriving textile industry, but has lost 9,000 jobs in recent years. These jobs have been replaced to some extent by a growing call centre industry attracted by Cornwall's bilingual workforce, but the wage rates are markedly lower than the wages that unionized manufacturing provided. With a large workforce sitting idle, these communities need to retrain relatively unskilled workers to do other jobs. The loss of manufacturing jobs extends beyond the 401 corridor however. Stakeholders in communities serviced by the CFDCs of Northumberland, Valley Heartland, Peterborough, and Kawartha Lakes reported the loss of manufacturing jobs as a significant challenge their communities face. Training is particularly needed to improve literacy and computing skills, and this need extends to workers beyond the manufacturing sector. Employment challenges extend beyond manufacturing however. Many communities lack good employment opportunities in general, and very few have large employers.
Many communities offer few educational or work opportunities for youth. Youth often leave the community to pursue post secondary education and do not return because there are limited employment opportunities. Attracting satellite college campuses or providing long distance learning opportunities would help to retain younger people in communities, although, without attractive jobs for graduates, youth will continue to leave these communities.
Many communities continue to rely on dial-up Internet services, and interviews with CFDC managers and other local stakeholders revealed that five communities have a need for improved internet and communication infrastructure. By investing in improved communications infrastructure such as broadband, communities can make themselves more attractive to employers, particularly to those in information technology. This is the strategy being pursued by the Town of Georgina and assisted with EODP funding. As well, findings from the Prescott and Haliburton case studies confirmed that an up-to-date communications infrastructure is a requirement for home-based businesses, and would also serve to attract new residents to the area.
Better physical infrastructure such as roads, sewers, bridges, and water is needed by several communities. For instance, infrastructure can be stretched by in-migration to communities that offer attractive lifestyles. The Town of Georgina served by the South Lake CFDC has attracted a number of bedroom commuters in recent years who expect urban services for their tax dollars. A similar trend is being experienced in Prescott (serviced by the Grenville CFDC) and other communities south and west of Ottawa, where bedroom commuters are placing increased demands on infrastructure to accommodate rush hour traffic.
A number of communities have a vibrant tourism industry, or wish to develop one. These communities often have natural resources such as lakes or rivers that attract tourists, but are increasingly under environmental pressure. Community theatres and art galleries require funding to improve marketing and promotional efforts, or renovate their buildings.
Skilled tradespeople are in short supply in many communities in Eastern Ontario. Several communities such as those served by the Renfrew and 1000s Islands CFDCs need assistance in providing opportunities for high school students and other young people to become skilled tradespeople. This community need must be addressed within the context of bringing additional skilled jobs to the area since developing a skilled workforce will only benefit the community if those skilled workers stay.
A number of other challenges continue to face Eastern Ontario communities including a lack of financial support for non-profit organizations, a lack of access to capital and in particular, venture capital for new business ideas.
Exhibit 3.1, below presents the most significant and pervasive needs and challenges currently facing these communities. Needs and challenges that were mentioned by at least two communities are presented in order of most mentions.
| Needs and Challenges | CFDCs/Communities Impacted | Number |
|---|---|---|
| Note: SDG = Stormont Dundas, and Glengarry, PELA = Prince Edward /Lennox & Addington, NCHSA = North Central Hastings/South Algonquin, SLCFDC = South Lake CFDC. Figures are derived from interviews with CFDC managers and other community stakeholders using open ended questions. | ||
| Loss of jobs/skills retraining (manufacturing ) | Northumberland, Valley Heartland, 1000 Islands, Frontenac, Peterborough, SDG, Grenville, Kawartha Lakes | 8 |
| Aging population/out migration of youth | PELA, Renfrew, Northumberland, SDG, Trenval, SLCFDC, Haliburton | 7 |
| Lack of employment in general | Renfrew, NCHSA, Valley Heartland, Frontenac, Haliburton, SLCFDC | 6 |
| Improved physical infrastructure (including roads) | Grenville, Prescott-Russell, Kawartha Lakes, SDG, Haliburton, SLCFDC | 6 |
| Support for tourism efforts | PELA, Renfrew, 1000 Islands, Kawartha Lakes, SLCDFC | 5 |
| Better Internet/communications infrastructure | Grenville, Renfrew, Kawartha Lakes, Haliburton, SLCFDC | 5 |
| Lack of skilled labourers/ tradespeople | PELA, Peterborough, Kawartha Lakes, SLCFDC | 4 |
| Skills development (literacy/computing) | Valley Heartland, Trenval, Renfrew | 3 |
| Support for non-profit organizations | Peterborough, Haliburton, SLCFDC | 3 |
| Loss of jobs/job creation (general) | Valley Heartland, 1000 Islands | 2 |
| Access to capital/venture capital | SDG, Trenval | 2 |
| Lack of large employers | PELA, SLCFDC | 2 |
| Other needs/challenges (support for agriculture, shortage of doctors, shortage of serviceable land) | Renfrew, Northumberland, Kawartha Lakes, 1000 Islands, SLCFDC | 7 |
3.1.2 To what extent is EODP relevant to these needs?
Finding 2: Based on a review of documents, case studies, and interviews with stakeholders, EODP is relevant. There is at least one EODP funding stream (and often several) that can be accessed to address every one of the pressing community needs identified by stakeholders.
As illustrated in the table below, for each of the major pressing needs identified by community stakeholders, there is a corresponding EODP component to address the need.
| Needs and Challenges | Relevant EODP Funding Stream |
|---|---|
| Loss of jobs/skills retraining (manufacturing ) | Access to capital, business planning, community capacity building |
| Aging population/out migration of youth | Youth internship, local initiatives |
| Lack of employment in general | Access to capital, business planning, youth internship |
| Improved physical infrastructure (including roads) | Needs related to roads, sewers and bridges are not addressed by EODP. However, the program does provide funding (via access to capital) to make capital and other building-related improvements |
| Support for tourism efforts | Local initiatives, business planning, skills development, youth internship, access to capital |
| Better Internet/communications infrastructure | Community capacity building |
| Lack of skilled labourers/ tradespeople | Skills development, youth internship, local initiatives |
| Skills development (literacy/computing) | Skills development, local initiatives |
| Support for non-profit organizations | Local initiatives, business planning, youth internship |
| Loss of jobs/job creation (general) | Business planning, skills development, youth internship, local initiatives, access to capital |
| Access to capital/venture capital | Access to capital |
| Lack of large employers | Business planning, community capacity building |
Interviews conducted with CFDC managers, community stakeholders, and interviews conducted with significant project recipients confirmed that the various funding streams of EODP are relevant for communities wishing to address their particular needs and challenges.
3.2 Program Design and Delivery
3.2.1 Is the EODP design and the associated funding, terms and conditions appropriate?
Finding 3: Most stakeholders appear to be satisfied with the manner in which EODP is designed. Its strength is the use of the CFDC as its delivery agent.
There are weaknesses to the EODP design that diminish program effectiveness, however. The annual nature of funding discourages strategic and long-term projects; overall funding levels may be too low and spread across too many objectives to be effective; and allocating equal funding across CFDCs fails to acknowledge that some communities have greater needs than others.
Findings are based on interviews with CFDC representatives, community stakeholders, FedNor officials, recipients of significant project funding, and case studies. Documents were also considered to respond to this question. Subsequent sections of this report delve further into key characteristics of the program's design (e.g., roles, project selection processes, and extent of overlap with other programs). This section focuses on the overall design, funding levels, and funding allocation.
According to the majority of interviewees, the program appears to be reasonably well designed. Most reported no problems with the payment process, and for most, the reporting requirements are reasonable (there were a few dissenters). The strength of the program design appears to be the use of the CFDC as its delivery agent. The consensus is that CFDCs better understand local needs and are therefore better suited to select local projects. Every CFDC is operated by a manager and governed by a Board of Directors who live in the community and understand its particular needs. Correspondingly, the selection of EODP projects is reported to take into account the credibility and track records of the recipients, alignment with strategic initiatives (where they exist), and potential impacts to the community.
There are a number of areas in which the design of EODP is less than ideal, however. The weakness in program design most commonly pointed out by respondents was the short term (i.e. annual) nature of EODP funding. This design characteristic impacts communities in several ways. As currently designed, EODP encourages small, short term projects and discourages strategic initiatives with potentially larger impacts. Many respondents stated that stable, multi-year funding would allow organizations to pursue larger, more strategic initiatives. Additionally, the requirement in some years to spend funding between November and March, encouraged CFDCs to choose projects that could spend funds in a short time frame, at the expense of longer term projects.
The review of documents (and subsequent analysis by the evaluators) revealed another weakness in the design of the program, namely the allocation of equal amounts of funding to each of the 15 CFDCs. The approach is based on the operational funding model of Community Futures Program, where each CFDC receives an equal operating budget to cover overhead expenses and to provide a loan fund. Providing equal EODP funding to each CFDC however, fails to acknowledge that the demand and need for EODP funding varies across communities, as it is likely influenced by many factors such as number of establishments, business conditions, population, and unemployment rates. The result is that some CFDCs see demand for EODP funding that outstrip supply several times over, meaning that some very worthy projects go unfunded. For example the EODP database reveals that in round 3 (2006/07), the 1000 Islands CFDC received 13 loan applications for the Access to Capital component of EODP, while the Greater Peterborough BDC received only one application.
The program also spreads itself thin by distributing this relatively small amount of funding (just over $500,000 per CFDC) across five distinct streams, each of which supports very different activities and objectives, although a small amount of funding can be effective if applied strategically and in combination with other sources of funding. At the same time, if funding were dramatically increased, FedNor may be forced to consider a different delivery method (e.g., entering directly into agreements with municipalities and other large organizations), as the CFDCs might not have the capacity to accommodate greatly increased funding levels. Section 3.5.1 explores other funders delivering similar programs and offers a more detailed discussion on program design and funding allocation across program components.
Recommendation #1—Consideration should be given to revisiting the EODP funding formula for allocations to CFDCs, so that capacity and socio-economic variables play a role in the allocation of funding. Also, CFDCs should have increased flexibility for allocating funding to secondary recipients among the program components according to the local strategic priorities.
3.2.2 Is FedNor playing an appropriate role to the primary recipients, in terms of providing advice, service and support?
Finding 4: Discussions with FedNor officials revealed that the manner in which they view their role in terms of providing advice, service, and support is in line with the role outlined in EODP program documentation. In some cases, the role played by FedNor exceeds what is required by their mandate. Most CFDC respondents feel that FedNor is playing an appropriate role; a minority (just under a quarter) feel that FedNor could provide more support, particularly in terms of tools, templates, staff and training.
The lines of evidence contributing to these conclusions consisted of interviews with CFDC managers, stakeholders and FedNor officials, as well as information obtained from the RMAF (2006) and other pertinent documentation.
In the logic model, one of the activities intended to drive EODP is the facilitation and coordination of partnerships and networks. FedNor staff who were interviewed recognized one of their primary responsibilities to be the facilitation of CFDC partnerships to strengthen community capacity to plan and implement economic development projects. Other responsibilities both outlined in the RMAF and described by FedNor key informants are:
- Establishing overall objectives for EODP;
- Reviewing and monitoring the overall progress of EODP;
- Monitoring, in conjunction with primary recipients, the outcomes of program activities;
- Reviewing and approving requests from primary recipients for EODP funding; and
- Overseeing the delivery of EODP by primary recipients based on a risk-assessment that determines the extent of monitoring and review required by FedNor.
The Performance Measurement Plan in the RMAF specifies that FedNor is responsible for keeping track of program budgets, expenses, final reports and previous evaluations to compile and review for control purposes. FedNor key informants recognized these as their responsibility and added a few more, including the provision of reporting tools and templates, payment verification and claims processing, assistance with environmental assessments, as well as advice regarding conflict of interest, official languages, and tourism/regional projects. One CFDC respondent expressed appreciation to FedNor for sharing its experience from NODP (e.g., youth internship requirements and criteria, minimum requirements for contracting), another core program delivered by FedNor. A minority (just under a quarter) of CFDC respondents were less positive in regards to these responsibilities, criticizing the lack of tools, templates and staff, and high administrative overhead for services rendered by FedNor.
Many CFDC key informants awarded praise to FedNor generally and to FedNor officers specifically in relation to functional guidance, assistance on environmental matters, and support and advice in general.
FedNor respondents who were consulted feel their role could be much greater/they could offer more value added if they had more input to projects, particularly regional project selection and scoping/design of community capacity building projects. In this respect, it was suggested that FedNor officers could assist with due diligence, partnerships, opportunities for complementarity with and funding from other programs in addition to the support they currently provide. A couple of CFDC respondents would like to receive more support from FedNor (i.e., on technically sophisticated projects, and on policy development such as dealing with conflict of interest, board composition, and governance structures).
Several CFDC respondents provided suggestions on how FedNor support could be improved.
Three of these respondents suggested improvements with respect to training:
- Training in completing the reports required;
- Training sessions for volunteers acting as ambassadors; and
- Media relations training for volunteer boards and staff with regards to press releases and the handling of successful and unsuccessful applications.
Other suggestions for improvements from CFDC respondents pertained to increasing resources (i.e., more staffing/less turnover of FedNor staff, regional case officers, better tracking methods) more regular meetings (i.e., with other CFDCs for sharing of best practices/lessons learned), and some program modifications, such as more stringent eligibility criteria and elimination of the monthly reporting requirements when there are no expenses.
3.2.3 Are CFDCs playing an appropriate supporting role to the secondary recipients, in terms of providing advice, service and support?
Finding 5: The evaluation found that CFDCs generally undertake a catalytic role in many communities — encouraging new project development, funding of strategic/planning studies for communities, mobilizing broader community stakeholders/players, helping to form partnerships. Some CFDCs undertake the role of economic capacity developers in some CFDC catchment areas that are lacking in such support.
Secondary recipients and unsuccessful applicants alike demonstrated high levels of satisfaction with the role of CFDCs.
The lines of evidence contributing to these conclusions included information obtained through program documentation, including: the CFDC websites, the Status Report on the progress of implementing the recommendations from the formative evaluation, key informant interviews with CFDC respondents, stakeholders and unsuccessful applicants, and survey results.
On the Ontario Association of Community Futures Development Corporations website, CFDCs are described as community-based, not-for-profit organizations run by a board of local volunteers that offer four core services to recipients: strategic community planning and socio-economic development; support for community-based projects; business services; and access to capital. The roles and responsibilities of CFDCs (primary recipients) when entering into contribution agreements with secondary recipients are outlined in program documentation, as follows:
- All projects undertaken through third party contribution agreements with secondary recipients will meet the broad program eligibility criteria.
- With respect to third party contribution agreements with secondary recipients, primary recipients will make decisions regarding project approvals under the EODP in determining whether projects meet the program criteria. Secondary recipients will provide information to the applicable primary recipient to enable the determination of eligibility and to assess the projects against program criteria.
- Primary recipients will assess all applications for projects and make decisions based on local and regional needs, priorities and opportunities.
- Primary recipients, with support and advice from the Department, will provide administrative capacity and quality control in support of EODP program delivery.
- Primary recipients will be responsible for ensuring due-diligence assessments are undertaken, including a detailed review of project budgets and eligible costs, a review for Canadian Environmental Assessment Act requirements, a review of expected long-term sustainable economic benefits, an assessment of risks associated with the project, expected results and outcomes and the proponent's strategy for measuring and reporting of results.
Based on results from this evaluation, CFDCs meet, and in some cases, exceed the responsibilities outlined above (although capacity building is consistent with the CFDCs located in some smaller communities). According to CFDC key informants, assistance provided by CFDCs varies considerably and can range from very hands-on assistance (e.g., project identification and scoping) to more functional guidance (e.g., help completing reporting templates). It was cited that smaller communities do not have the same advantages as the bigger communities who have their own economic development office and staff. Indeed, due to the lack of economic development capacity in these CFDC catchment areas, it was reported that many CFDCs undertake this role in their communities.
Several CFDC officials have put in place certain practices to ensure that adequate service and support is delivered to secondary recipients, such as holding workshops or information sessions on topics such as skills training and business plan development, seminars for potential EODP second party recipients, and application-writing workshops. Half of the responding stakeholders praised CFDC staffing for their knowledge and professionalism, as well as their administrative abilities (i.e. management of multiple projects, handing of paperwork, etc.). Particular CFDC undertakings that are appreciated by stakeholders include:
- Workshops on proposal writing for sponsors and organizations;
- Management of "slippage" that comes through by using short-listing;
- Management of funds before deadlines; and
- Keeping ahead of demand.
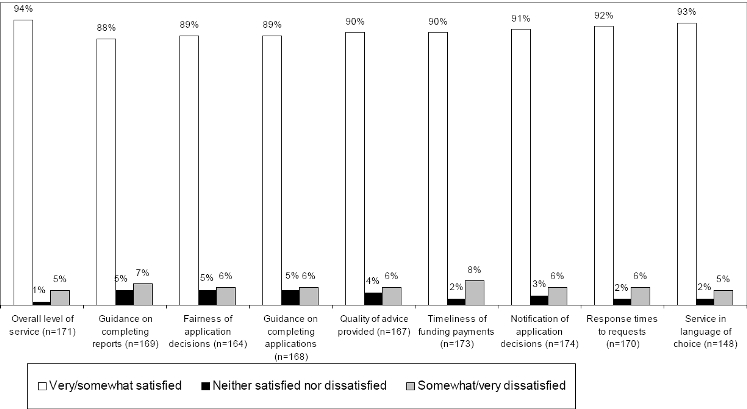
The survey of secondary recipients revealed high levels of satisfaction, particularly with obtaining service in the language of choice (93% very or somewhat satisfied), and response time to requests (92% very or somewhat satisfied) as illustrated in Exhibit 3.3:
CFDC respondents mentioned that they take some or all of the following steps to ensure adequate service provision to secondary recipients:
- Ensuring adequate CFDC staffing allocations for EODP;
- Assistance provided to potential applicants in structuring projects or in developing applications for training support;
- Information to past recipients when funding is available;
- Timely notification of successful applications;
- Monitoring of each of the projects; and
- Assistance to unsuccessful applicants to understand why they did not get funding and also assist them with modifying their ideas, so they are better positioned to get funding in the next round.
Despite overall positive results, a few stakeholders were more critical, particularly with respect to staffing issues. They feel that the CFDCs are "stretched too thin" and that they do not have enough resources (i.e., staff) to meet the requirements; that it is difficult to structure the office because qualified staff work only part-time and it is difficult to assign people to a position when they do not know if it will be permanent. Uncertainty as to whether there will be funding from year to year engenders challenges related to hiring and retaining contract workers.
Other shortcomings mentioned by secondary recipients include the payment process, which could be sped up, and the reporting process, which is perceived as cumbersome at times.
When asked for suggestions on how the level of support could be improved, six CFDC officials suggested that service delivery would be greatly improved if the CFDCs had a multi-year program/annual-based funding (which would in turn help with maintaining high quality staff and continuous, high quality program delivery).
3.2.4 Is the EODP project selection process effective? Have the criteria been adhered to?
Finding 6: Secondary recipient project selection varies considerably from one CFDC to another in terms of the role played by the EODP coordinator, the CFDC manager and the CFDC Board of Directors. Generally, however, feedback from key informants and project applicants indicate that the selection processes are effective and appropriate. Some opportunities for improvement were raised by unsuccessful applicants around how CFDCs advise applicants that their project was not approved.
Some concerns were raised by key informants regarding the selection of regional projects. While most acknowledged that the process has improved considerably, some key informants raised issues relating to the process and the nature of the regional projects funded.
The criteria outlined in program documentation relating to eligible project activities and eligible organizations appear to be applied.
The documentation and database were reviewed for existing information regarding criteria and the number of applications received and funded. Project applicants were asked for their opinions regarding the application process (including both successful and unsuccessful applicants). Finally, key informant interviewees were asked their opinions regarding the appropriateness and effectiveness of the current project selection processes.
While an in-depth review of the secondary recipients and project descriptions for all funded projects was outside the scope of this evaluation, activities undertaken during the course of the evaluation did not reveal any inconsistencies with selection criteria. Moreover, interviews with FedNor did not reveal any concerns regarding the adherence to eligibility criteria.
As presented in Appendix I, according to program documentationFootnote 10, the program approved just over two-thirds of all applications in the last round of funding (round 3, 2006-2007). This represents an increase over the two previous years of the program where 50% and 62% of applications were approved in round 1 (2004-2005) and round 2 (2005-2006), respectively. The number of applications received varies considerably by component by year, although the Skills Development and Local Initiatives components are the most applied-to components for all years (see Appendix I for more details).
While the number of applications received and approved were provided, there was no data available regarding the reasons applications were turned down. For example, it is impossible toindicate the extent to which additional projects could have been undertaken with additional funding since it is possible that many applications were not approved because they did not meet selection criteria.
Selection processes of secondary recipients vary considerably from one CFDC to the next. From the way in which the program is reported, to the amount of assistance provided to applicants, to how applications are received, reviewed and approved, there are many opportunities for CFDCs to share their experiences and processes. Appendix J presents the range of processes discovered by the evaluation and, based on feedback from FedNor respondents (often building on best practices gleaned from NODP and from familiarity with a number different approaches), those considered to be best practices.
CFDCs are positive about the selection process, praising the local nature of the establishment of criteria and decision-making, the cost-effective use of existing infrastructure/boards to select projects.
The issue of conflict of interest was raised by a small number of CFDC representatives as being an issue for project selection. Due to the small sizes of the communities from which to draw both Board members and projects, it is often difficult to limit projects to those that do not involve (in any way) members of the Board. Thus, for those CFDCs for whom their conflict of interest guidelines present this challenges, CFDCs are struggling with processes that address this issue.
Feedback from project applicants regarding the selection process was generally positive, even from unsuccessful applicants. As presented in Exhibit 3.4, satisfaction was generally quite high among project recipients. Unsuccessful applicants were generally less satisfied, although not markedly.
However, unsuccessful applicants did have concerns with the explanation as to why their funding request was turned down (60 percent were dissatisfied). The most commonly cited reasons for the dissatisfaction were lack of transparency and unclear guidelines (each cited in the case of 5 unsuccessful applications).
| Application Characteristic | Project Recipients Percent Somewhat/Very Satisfied | Unsuccessful Applicants Percent Somewhat/Very Satisfied |
|---|---|---|
| Guidance on completing applications | 89 | 83 |
| Fairness of the application decision | 87 | 81 |
| Notification of the application decision | 90 | 80 |
With regards to regional project selection, there was general dissatisfaction among all respondent types (i.e., CFDCs, FedNor). This issue was also raised in the Formative Evaluation and key informants acknowledged that a number of improvements have been made (including the establishment of a regional committee comprised of CFDC and Chief Administrative Officer (CAO) representatives to develop the terms of reference for assessment and selection of regional projects).
However, concerns remain among many CFDC representatives. One respondent echoed the sentiment voiced by many respondents that the regional project selection process is "divisive" "inconsistent" and "often unfair" as there is a feeling that CFDCs are competing with one another for scarce funding. Consistent with the concerns voiced by CFDCs, some weaknesses of the current approach cited by FedNor respondents include: it leads to lobbying among CFDCs; there is no open call or advertising; it is not inclusive of all communities; and projects put forward are those hand picked by Boards for consideration.
Some FedNor respondents feel that the selection process for regional projects would benefit from a greater FedNor role in identifying, scoping, redesigning, and selecting projects.
The evaluation found that the current mechanism of selecting regional projects by committee has two flaws. First, committee members have a vested interest in the proposals that come from their catchment areas. Second, committee representatives end up voting on regional proposals concerning catchment areas that are far away from their catchment areas (and thus may not understand the local situation or alternatively, have no interest in the matter). The evaluation concluded that the process for selecting regional projects is problematic and complicated.
Recommendation #2—FedNor should continue to work with CFDCs to improve the process for identification, design and approval of regional or sub-regional projects and should play a more proactive role in this process.
3.3 Success
3.3.1 Is EODP effective in meeting its objectives and within budget?
Finding 7: EODP has made progress toward the immediate outcomes of the EODP RMAF, however, without targets, it is difficult to determine the extent of the progress. EODP spending has been within its planned budget.
The lines of evidence contributing to these conclusions included interviews with funding recipients, interviews with CFDC managers and stakeholders, who provided insight with respect to the overall degree of EODP success in accomplishing its goals; case studies, which comprised interviews with CFDC managers and stakeholders as well as funding recipients; the database, which supplied some data on RMAF indicators; and the survey.
It is important to highlight that it is difficult to draw meaningful conclusions from the data in absence of targets and/or benchmarks. Moreover, most of the indicators for immediate outcomes (as defined in the program RMAF) measure outputs such as the number of projects funded, and the number of workshops held. These indicators are not appropriate for measuring immediate outcomes. A review of the EODP RMAF revealed that a number of indicators could be improved for measuring immediate outcomes.
Findings related to each of the five outcomes are presented below. Where possible, the evaluators have provided data for the indicators that were deemed to be appropriate and identified other indicators (and associated data) that are more appropriate for measuring immediate outcomes. Evidence from the database pertaining to the findings for this section are presented in Exhibit 3.5.
Outcome: Enhanced technology infrastructure and innovation
For enhanced technology infrastructure and innovation, the EODP RMAF has three indicators: 1) number of businesses/communities with improved access to technology infrastructure/innovation; 2) number and dollar value of projects enhancing technology infrastructure and innovation; and, 3) $ value leveraged from other partners. The first indicator is useful for measuring the outcome, however, the second and third measure outputs (projects and funding), and do not provide any evidence that technology infrastructure and innovation have been enhanced. As illustrated in Exhibit 3.5a below, approximately 16 communities and 121 businesses experienced increased access to technology infrastructure from participating in EODP projects. Approximately 101 businesses were able to develop innovative products, services, or processes. The actual number of businesses and communities impacted is likely higher, as the evaluation's data collection activities only reached a sample of funding recipients.
| Indicator | Evidence/data |
|---|---|
| LI=Local Initiatives; CCB=Community Capacity Building; SD=Skills development; YRA=Youth Retention & Attraction; BP=Business Planning | |
| Number of communities with improved access to technology infrastructure | 16 projects where recipient stated project contributed to improved access to technology infrastructure (7 LI/ 9 CCB). The number of communities impacted may be less than 16 if some communities participated in more than one project that yielded this result. |
| Number of firms with increased access to technology infrastructure | 121 projects where recipient stated project contributed to increased access to technology infrastructure. (64 SD/36 YRA/ 21 BP). The number of firms may be less than 121 if some firms participated in more than one project. |
| Number of businesses that developed innovative products, services, and processes | 101 projects where recipient stated project contributed to the development of innovative products, services, and processes. (53 SD/ 40 YRA/ 8 A2C). |
Outcome: Improved business development
For improved business development, there was one indicator in the EODP RMAF: number/value of business plans developed. This is not an appropriate indicator, as the creation of a business plan itself is no guarantee of improved business development. Appropriate indicators of improved business development are the number of firms that have expanded business locations, are able to handle more customers, have increased sales revenues, and have expanded or initiated export activity. Exhibit 3.5b reveals that EODP has helped approximately 40 firms expand locations, 220 firms accommodate more customers, 103 firms increase sales revenues, and 14 firms increase export activity.
| Indicator | Evidence/data |
|---|---|
| Number of businesses that expanded locations | 40 projects contributed to expanded locations (14 SD/ 11 YRA/ 15 BP). |
| Number of businesses that can now accommodate more customers | 220 projects contributed to accommodating more customers (114 SD/ 59 YRA/ 47 BP). |
| Number of businesses that increased sales revenue | 103 projects contributed to increased sales revenue. (72 SD/ 31 BP). |
| Number of businesses that increased export revenue | 14 projects contributed to increased export revenue. (7 SD/ 7 BP). |
Outcome: Improved skills development
For improved skills development, the EODP RMAF provides four indicators: 1) number and dollar value of projects focused on improved skills development; 2) number of workshops/training/counseling sessions held (including sector specific workshops/training/counseling sessions); 3) number of people trained; and, 4) $ value leveraged from other partners. Indicators #1 and #4 do not help in measuring the outcome. Indicators #2 and #3 suggest (by inference) that some skill improvement has likely occurred.
Exhibit 3.5c illustrates that 4,127 workshops, training courses, or counseling sessions have been funded by EODP, and 15,076 people have received training. According to funding recipients, the skills of employees at approximately 166 organizations were improved, and approximately 172 organizations updated or developed training materials, policies, and procedures.
| Indicator | Evidence/data |
|---|---|
| Number of workshop/training/counseling sessions | 4,127 (from EODP database) |
| Number of people trained | 15,076 (from EODP database) |
| Extent of skill improvement due to training | 73 skills development projects that yielded a significant skill improvement; 81 yielded an improvement; 12 yielded a slight improvement |
| Number of firms that developed/updated training materials/ policies/ procedures | 172 projects contributed to this outcome (98 SD/ 46 YRA/ 28 BP) |
Outcome: Improved community capacity for socio-economic development
For this outcome, the EODP RMAF provides four indicators: 1) number of community organizations partnering on projects; 2) number of community/organizational plans developed; 3) number and dollar value of local initiatives projects; and 4) $ value leveraged from other partners. Indicators #1, 3, and 4 are not useful in measuring the outcome. Indicator #2 is useful because planning is a key activity in developing community capacity.
Exhibit 3.5d illustrates that 43 community/organizational plans were developed with EODP funding, and EODP projects helped approximately 103 community organizations to improve their community planning.
| Indicator | Evidence/data |
|---|---|
| Number of community/organizational plans developed | 43 in Round 3 (Round 1 and 2 figures unavailable) |
| Number of community organizations that improved their community planning | 103 projects contributed to this outcome (58 LI / 45 CCB) |
Outcome: Attraction, retention and development of youth
There are three indicators in the EODP RMAF for this outcome: 1) number and dollar value of internship agreements with not-for-profit/private recipients; 2) number of youth placed with not-for-profit/private recipients; and 3) number of youth hired following training/internship. The first two indicators are not appropriate because they provide no evidence that youth are being attracted or retained in Eastern Ontario. The third indicator is appropriate. Exhibit 3.5e demonstrates that approximately 185 youth interns have been subsequently hired by organizations in Eastern Ontario (figures based on EODP database).
| Indicator | Evidence/data |
|---|---|
| Number of youth interns with ongoing employment in Eastern Ontario following internship | 113 in Rounds 1 and 2/ 72 in Round 3 |
Outcome:Improved access to capital and leveraged capital
For access to capital and leveraged capital, there are four indicators in the EODP RMAF: 1) number of loan applicants; 2) number and value of business loans provided by EODP funding; 3) number of businesses created/expanded; and 4) number of jobs created/maintained. These indicators are not particularly useful in measuring this outcome. The number loan applicants and the number and value of loans for example, do not provide any insight into the extent to which the applicants have encountered difficulty accessing capital in the past, or had alternatives in addition to EODP to secure capital. Indicators 3 and 4 are actually outcomes that may result from securing additional capital, but their occurrence may also be solely attributable to other factors such as improved skills, better business planning, etc.
Better indicators are the extent to which projects would have proceeded without the EODP funding, and the extent of leveraging of other funding sources. As illustrated in Exhibit 3.5f, about 41% of organizations would not have proceeded with their activities without EODP funding. Approximately $27M was leveraged from other sources.
| Indicator | Evidence/data |
|---|---|
| Percentage of businesses that secured loans where activities would not have proceeded without EODP funding/ or scale of activities reduced | 41.7% of respondents indicated that they would not have proceeded at all with their activities without the EODP funding; 41.7% indicated that they would have proceeded, but the scale of activities would have been reduced. |
| Extent of capital leveraged | $27.0M leveraged from other sources ($19.5M in Rounds 1 and 2/ $7.5M in Round 3) |
3.3.2 Is EODP resulting in any unintended outcomes?
Finding 8: EODP is resulting in some unintended outcomes, the majority of which were described by key informants as being positive. One key positive outcome cited by key informants was the heightened community awareness of CFDCs' activities. One key negative outcome cited by key informants was the competition among CFDCs resulting from the regional component of the Program. Few respondents indicated that a strong working relationship among the 15 CFDCs had resulted from the regional component of EODP.
Lines of evidence contributing to the conclusion that EODP is resulting in some unintended outcomes included interviews with CFDC managers and stakeholders; interviews with federal government officials; and case studies, which comprised interviews with CFDC managers and stakeholders as well as funding recipients.
Heightened awareness of CFDCs' activities by the community was the most common unintended positive outcome of EODP cited by CFDC managers, federal government officials and stakeholders.
Examples of additional unintended positive outcomes cited by interviewees included: partnerships and cooperation between private sector entities and the non-profit sector (e.g., a partnership with the school board and a science camp established a high-speed Internet presentation facility that is community-accessible); innovation among funding recipients; retention of employees; an improved profile of the federal government; and greater individual involvement in the community.
Several key informants indicated that EODP had resulted in unintended negative outcomes. Of those interviewees that cited unintended negative outcomes, a couple indicated that the regional component of the program had led to competition among CFDCs for regional funding dollars.
3.3.3 To what degree has EODP contributed to the development and retention of new and existing businesses?
Finding 9: EODP has contributed to the development and retention of new and existing businesses to some extent, although in the absence of targets or benchmarks, it is unclear how successful the program has been in this regard. According to the database, 43 business were created or expanded and 49 business plans were written during fiscal year 2006/07 as a direct result of EODP. These figures are overwhelmed, unfortunately, by a 5.9% decrease in the number of establishments in Eastern Ontario since the program began.
Lines of evidence contributing to this issue included interviews with funding recipients, some of whose businesses developed as a result of EODP funding; case studies, which comprised interviews with CFDC managers and stakeholders as well as funding recipients; FP Markets – Canadian Demographics, 2002 and 2007, The Financial Post; the survey; and the EODP database, which supplied statistical information relating to RMAF indicators.
According to the database, 43 businesses were created or expanded during fiscal year 2006/07 (comparable figures are not available for fiscal year 2005/06), and 49 business plans–which can potentially contribute to the development of a business – were written as a direct result of EODP. Additionally, several funding recipients interviewed–typically municipalities–indicated that their EODP-funded projects had contributed to the development and retention of new and existing businesses, for example, by enabling/encouraging improvements to the facades of downtown businesses. This sentiment was echoed in one case study, where interviewees indicated that businesses in the downtown area were revitalized as a result of EODP funding.
Furthermore, according to the survey, 34 local-initiatives funding recipients (81.0%) and 27 community capacity building funding recipients (84.4%) indicated that their projects had contributed to business retention.
An examination of macro statistics reveal that retail sales increased 11.9% in Eastern Ontario from 2004 to 2007, implying that businesses expanded, however, this figure is almost four percentage points lower than the corresponding increase for Ontario overall. Furthermore, the number of establishments fell 5.9% during this time period, which was a greater decrease than the figure for Ontario overall (-4.2%).
3.3.4 To what degree has EODP improved competitiveness of rural Eastern Ontario businesses and/or communities?
Finding 10: Overall, organizations responding to the survey reported that EODP has helped them become more competitive through funding projects that have enabled them to offer a wider range of services, develop new products, and expand marketing activities. Communities have been strengthened by finding employment for young people, and investing in physical and social infrastructure.
Because EODP funding is relatively small in comparison to the economy of Eastern Ontario, the impacts of projects may not be seen beyond the organizations that participate in EODP. Impressions of survey respondents reveal that they see little overall change in their communities' competitiveness. Case study respondents, however, depicted EODP as positively affecting the competitiveness of their community.
The evaluation drew upon the survey of funding recipients, as well as case studies, interviews with representatives of significant projects, and interviews with CFDC and community representatives to inform this evaluation question.
The case studies and interviews with CFDC and community representatives provided numerous examples of EODP funded projects that helped organizations be more competitive. They also provided many examples where projects helped communities address social challenges and generally improve the quality of life in communities. The discussions of these projects assisted evaluators in better understanding the manner in which EODP made a difference in communities. These projects however, represented a relatively small share of all EODP-funded projects, and interviewees were likely to focus on only the most successful projects, thus resulting in skewed findings from key informants. How widespread and significant were the impacts of EODP funded projects can be better understood by examining the survey responses of approximately 300 organizations that received EODP funding.
As mentioned earlier, the most significant challenge in determining the extent to which the program has improved the competitiveness of businesses and communities is the fact that targets against which progress can be benchmarked are absent from the EODP RMAF. For instance, the RMAF cites a number of indicators (e.g., the percentage of projects where the community received a recognizable socio-economic benefit from the project), but the indicators are not quantified in any manner. Correspondingly, it is not possible for evaluators to determine the extent to which EODP has achieved its objective of improving community and business competitiveness.
The analysis revealed that the program has helped some organizations however, improve their top and bottom lines, develop more effective employees, hire more employees, and to develop stronger communities.
Increased Revenues
By participating in EODP funded skills development activities, organizations experienced a direct impact on their top and bottom lines. As illustrated in Exhibit 3.6 below, EODP projects increased the sales revenue of 117 organizations. This consisted of 72 organizations that undertook skills development projects, 14 that undertook access to capital projects, and 31 that undertook business planning projects. Note that the exact number of organizations may be slightly lower assuming a few organizations engaged in more than one EODP stream. Business planning had the largest impact on the top lines of organizations, with those organizations experiencing an average revenue increase of 33.3%.
| Benefit | EODP Component | # Survey Respondents | # Organizations Affected | % of Respondents | Average Percentage Increase |
|---|---|---|---|---|---|
| Increased sales revenue | Skills development | 237 | 72 | 30.4% | 18.5% |
| Access to Capital | 24 | 14 | 58.3% | 16.9% | |
| Business Planning | 90 | 31 | 34.4% | 33.3% |
Interviews with CFDC managers also provided examples of EODP impacting revenues. For example, the Kawartha Lakes CFDC provided EODP funding for the 150th anniversary of the Town of Lindsay, which attracted thousands of people and resulted in record sales for local merchants. The CFDC also provided EODP funding to upgrade and expand docking facilities in the Town of Bobcaygeon, resulting in an estimated $500K of economic benefit to the town from additional boating traffic.
Overall, it would appear that revenues increased for 30% to 58% of organizations that participate in skills development, access to capital, and business planning EODP projects. Revenue increases were most common for organizations that received access to capital funding and largest for organizations that undertook business planning.
Increased Exports
An examination of the survey responses reveals that EODP is reaching few organizations that export, a key target group in any regional economic development program, as exporters bring outside money into the community. As illustrated in Exhibit 3.7, only 31 of 330 organizations that responded to the survey earn revenues from exporting beyond the borders of Eastern Ontario. For most of these organizations (18), exporting accounts for less than 26% of total revenue. Twenty-seven organizations export beyond Ontario's borders, and 24 export internationally.
| % of Sales from Exports | Firms that Export Outside Eastern Ontario | 31% of respondents | Outside of Ontario | % of respondents | Outside of Canada | % of respondents |
|---|---|---|---|---|---|---|
| 1-25% | 18 | 5.5% | 19 | 5.8% | 14 | 4.2% |
| 26-50% | 2 | 0.6% | 2 | 0.6% | 5 | 1.5% |
| 51%-75% | 2 | 0.6% | 4 | 1.2% | 2 | 0.6% |
| 76% or more | 9 | 2.7% | 2 | 0.6% | 3 | 0.9% |
| Total | 31 | 9.4% | 27 | 8.2% | 24 | 7.3% |
As illustrated in Exhibit 3.8 below, seven exporters who undertook skills development projects and seven exporters that undertook business planning projects experienced increased export revenues of 26.7% and 15.9% respectively. No organizations that undertook access to capital projects experienced an increase in export revenue.
| Benefit | EODP Component | # Survey Respondents | # Organizations Affected | % of Respondents | Average Percentage Increase |
|---|---|---|---|---|---|
| Increased export revenue | Skills development | 237 | 7 | 3.0% | 26.7% |
| Business Planning | 90 | 7 | 7.8% | 15.9% |
Overall, the findings suggest that few organizations that undertake EODP projects are exporters, but for those that do export, the impact of an EODP project on export revenue can be significant.
Increased Profits
One hundred twenty-eight for-profit business entities completed the evaluation survey. The most common sectors of these businesses were manufacturing (27.3%); construction (12.5%); retail (11.7%); and arts, entertainment, and recreation (11.7%).
As illustrated in Exhibit 3.9 below, 94 firms (73% of for-profit respondents) indicated that profits increased from participating in EODP projects. This finding suggests that EODP has a positive impact on profits for a high percentage of firms that participate. Profits increased on average, 10.3% for firms that engaged in skills development projects, 13.1% for firms that engaged in access to capital projects, and 21.9% for firms that undertook business planning projects.
| Benefit | EODP Component | # Survey Respondents | # Organizations Affected | % of Respondents | Average Percentage Increase |
|---|---|---|---|---|---|
| Increased profits | Skills development | 237 | 59 | 24.9% | 10.3% |
| Access to Capital | 24 | 14 | 58.3% | 13.1% | |
| Business Planning | 90 | 21 | 23.3% | 21.9% |
A review of 15 significant EODP projects revealed that EODP funding allowed Quickmill in Peterborough to build more machinery; to be more flexible in the factory; and to be more effective in its service. It is expected that these improvements will allow Quickmill to generate more sales and profits.
Overall, approximately one-quarter to one-half of firms that undertake skills development, access to capital, and business planning projects experience an increase in profits. The profit increase appears to be largest when the business planning stream is engaged by firms.
Impacts on Human Resources and Employment Levels
As illustrated in Exhibit 3.10, for approximately 30-40% of organizations that responded to the survey, EODP projects resulted in employees being retained, or additional employees being hired. For instance, skills development projects, assisted 100 firms to retain 502 employees. A further analysis of the survey data revealed that one project resulted in 165 employees being retained. There were also 12 projects that resulted in 20 or more employees being retained. The survey revealed that the top three areas of skills training supported by EODP were information technology (30.7%), production/manufacturing (27.6%), and marketing (26.0%).
Access to capital projects also impacted positively on employment levels. These projects allowed twenty-nine percent of responding firms to hire additional employees. One hundred and four people were hired (2 full time; 12 part time; and 90 term positions).
Business planning projects also helped employees hire more workers. Twenty-six percent of firms that undertook business planning projects reported that the project directly led to them hiring additional employees. They reported an additional 105 employees due to business planning projects supported by EODP (67 full time; 20 part time; 18 term).
The youth internship component of EODP also impacted human resource levels at participating organizations. Information technology, marketing, and customer service were the most common roles for interns. Thirty-three percent of host organizations subsequently hired an intern. A total of 31 interns were hired (22 full time, 2 part time, and 7 term positions). Respondents also indicated that another 34 interns were subsequently hired by another organization in Eastern Ontario.
| Benefit | EODP Component | # Survey Respondents | # Organizations Affected | % of Respondents | # Hired or Retained | Full time | Part Time | Term |
|---|---|---|---|---|---|---|---|---|
| Helped to retain employees | Skills development | 237 | 100 | 42.2% | 502 | N/A | N/A | N/A |
| Hired additional staff | Access to Capital | 24 | 7 | 29.2% | 104 | 2 | 2 | 90 |
| Business Planning | 90 | 24 | 26.7% | 105 | 67 | 20 | 18 | |
| Youth hired by host organization | Youth Internship | 85 | 28 | 32.9% | 31 | 22 | 2 | 7 |
| Youth hired by another organization in Eastern Ontario | Youth Internship | 85 | 31 | 36.5% | 34 | N/A | N/A | N/A |
Overall, EODP skills development projects helped about 40% of organizations to retain employees. Roughly 3 in 10 organizations that received access to capital funding, conducted business planning, or hired youth interns, hired more staff.
General Improvements in Organizational Competitiveness
As illustrated in Exhibit 3.11 below, skills development, youth internships, and business planning had wide ranging impacts on the competitiveness of organizations. Overall, significant improvements in competitiveness appear to be most prevalent in the areas of undertaking new projects, expanded marketing activities/materials, and developing new products, processes, or services. Some EODP streams appear to be more likely to have significant impacts on particular areas than others. For instance youth internships appear to be more useful than skills development or business planning projects for organizations that wish to improve customer service. Overall, youth internships appear to have had significant impacts on for a relatively higher share of firms than skills development and business planning projects.
| Percentage of Organizations Indicating Project Impact Was Significant | ||||
|---|---|---|---|---|
| Competitiveness Criteria | Skills development | Youth Internships | Business Planning | Average |
| Improved customer service | 22.8% | 44.7% | 18.9% | 28.8% |
| Wider range of services | 17.7% | 30.6% | 18.9% | 22.4% |
| Increased hours of operation | 0.8% | 11.8% | 10.0% | 7.5% |
| Expanded business locations | 3.0% | 3.5% | 8.9% | 5.1% |
| Increased ability to accommodate more customers/clients | 18.6% | 25.9% | 23.3% | 22.6% |
| Expanded marketing activities/ marketing materials | 16.0% | 56.5% | 38.9% | 37.1% |
| Improved information management/ database management | 12.2% | 36.5% | 18.9% | 22.5% |
| Increased access to technology infrastructure | 10.5% | 14.1% | 7.8% | 10.8% |
| Undertook new projects | 20.3% | 62.4% | 41.1% | 41.3% |
| Developed new products, processes, or services | 19.4%% | 48.2% | 34.4% | 34.0% |
| Developed/updated training materials/ policies/procedures | 19.0% | 18.8% | 13.3% | 17.0% |
| Improved organizational planning | 13.1% | 23.5% | 32.2% | 22.9% |
| Average | 14.5% | 31.4% | 22.2% | 22.7% |
Stronger Communities
EODP assisted a number of community organizations and non-profits to accomplish goals that contributed toward a better quality of life in Eastern Ontario communities. Projects supported under the local initiatives and community capacity building components of EODP played key roles in these goals. The percentage of projects reported in the survey that contributed toward community goals are identified in Exhibit 3.12. Figures are based on responses for 143 local initiatives projects and 91 community capacity building projects.
| Percentage of Projects that Contributed Significantly | ||
|---|---|---|
| Community goals | Local Initiatives | Community Capacity Building |
| improved health services | 2.8% | 5.5% |
| improved public safety | 3.5% | 2.2% |
| cleaner environment | 5.6% | 7.7% |
| increased tourism | 24.5% | 19.8% |
| improved transportation infrastructure | 0.7% | 2.2% |
| better parks and recreation services | 11.2% | 15.4% |
| improved access to technology infrastructure | 2.1% | 2.2% |
| improved community access to educational opportunities | 11.9% | 9.9% |
| improved opportunities to develop job skills | 18.2% | 13.2% |
| lower unemployment levels | 6.3% | 3.3% |
| job creation | 7.7% | 8.8% |
| economic diversification | 7.7% | 9.9% |
| business retention | 6.3% | 11.0% |
| attracting investment to communities | 12.6% | 16.5% |
| improved community planning | 11.2% | 18.7% |
The figures in Exhibit 3.12 above suggest that local initiatives and community capacity building projects most often had significant impacts on increasing tourism, improved community planning, and attracting investment to the community.
Incrementality
EODP appears to have had a fairly significant and positive impact on the behaviour of organizations and firms (Exhibit 3.13). Case studies and interviews with stakeholders suggested that EODP was often the first source of funding secured for projects, and assisted organizations in leveraging additional funding from other sources. For instance, EODP was the first program to fund the Town of Georgina's efforts to bring broadband Internet access to the community. An investment of $75K by EODP has since leveraged $1.1M of funds for broadband.
The evaluation survey revealed that the behaviour of organizations to undertake projects in all streams of EODP are positively influenced. Overall, only 3.8% of organizations reported that they would have proceeded with their project in the same manner if EODP funding had been unavailable. EODP funding would appear to be very influential for organizations hosting interns and undertaking local initiatives projects.
| Impact If EODP Funding Unavailable | |||
|---|---|---|---|
| Note: percentages do not add to 100, due to some respondents leaving the question unanswered. | |||
| Would have proceeded in the same manner | Proceeded with reduced scale | Would have not proceeded | |
| Local Initiatives | 0.7% | 36.4% | 44.1% |
| Community Capacity Building | 3.3% | 37.4% | 40.7% |
| Skills Development | 7.6% | 40.9% | 24.1% |
| Youth Internship | 2.4% | 27.1% | 64.7% |
| Access to Capital | 4.2% | 41.7% | 41.7% |
| Business Planning | 4.4% | 35.6% | 42.2% |
| Average | 3.8% | 36.5% | 42.9% |
Wider Impacts
Although EODP has encouraged a number of organizations to undertake projects that have contributed to their competitiveness, the program's success in creating wider impacts in its communities is not clear. Program funding, after all, is relatively small compared with the economies of the communities in question. The survey responses of organizations that received EODP funding suggest that the overall competitiveness of their communities has changed little in the three years since EODP was launched. As illustrated in Exhibit 3.14 below, although communities appear to have made some progress in employment opportunities and in attracting tourists, a significant portion of respondents do not agree that progress has been made in making their community more attractive to investors, improving transportation infrastructure and technology infrastructure, and attracting people to reside in the community.
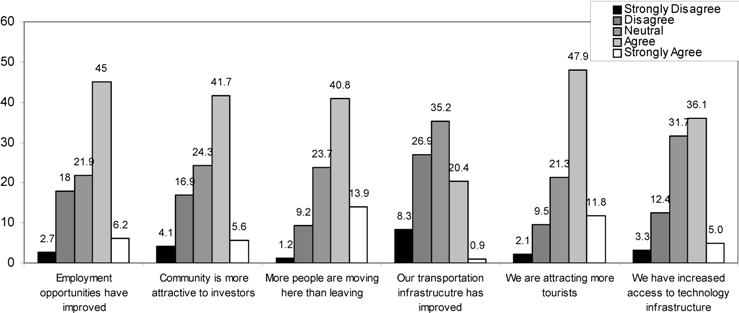
3.3.5 To what degree has EODP contributed to sustainable socio-economic development in rural Eastern Ontario?
Finding 11: At a local level based on qualitative analysis, EODP has assisted every CFDC catchment area to improve socio-economic conditions.
Through the qualitative data gathered during the study, CFDCs can identify EODP projects that have contributed toward social and economic sustainability in their community. There have been improvements in business skills, opportunities created for youth, business plans developed that should lead to economic gains, capital upgrades for businesses and non-profits, and local/community initiatives that improve social conditions. A key impact of these projects has been in the area of community development, specifically improved access to health care, improved infrastructure, and environmental clean up.
Given that EODP injects approximately $10M per year into the rural Eastern Ontario economy, while the Eastern Ontario annual income base is approximately $31B, the Program's impacts may simply be too small to influence macro economic indicators.
3.4 Performance Measurement
3.4.1 Is appropriate performance information being collected, captured, safeguarded and used? Is data quality being assured?
Finding 12: The evaluation found that data are being collected that are consistent with the RMAF developed in October 2006, and provided to FedNor in aggregate. Many of the RMAF indicators and the data being collected do not provide information on the performance of EODP however. The data is primarily focused on outputs rather than outcomes. No performance targets exist to measure the extent to which outcomes are being achieved.
To address this evaluation issue, a thorough review of the database was undertaken with a view to identifying gaps and opportunities for improving the collection of performance information. As well, documents were reviewed to determine the extent to which the data collected addresses the indicators identified in the EODP RMAF. Finally, CFDC and FedNor representatives were asked to comment on the adequacy of the data being collected, and how the data are used and safeguarded.
The indicators required by the 2006 EODP RMAF are presented as Appendix K. The evaluation found that CFDCs have been collecting data for these indicators (via secondary recipients) for round 3 (2006-2007).
The EODP database contains performance information for outputs, except for data on the number of applications, which was supplied from another source. The database also contains data for immediate outcome indicators associated with projects undertaken with Round 3 funding. FedNor holds back the final payment to CFDCs until they submit a final report. Many CFDCs reported that they use this approach with secondary recipients to ensure that data are captured for all projects. A large majority of the CFDCs interviewed feel that the data quality is adequate.
In terms of how the data are used, only two CFDC respondents indicated that they use the data in a strategic way. Some indicated that they collect the data because they want to be sure the project recipient did what they said they would. Most collect and report the data because it is a requirement under their agreement with FedNor, but they do not use it themselves. Interestingly, a similar diverse set of views was found among FedNor respondents. While one respondent indicated that they use the data, most said that it was largely used for communication and reporting purposes with Treasury Board (e.g., program renewal) and other stakeholders. Data do not appear to be widely used to manage the program (e.g., assess relative effectiveness of program components, resource allocation decisions).
Some opportunities for improvement suggested by both FedNor and CFDC respondents include more follow-up (e.g., with youth interns), more narrative reporting, and the collection of indicators that would speak to the impact on the community as a whole (perhaps through an indicator of how the project relates to the community's strategic plan).
Upon review of the database, the evaluation found that the data currently being collected does not provide an adequate picture of the performance of the program. The data being collected largely focuses on program outputs, rather than desired changes in the community (outcomes). In addition to a focus on collecting data on outputs rather than outcomes, the evaluation found the following shortcomings to the current approach of performance measurement:
- Lack of information on specific projects at the secondary recipient level. While the databases provide aggregate information on projects (which may be dissected according to CFDC), specific projects are not identified. As well the amount of EODP funding allocated to individual projects is not easily generated, and the use of the funds by project recipients is not captured systematically in a database.
- Lack of qualitative data linked to quantitative data. The database files do not contain qualitative data (such as narrative descriptions of the activities in which secondary recipients have engaged and the results/impacts of those activities). Qualitative data exist in a WordPerfect file but this is difficult to link to the quantitative file and also varies in detail and type of information provided.
- Inconsistent use of performance targets and lack of tracking. The Funding Proposal Guide for CFDCs does include a requirement for targets. However, while some CFDCs report against specific targets (e.g., number of projects to be funded, amount of funding to be allocated), many do not. Moreover, these data related to targets do not appear to be collated or tracked by FedNor.
- Data captured in regional profiles could be improved. FedNor commissioned work from Statistics Canada to prepare a regional profile for each CFDC catchment area. These regional profiles were developed in November 2006 and were largely based on 2001 Census data (as well as some data for other years, including manufacturing statistics from 2003, population statistics and income sources from 2004, data on establishments from 2005). They serve as a useful baseline measure since the first round of EODF funding was available in October 2004. However, additional data that would be useful to capture in this report could include the number of new businesses created, number of new jobs created, tourism statistics (number of visits, tourism dollars, spin-offs), if possible.
Recommendation #3 — Outcome indicators need to be revised and targets aggregated. Data on these indicators (and progress towards targets) should be collected and tracked by CFDCs and reported to FedNor within established reporting cycles to allow for aggregation. Qualitative data should also be collected and linked to quantitative data. (Qualitative data might include: extent to which an outcome is achieved, perceived quality of outputs, mitigating factors or challenges where outcomes not achieved, extent to which an outcome was exceeded.) It is recommended that qualitative input be coded and fields created so that findings can be rolled up and analyzed. FedNor should continue to further incorporate performance data into the management of EODP.
3.5 Alternatives, Cost-Effectiveness and Lessons Learned
3.5.1 Are there any overlaps with other government programs? Is FedNor collaborating with other departments and governments to reduce overlaps?
Finding 13: While there are many other government programs offered at the federal and provincial levels, EODP is somewhat unique. The local level decision-making, assistance with project design, and overall flexibility of the program are characteristics that set EODP apart from other programs. The large extent of leveraging and frequent involvement of partners in projects are both indicative of collaboration between FedNor, CFDCs and other departments and governments.
To support the findings for this question, the documents and database were reviewed for evidence of collaboration. As well, research into the most commonly cited similar or complementary programs was also undertaken. Finally, opinions of key informants were also considered.
While the documents forwarded by FedNor do not in themselves contain evidence of collaboration with other federal departments or governments (e.g., minutes from meetings), the database reveals extensive leveraging from other public (and private) sources. In interviews, CFDC and FedNor representatives explained that it is part of their role and responsibility to help project applicants seek out and apply for funding from other programs. As well, CFDC and FedNor representatives explained that in many cases, funding applicants are encouraged to undertake projects in partnership with other community players (e.g., municipalities, associations, Chambers of Commerce, private sector firms).
EODP is considered by practically all key informants to be complementary to other programs. In fact, EODP is seen by most key informants as a catalyst, largely due to the small amounts of money available per project and the role of many CFDCs in their respective communities to help organizations locate funding and partners for their projects. It was also mentioned by a few respondents that having a small amount of EODP funding facilitates accessing funding from other sources (i.e., leveraging).
Appendix L presents a detailed examination of the most commonly mentioned programs identified by respondents as being complementary or similar. Key programs include:
- The Rural Economic Development (RED) Program (Ontario)
- Business Retention and Expansion (BR+E) Program (part of the RED Program) (Ontario)
- First Impressions Community Exchange Program (part of the RED Program) (Ontario)
- Canada-Ontario Infrastructure Program (including the Ontario Small Town and Rural Development Infrastructure Initiative – OSTAR, Millennium Partnerships Program) (Federal-Ontario)
- Canada-Ontario Municipal Rural Infrastructure Fund (COMRIF) (Federal-Ontario)
- Ontario Trillium Foundation (Ontario)
- Industry Partnership Proposal Program (IPPP) (Ontario)
None of the programs cited above or in the Appendix have the breadth of EODP. Instead, each of the programs above is relevant to only to one or two components of EODP, making EODP unique in that it offers funding in six broad areas. Moreover, the unique, hands-on local assistance provided by CFDCs enables project applicants to seek out the EODP funding envelope most appropriate for them. The local decision-making (also a unique EODP feature) further ensures that projects are being undertaken that meet the needs of the community (based on predetermined criteria developed by each CFDC).
As evidenced in the Appendix, EODP has, by far, the smallest budget of all the programs listed above. It also appears that there are several programs that aim to improve community infrastructure and develop skills.
3.5.2 Are the most appropriate and efficient means being used to achieve objectives, relative to alternative design and delivery approaches?
Finding 14: The evaluation found that the current design and delivery approach is appropriate to contribute to the achievement of the program's objectives. In addition, the delivery approach is considered to be efficient due to its grassroots approach to identifying, selecting and administering projects.
The literature on regional economic development identified several best practices in regional economic development that are not part of the EODP design. In particular, priority should be placed on assisting firms that export, firms that offer a substitute for products or services that are currently imported, firms that pay high wages, and firms with strong supplier links.
To respond to this question, a literature review was conducted to identify best practices in the design of regional economic development interventions. These best practices were then reviewed within the context of the document review, which explains the original basis for the program's design and delivery approach. Finally, opinions of key informants were also considered to validate the findings from the first two lines of evidence.
The literature review revealed some important features inherent to effective regional economic development programs. First, effective regional economic development programs focus on helping and attracting firms that export internationally or at the very least, beyond local borders (i.e., provincial or state). Firms that are export focused tend to bring outside money into the community, whereas non-exporting firms that receive assistance, often prosper at the expense of local competitors who may not have received assistance. Furthermore, firms that offer substitutes for products or services that are currently being imported should also be targeted for assistance.
Second, effective programs place priority on assisting firms that pay high wages since they tend to be more effective in increasing local retailer demand. In addition, firms with strong local supplier links should also be targeted first, as local suppliers will benefit when these firms prosper.
Exhibit 3.18 presents these issues, along with the extent to which EODP responds to these "best practices."
| # | Best Practice | EODP Characteristics |
|---|---|---|
| a. Source: Evaluating the Impacts of Local Economic Development Policies on Local Economic Outcomes: What Has Been Done and What is Doable? Timothy J. Bartik, W.E. Upjohn Institute for Employment Research, 2002. b. Source: Eastern Ontario Opportunity Action Plan, Natural Capital Resources Inc., 2005 | ||
| 1 | There should be a focus on assisting firms that focus on exports, those that substitute for imports, those with strong local supplier links, and those in industries with relatively higher wages. (a) | Based on a review of program documentation and interviews with CFDC representatives, it is apparent that these criteria are not considered in project selection. |
| 2 | Assisting non-export base firms can increase local wealth if such assistance leads to an increase in usage of land or labour that would otherwise be unemployable (a) | Access to Capital and Local Initiatives projects can be used to increase the use of land. Youth Retention and Attraction can assist unemployed youth labour. |
| 3 | There should be focus on improving productivity of local firms (improved technology, processes, or skills) (a) Connectivity is now seen as basic infrastructure for virtually all sectors, including both public and private. (b) | Improved technology is an outcome of the program, although outcome results are limited (there is no longer a project component that targets technology projects specifically). Improved skills development and improved business development are both desired outcomes of the program and have program components directly related to them. |
| 4 | Communities that cannot supply the workforce needed for large plants must focus instead on attracting or growing smaller firms. (b) | EODP components related to business planning, youth retention and attraction, and skills development directly assist existing businesses to grow. Components that improve the community's capacity for economic development are intended to attract new firms. Also, Access to Capital projects are intended to attract and grow new firms (e.g., retrofits). |
| 5 | Employers should be encouraged to fill vacancies with local unemployed or underemployed labour (a) | The Youth Internship component contributes to this as it matches local under- or unemployed youth with employers. The Skills Development component encourages business management skills training and network development, labour market skills development and development of sector specific training services. However, the component is only available to existing employees and thus does not target unemployed or underemployed labour. |
| 6 | Financing programs should be targeted at businesses whose behaviour is likely to be affected, such as businesses with good alternative locations, or businesses unlikely to receive normal bank financing (a) | The RMAF cites the Access to Capital component focuses on the expansion of the capital base of CFDCs to provide investment in local small- and medium-sized businesses (SMEs) and the establishment of pooled investment fund models to support higher risk loan and equity applications from SMEs. |
| 7 | Local economic development programs need to include customized training programs that can effectively serve the needs of two types of clients, the business community and the unemployed (a) | The Skills Development component supports customized training that meets the needs of the organizations applying for funding. The training is limited to existing employees and not available to the unemployed. |
| 8 | In order to attract and retain businesses, the Eastern Ontario region should be branded. (b) | Regional projects funded by EODP are undertaken and are a possible vehicle for regional branding. However, regional project design and scoping is not adequately inclusive of other partners to successfully develop or build a regional brand. |
| 9 | Private businesses, educational institutions, and community organizations are among the groups that should be involved in local economic development, because of the special support they can provide to local economic development efforts (a) (b) | All organizations of this type are eligible for EODP funding. Also, CFDCs encourage (but do not require) the use of partnerships and leveraging in projects to maximize the participation of at least two community players in each project. |
Based on the comparison in the Exhibit above, EODP meets many of the best practices. Areas where the best practice is not met and where opportunities for improvement to the design and delivery are suggested include:
- Focus on exporters, firms that substitute for imports, firms with strong local supplier links, and firms in industries with relatively higher wages;
- Re-revisit selection criteria to include priority for projects that improve technology and processes (a specific program component looking at this area no longer exists); and,
Recommendation #4 — FedNor should encourage CFDCs to target their private sector funding to exporters, firms that substitute for imports, and firms with strong local supplier links. Given the current program objectives, projects that address technology should also be encouraged.
Overall, the evaluation concluded that EODP is an effective program that is contributing to economic and social development in rural Eastern Ontario businesses, organizations and communities. There is a need however, for better alignment between the stated objectives of the EODP and its current funding level and funding cycle (i.e. annual).
Recommendation #5 — Should funding levels and funding cycles (i.e., annual) remain unchanged, FedNor should revisit the objectives of the EODP to more closely align with what is realistically achievable.
In terms of the appropriateness of the choice to have CFDCs deliver the program, the document review revealed that CFDCs were chosen in response to an upcoming review regarding the broadening and deepening of the mandate of CFDCs in areas where there is not a regional development agencyFootnote 11. Moreover, it was stated in program documentation that Ontario CFDCs were an existing mechanism that, through a program evaluation in 2003, had been assessed as relevant, successful and cost-effective with the potential to accomplish more given increased resources. In addition, the documentation went on to explain that experience had demonstrated that CFDCs can be effective in implementing regional economic development initiatives, where resources are available.
Consistent with this thinking, the current design and delivery approach for EODP is strongly supported by most key informants. While some adjustments (see Section 3.1.2) are acknowledged as beneficial by many respondents, there was no desire expressed for a significant redesign of the program or the delivery approach.
3.5.3 What is the value for money (VFM) of EODP?
Finding 15: The evaluation found that EODP uses funding efficiently. The extent to which the program offers good value for money, and is cost effective (as measured by cost per outcome) is difficult to determine because adequate performance information on outcomes is not being collected.
Lines of evidence contributing to this conclusion include interviews with key informants, the database, the literature review, and the document review.
EODP is considered by most FedNor and CFDC respondents to use funding efficiently due to the fact that it: 1) builds on an existing infrastructure (CFDCs) funded by another program (Community Futures); 2) utilizes volunteers on Boards of Directors in the selection of projects; and 3) enables some CFDCs to access funding via youth internships to staff the EODP coordinator position.
Without adequate data on outcomes achieved, the extent to which EODP offers good value for money (as measured by cost per outcome) is challenging to determine. Costs for certain outputs and outcomes are provided below in Exhibit 3.19.
| Component | Cost per indicator/ outcome (Rounds 1 and 2) | Cost per indicator/ outcome (Round 3) |
|---|---|---|
| Note: Denominator based on the value of the secondary recipients generated as opposed to the value of the projects | ||
| Business Planning | not collected | $3,887 / business plan |
| Youth Retention & Attraction | not collected | $9,644 / youth placed |
| $23,833 / youth with ongoing employment in Eastern Ontario (1) | $16,512 / youth with ongoing employment in Eastern Ontario (1) | |
| Access to Capital | not collected | $37,405 / business created/expanded |
| not collected | $5,828 / full time and term jobs created/ maintained | |
| Skills Development | $219 / person trained | $310 / person trained |
| Community Capacity Building and Local Initiatives | $1,502 / community organization partner (1) | $2,636 / community organization partner (1) |
| not collected | $26,114 / organizational plan | |
Leveraged dollars may also be used as a basis for determining value for money. FedNor's definition of leveraging (taken from the CF Quarterly report guidelines) is "the total dollar value of investments from sources other than the owner(s) made as a direct result of the investment made by the CFDC."
As illustrated earlier in Exhibit 3.13, EODP appears to have had a fairly significant and positive impact on the ability to proceed with projects and leverage additional funds. Case studies and interviews with stakeholders suggested that EODP was often the first source of funding secured for projects, and assisted organizations in leveraging additional funding from other sources. The evaluation survey revealed that only 3.8% of organizations reported that they would have proceeded with their project in the same manner if EODP funding had been unavailable. Thus, EODP funding would appear to influence organizations to undertake projects.
However, a review of the database (illustrated in Exhibit 3.20) reveals that EODP's contribution (of the overall project budget) can be quite small (particularly for regional projects, access to capital projects, and community capacity building projects). While key informants indicated that EODP plays a catalytic role in project development, in cases where EODP funding represented a small share of the overall project budget, it is questionable that projects would not have proceeded without EODP funding.
| Source: EODP Database | ||||||||||
|---|---|---|---|---|---|---|---|---|---|---|
| ($ in 000s) | 2004-2006 ( EODF) | 2006-2007 ( EODP) | ||||||||
| Component | Total Budget | $ value of investment from other sources | % Other sources | $ value of investment from EODP | % EODP | Total Budget | $ value of investment from other sources | % Other sources | $ value of investment from EODP | % EODP |
| Technology Infrastructure | $ 315 | $ 185 | 59% | $ 130 | 41% | NA | NA | NA | NA | NA |
| Business Planning | $ 1,537 | $ 825 | 54% | $ 712 | 46% | $ 720 | $ 352 | 49% | $ 368 | 51% |
| Local Initiatives | $ 8,807 | $ 6,111 | 69% | $ 2,696 | 31% | $ 4,324 | $ 2,901 | 67% | $ 1,424 | 31% |
| Community Capacity Building | $ 17,408 | $ 14,265 | 82% | $ 3,143 | 18% | $ 7,627 | $ 5,597 | 73% | $ 2,031 | 27% |
| Youth Retention & Attraction | $ 4,363 | $ 1,682 | 39% | $ 2,681 | 61% | $ 2,678 | $ 1,489 | 56% | $ 1,189 | 44% |
| Regional Projects | $ 9,880 | $ 8,578 | 87% | $ 1,302 | 13% | $ 101,067 | $ 100,116 | 99% | $ 951 | 1% |
| Access to Capital | $ 22,646 | $ 19,549 | 86% | $ 3,097 | 14% | $ 9,088 | $ 7,480 | 82% | $ 1,608 | 18% |
| Skills Development | $ 7,347 | $ 4,266 | 58% | $ 3,082 | 42% | $ 3,199 | $ 2,075 | 65% | $ 1,124 | 35% |
| Total | $ 72,304 | $ 55,460 | 77% | $ 16,844 | 23% | $ 128,704 | $ 120,009 | 93% | $ 8,694 | 7% |
3.5.4 What lessons have been learned from EODP?
Finding 16: There have been three main lessons learned to date. The EODP would have been more effective to date 1) had FedNor played a greater role in managing the program, 2) had there been an organization to promote development in Eastern Ontario, and 3) had multi-year project funding been available.
The lines of evidence contributing to these conclusions included information obtained from key informant interviews with CFDC respondents, stakeholders and unsuccessful applicants.
The evaluation revealed that the effectiveness of EODP has been reduced somewhat by the absence of a coordinating organization to promote development in Eastern Ontario communities. The EODP Network provides some support in this regard, but the organization is not mature enough at this point to be fully effective.
The evaluation found that many stakeholders feel that FedNor has taken a less direct management approach to EODP, which has reduced the effectiveness of the program. For example, advice on strategic approaches to economic development and community capacity building, and direction and input on regional project planning, scoping, and design would have been welcomed.
Key informants stated that the effectiveness of EODP has been reduced by the inability to support multi-year projects. Single year funding has worked against a strategic, long term approach to addressing community challenges. Stakeholders claimed that had this type of funding been available, there would also have been better promotion of the program, better relationship and partnership-building, and simplified reporting and claims processing.
3.5.5 How do the delivery approaches of EODP compare to those of FedNor's other regional development programs and other Regional Development Agencies?
Finding 17: The Northern Ontario Development Program (NODP) is the most comparable program to EODP. There are some aspects to the delivery of EODP that are more attractive than for NODP, such as a bottom up approach to regional development, and the selection of projects at a local level.
Evidence gathered in response to this question came largely from documents (e.g., Northern Ontario Development Fund (NODF) evaluation report) and interviews with FedNor and CFDC representatives.
The NODP, a FedNor program delivered in Northern Ontario, was the most commonly cited program for comparison. According to the NODP website, program contributions are available to support projects in six areas: community economic development; innovation; information and communications technology; trade and tourism; human capital; and business financing. The program's budget is considerably larger than that for EODP. In 2005-2006, the NODP program budget was $57.9 million and in 2006-2007, the budget was $36.9 million. EODP's budget, by contrast is about $10 million per year.
FedNor interviewees communicated that NODP is quite different from EODP, highlighting the fact that for NODP, FedNor contracts directly with project recipients whereas for EODP, FedNor contracts with CFDCs, who in turn, contract with third party recipients. Furthermore, FedNor provides advice and input on projects for NODP, but do not provide this advice for the EODP.
The evaluation of NODF revealed some weaknesses in that program that have been avoided in the EODP delivery model. Specifically, some CFDC's noted there was a lack of awareness of NODF in some communities, and slow turnaround times for proposals and claims processing. The recommendations for NODF included some design characteristics that EODP currently possesses: CFDCs should be given direct funding and more discretion on funding of projects; increase the local presence of FedNor program officers and provide greater consistency with respect to what ideas do / do not get approved; and, economic development priorities should be more bottom-up.
There was some discussion around the programs offered by regional development agencies including Western Economic Diversification (WD), Atlantic Canada Opportunities Agency (ACOA), and Canada Economic Development for Quebec Regions (CEDQ). Generally, key informants did not feel that EODP was comparable as it administers a smaller budget and it was believed by most to have a unique, grassroots delivery approach via the CFDCs.
3.6 Other Issues
3.6.1 To what extent is EODP meeting the requirements of Section 41 of the Official Languages Act?
Finding 18: The Program is meeting the requirements of Section 41 of the Official Languages Act and is providing services of equal quality in both official languages in the requisite communities.
Lines of evidence contributing to this issue were case studies; funding recipients, who indicated whether they had access to services in both official languages; interviews with federal government officials; and documents from EODP, which indicate the program's bilingual requirements.
Five of 15 CFDC managers reported that their CFDCs provide advice, service and support to secondary recipients in both English and French, thus exceeding the requirement set out for EODP that three of the CFDCs provide services of equal quality in both official languages. Additionally, EODP has met the requirements of Section 41 of the Official Languages Act according to FedNor representatives, who indicate that support for initiatives has been broad based and available to linguistic minority communities. However, only one CFDC manager indicated that she consulted the official-language minority community within her service area to ascertain its economic-development needs. Furthermore, there is no indication that Program officials are ensuring that communications with the public are in both official languages (in accordance with the requirements of Part IV of the Official Languages Act), although all significant project proponents and unsuccessful applicants who responded to questions related to language of service indicated that they received services in their official language of choice. (Among the funding recipients who served as key informants for this evaluation, only one required services in French. This informant's linguistic needs were successfully met by the program.)
3.6.2 To what extent is EODP contributing to the strategic outcomes laid out in Industry Canada's Sustainable Development Strategy (2006-2007)?
Finding 19: Several projects supported secondary recipients in the renewable energy sector; however, only one supported the development or commercialization of environmental technologies and/or products. Additionally, while many CFDCs indicated that they had conducted procedural screening for environmental sustainable practices where appropriate, only one funding recipient documented sustainability and corporate social responsibility practices.
Lines of evidence contributing to this finding include the opinions of key informants; the description of significant projects by funding recipients; case studies; the database; the survey; and client-provided project descriptions.
Industry Canada's Sustainable Development Strategy commits the Department to pursuing initiatives that will contribute to three strategic outcomes, of which the following two are applicable to EODP: 1) Sustainability-driven technologies and commercialization: Increased development, commercialization, adoption and diffusion of environmental, energy and bio-based technologies; and 2) Sustainability tools, practices, research and awareness: Increased use by firms, industries and institutions of sustainability and corporate social responsibility practices, and increased consumer awareness of sustainability issues.
Four projects were conducted in the renewable energy sector. The survey found that while many CFDCs indicated that they had conducted procedural screening for environmental sustainable practices where appropriate, only one funding recipient documented sustainability and corporate social responsibility practices – in this case, lean-manufacturing practices.
3.6.3 To what extent have the recommendations (and management response) of the Formative Evaluation been implemented?
Finding 20: Where accepted by the management response, generally, the recommendations of the Formative Evaluation of the EODF have been implemented or have begun to be implemented.
Evidence was gathered from the documents provided by the program as well as via interviews with FedNor and CFDC representatives.
Exhibit 3.21 presents the extent to which recommendations have been implemented as articulated in a FedNor-generated status report. Additional findings from the evaluation are presented in the table.
| Recommendation | Findings from Final Evaluation |
|---|---|
| 1. The five program priorities should continue to form the basis of EODF programming. These encompass current priority needs and are broad enough to address evolving economic development needs. | The five priority areas identified in the formative evaluation were: business development, access to capital, skills development, retention and attraction of youth, and technological enhancements. These five areas do not appear in the Terms and Conditions per se, but are reflected in the six program objectives: enhanced technology infrastructure and innovation; improved community capacity and response to economic development opportunities and challenges; improved business and trade skills; improved SMEs access to capital and leveraged capital; attraction, retention and development of human capital, including special client groups; improved competitiveness through retention and expansion of existing businesses and new business startups. |
| 2. The EODF should continue to use the existing delivery model which involves FedNor contribution agreements with each of the 15 CFDCs who, in turn, provide funding to secondary recipients. | The EODP has retained the existing delivery model and continues to have 15 CFDCs as primary recipients, and the Eastern Ontario CFDC Network Inc. |
| 3. The CFDCs should continue to use a multitude of promotional tools to ensure that their communities are appropriately aware of the EODF. However, promotional strategies should consider the limited availability of EODF funds. | The one-year renewals still result in short time frames for promotion and delivery of the program. Feedback from CFDC representatives revealed a myriad of promotional methods being used to promote the program. |
| 4. While the promotional efforts of the CFDCs have been fruitful, a process should be implemented to ensure that promotional materials are shared and to thus avoid duplication of efforts and build on best practices. | Documents revealed the existence of a communications strategy that includes a regionally-based web site for collective marketing and a secure website in place to share best practices as a group. While mechanisms may exist, they are not well known by CFDCs (e.g., only one CFDC indicated they share using the Internet). CFDCs mostly cite regional meetings and informal communications between CFDCs as the primary mechanisms for sharing promotional materials. |
| 5. The current project selection process for small local initiatives does not need to change. However, since CFDCs have implemented different processes for the review and selection of projects, the different processes should be shared among CFDCs to help in the sharing of best practices and lessons learned. | The secure website, mentioned in the management response, was not mentioned by any respondent as a mechanism for sharing best practices. CFDCs and FedNor indicated sharing happens at CFDC meetings and informally. Some indicated that there is more work to be done in this area. |
| 6. The project selection process for regional projects needs to be clearly defined and agreed upon by FedNor and the CFDCs. This should include a clear definition of the scope of regional projects. It could also include a series of outcomes that are regional in nature. The improved project selection process should, however, continue to involve consultations with other regional economic development stakeholders with respect to needs for regional EODF projects. | While most CFDC and FedNor respondents acknowledge that a great deal of work has been done in the area and that improvements have been made, most feel that there is more work to be done. In particular, there are concerns about how projects are defined (i.e., what constitutes a regional project?), identified (i.e., put forward by Boards as opposed to openly promoted to the public), the extent to which francophone projects can be selected, the fact that the current process can be divisive and result in CFDCs lobbying other CFDCs for their votes. |
| 7. The current project selection criteria should not change. | No additional comments. |
| 8. Notwithstanding other recommendations, FedNor should continue to provide the same level and type of support to CFDCs and to ensure that adequate resources are allocated to provide this support. | Feedback from CFDCs was generally positive regarding FedNor support, although additional assistance related to certain topics (e.g., conflict of interest) would be appreciated. |
| 9. FedNor should continue to improve its performance measurement system with respect to the EODF. This should include updating the RMAF in consultation with the 15 CFDCs to ensure that they are in agreement with the commitments outlined in this document. It should also include revising the reporting structure to ensure that it is consistent with the program's structure as well as the RMAF indicators. | A new system was implemented that corresponds with the RMAF developed in October 2006. While new indicators were identified in the RMAF and are currently being collected, there are some opportunities for improvement. These are fully articulated in Section 3.4.1. |
| 10. Once the performance reporting requirements are finalized, FedNor should give due consideration to providing CFDCs with more effective tools for reporting. This could include the grants module of The Exceptional Assistant (TEA). | Two CFDCs are currently piloting the TEA grants module. One CFDC commented that it is a very effective tool and would like to see it rolled out to all CFDCs. New reporting templates were circulated to CFDCs with the new indicators to be collected. |
| 11. FedNor and the CFDCs should monitor the appropriateness of the operational budgets for the EODF. It is important to ensure that, with the continuation of the program, the burden on FedNor and CFDC staff is not unreasonable. It is also important to ensure that the program requirements do not conflict with other FedNor and CFDC staff priorities. | CFDCs sign a separate contribution agreement for the administrative dollars they spend on EODP. Most CFDCs feel that, while there is an additional administrative burden to some extent, overall this has increased monitoring and transparency. One FedNor respondent said that there could be additional clarifications and consistency around what is claimed as operational expenses. |
| 12. CFDCs should continue to require that, where possible, additional sources of funding be sought by the secondary recipients. | No additional comments. |
| 13. FedNor should consider the feasibility of putting in place a process to have only one contribution agreement with each of the 15 CFDCs. | Management did not agree with this recommendation. Not applicable for final evaluation. |
| 14. FedNor should consider implementing a risk-based approach for its monitoring and reporting strategy. This should be integrated in the considerations for Recommendation 10. | Each CFDC is assigned a risk rating by the CFDC officer. Claim processors follow this risk matrix to identify which proportion of claims require follow-up. Most key informants from both CFDCs and FedNor indicate there has been improvement in this area. |
Footnotes
- 9 Source: FP Markets – Canadian Demographics 2004 and 2007, Financial Post. (back to footnote reference 9)
- 10 Eastern Ontario Community Future Development Corporations, Slide Deck Presentation. (back to footnote reference 10)
- 11 FedNor's service area extends only to Northern Ontario. (back to footnote reference 11)
4.0 Conclusions
This section concludes on the relevance; design and delivery; results; performance; and alternatives for the EODP.
4.1 Relevance
Needs vary across communities in Eastern Ontario, however the top five most significant and pervasive needs were related to a loss of manufacturing jobs (once a large source of employment); out migration by youth; a lack of employment opportunities in general; ageing/inadequate physical infrastructure, and support for tourism efforts. The evaluation concluded that EODP is a relevant program to address these needs. For each significant community need, there is at least one (and often several) EODP funding stream that can be accessed.
4.2 Design and Delivery
The evaluation concluded that the strength of the EODP design is the use of CFDCs to administer the program, due to their intimate local knowledge. The evaluation also concluded that the selection processes used by CFDCs are effective and appropriate. FedNor is playing an adequate role in the management of EODP, however, there are opportunities for FedNor to bring its economic development knowledge to EODP, particularly in the designing and scoping of community capacity building and regional projects.
There are opportunities for improvement, however. The short term nature (i.e., annual) nature of funding discourages strategic and long term projects that would likely be more effective in addressing community challenges. The program currently spreads a relatively small amount of funding across six components, each supporting very different activities and objectives. This approach may be limiting the progress that the program can achieve toward any one of the objectives. Furthermore, the program allocates equal funding across all CFDCs. This approach fails to recognize that some communities likely have a greater capacity to absorb funding and/or have more pressing economic and social challenges than others. The selection of regional projects has been and continues to be problematic. The process is complicated and encourages undesirable voting behaviour by committee members.
4.3 Results
Determining the extent to which EODP has made progress toward achieving its outcomes is challenging due to challenges related to the performance measurement strategy. Nevertheless, the evaluation concluded that EODP projects have positively impacted businesses, organizations, and communities. Many projects have helped businesses expand; increase sales, exports, and profits; and be more competitive in general. Projects have helped retain and hire employees, and helped youth find employment in the region. Many projects have strengthened communities by supporting the efforts of non-profit organizations, by supporting tourism efforts, and by investing in physical and social infrastructure.
The evaluation concluded that EODP has a catalytic effect on the behaviour of organizations and communities. EODP is often the first program to fund a project and acts as a lever for additional investment from other programs. Although impacts are obvious to those that participate in EODP projects, the small size of the program limits its visibility in communities and its influence on the economy of the region in general. Statistics suggest that as a whole, the 15 catchment areas have fallen further behind the provincial average since the establishment of EODP.
4.4 Performance Measurement
The program is regularly collecting, communicating, and reporting data from projects. Most of the data being collected is focussed on program outputs rather than outcomes, and is not helpful in measuring program performance. The program has not aggregated or tracked targets against which progress toward objectives can be measured.
4.5 Alternatives, Cost Effectiveness, and Lessons Learned
The evaluation examined a number of regional economic development programs and concluded that EODP is rather unique. The flexibility of the program and the local level decision making and assistance with project design conducted by CFDCs set EODP apart from other programs. The program appears to be cost effective in the sense that most projects reviewed by evaluators created impacts with relatively small investments. Furthermore, the program positively influenced the behaviour of businesses and non-profit organizations, namely to engage in activities that they would otherwise not carry out.
Some fundamental characteristics of effective regional economic development programs, are absent from EODP, however. The criteria for selecting projects does not acknowledge the important role that exporters, firms with strong local supplier links, firms that substitute for imports, and firms that pay relatively high wages, can play in regional economic development. Additionally, projects that improve technology and processes are not being specifically targeted.
Overall, the evaluation concluded that EODP is an effective program that is contributing to economic and social development in rural Eastern Ontario in businesses, organizations and communities. There is a need however, for better alignment between the stated objectives of the EODP and its funding level and funding cycle (i.e., annual). If the overall objective really is to promote socio-economic development in rural Eastern Ontario, then the program's current design and funding levels are inadequate. If the objective of EODP is more modest, and the program is intended to make a small contribution toward improved social and economic conditions in Eastern Ontario, then the program is adequate in its present form, but its stated objective needs to reflect this reality.
Management Response to Recommendations in the 2007 Final Evaluation of the Eastern Ontario Development Program
Recommendation #1 — Consideration should be given to revisiting the EODP funding formula for allocations to CFDCs, so that capacity and socio-economic variables play a role in the allocation of funding. Also, CFDCs should have increased flexibility for allocating funding to secondary recipients among the program components according to the local strategic priorities.
Response: Agreed. The funding formula will be revisited within the context of the development of the long-term plan outlining the economic development needs and the nature of programming required for Eastern Ontario. To be completed by March 31, 2009.
Recommendation #2 — FedNor should continue to work with the CFDCs to improve the process for identification, design and approval of regional and sub-regional projects and should play a more proactive role in this process.
Response: Agreed. FedNor is currently providing guidance to the EODP Regional Project Review Committee whose mandate is to exchange ideas on ways to improve the process for identification, design and approval of regional and sub-regional projects. To be completed immediately.
Recommendation #3 — Outcome indicators need to be revised and targets aggregated. Data on these indicators (and progress towards targets) should be collected and tracked by CFDCs and reported to FedNor within established reporting cycles to allow for aggregation. Qualitative data should also be collected and linked to quantitative data. (Qualitative data might include: extent to which an outcome is achieved, perceived quality of outputs, mitigating factors or challenges where outcomes not achieved, extent to which an outcome was exceeded.) It is recommended that qualitative input be coded and fields created so that findings can be aggregated and analyzed. FedNor should continue to further incorporate performance data into the management of EODP.
Response: Agreed. The CFDC Final Report has been revised to collect more outcome data and qualitative data with coded fields. The appropriateness and practicality of establishing aggregated targets for the program will be assessed in the context of a longer-term strategy for future program renewals. Performance data will be aggregated and presented to FedNor management to improve management of EODP. To be completed immediately.
Recommendation #4 — FedNor should encourage CFDCs to target their private sector funding to exporters, firms that substitute for imports, and firms with strong local supplier links. Given the current program objectives, projects that address technology should also be encouraged.
Response: Agreed. FedNor will encourage CFDCs to target their private sector funding to exporters, firms that substitute for imports, and firms with strong local supplier links. Projects that address technological enhancements will also be encouraged. To be completed immediately.
Recommendation #5 — Should funding levels and funding cycles (i.e., annual) remain unchanged, FedNor should revisit the objectives of the EODP to more closely align with what is realistically achievable.
Response: Agreed, and to be completed in conjunction with the development of options for a longer-term strategy (see #1). To be completed by March 31, 2009.
Chart 1: Eastern Ontario Development Program Logic Model
The chart is titled: Eastern Ontario Development Program Logic Model. Along the left side there are five labels, in descending order they are: Activities, Outputs, Immediate Outcomes, Intermediate Outcome, Ultimate Outcome.
Left of the first heading, Activities, are three boxes: "Facilitating and Coordinating Partnerships and Networks", "Providing Non-Financial Support to CFDCs and Communities, and Others", and "Providing Funding to CFDCs and their Network." These three boxes point together to the next box below. It is left of the "Outputs" heading. The box is labelled "Contribution Agreements and Funding ‘Primary Recipients’" and it points right to a box labelled "Contribution Agreements and Funding ‘Secondary Recipients’". These two boxes point together at five more boxes below, left of the Immediate Outcomes heading.. They are, listed left to right, "Enhanced Technology Infrastructure and Innovation", "Improved Business Development and Community Capacity for Socio-Economic Development", "Improved Skills Development", "Attraction, Retention, and Development of Youth", and "Improved Access to Capital and Leveraged Capital". These five sections point together to a box left of the Intermediate Outcome heading labelled "Improved Competitiveness, Community and Sector Sustainability." That points to a final box next to the Ultimate Outcome heading entitled "Long Term Sustainable Socio-Economic Development in Rural Eastern Ontario."
Exhibit 3.3 — Funding recipient satisfaction with CFDC funding provisions
This shows a bar chart displaying the Funding Satisfaction with CFDC Funding Provisions. For each category there are three choices: Very/somewhat satisfied, Neither satisfied nor dissatisfied, and Very/somewhat dissatisfied.
The first category is titled "Overall level of service (n=171)" and the bars are 94% Very/somewhat satisfied, 1% Neither satisfied nor dissatisfied, and 5% Very/somewhat dissatisfied. The next category is "Guidance on completing reports" and is listed as 88% Very/somewhat satisfied, 5% Neither satisfied nor dissatisfied, and 7% Very/somewhat dissatisfied. The next category is "Fairness of application decisions (n=164)" and is listed as 89% Very/somewhat satisfied, 5% Neither satisfied nor dissatisfied, and 6% Very/somewhat dissatisfied. The next category is "Guidance on completing applications (n=168)" and is listed as 89% Very/somewhat satisfied, 5% Neither satisfied nor dissatisfied, and 6% Very/somewhat dissatisfied. The next category is "Quality of advice provided (n=167)" and is listed as 90% Very/somewhat satisfied, 4% Neither satisfied nor dissatisfied, and 6% Very/somewhat dissatisfied. The next category is "Timeliness of funding payments (n=173)" and is listed as 90% Very/somewhat satisfied, 2% Neither satisfied nor dissatisfied, and 8% Very/somewhat dissatisfied. The next category is "Notice of application decisions (n=174)" and is listed as 91% Very/somewhat satisfied, 3% Neither satisfied nor dissatisfied, and 6% Very/somewhat dissatisfied. The next category is "Response time to requests (n=170)" and is listed as 92% Very/somewhat satisfied, 2% Neither satisfied nor dissatisfied, and 6% Very/somewhat dissatisfied. The final category is titled "Service in language of choice (n=148)" and is listed as 93% Very/somewhat satisfied, 2% Neither satisfied nor dissatisfied, and 5% Very/somewhat dissatisfied.
Exhibit 3.14 — Percentage of Survey Respondents Agreeing with Statements on Community Progress in Last Three Years
This is a bar chart showing "Percentage of Survey Respondents Agreeing with Statements on Community Progress in Last Three Years" To each statement there are five possible responses: Strongly Disagree, Disagree, Neutral, Agree, and Strongly Agree.
The first statement was "Employment opportunities have improved," and the results were 2.7% Strongly Disagree, 18% Disagree, 21.9 Neutral, 45% Agree, and 6.2% Strongly Agree. The next statement was "Community is more attractive to investors" and the results were 4.1% Strongly Disagree, 16.9% Disagree, 24.3 Neutral, 47.1% Agree, and 5.6% Strongly Agree. The next statement was "More people are moving here than leaving" and the results were 1.2% Strongly Disagree, 9.2% Disagree, 23.7 Neutral, 40.8% Agree, and 13.9% Strongly Agree. The next statement was "Our transportation infrastructure has improved" and the results were 8.3% Strongly Disagree, 26.9% Disagree, 35 Neutral, 20.4% Agree, and 0.9% Strongly Agree. The next statement was "We are attracting more tourists" and the results were 2.1% Strongly Disagree, 9.5% Disagree, 21.3 Neutral, 47.9% Agree, and 11.8% Strongly Agree. The final statement was "We have increased access to technology infrastructure" and the results were 3.3% Strongly Disagree, 12.4% Disagree, 31.7 Neutral, 36.1% Agree, and 5.0% Strongly Agree.