
Audit and Evaluation Branch
Industry Canada
January 2006
Final Report
Tabled and approved by DAEC on
Table of Contents
- Executive Summary
- 1.0 Introduction
- 2.0 Methodology
- 3.0 Findings–Relevance
- 4.0 Findings–Staff Support
- 4.1 Are project clients satisfied with counselling, advice, training or workshops
- 4.2 Is FedNor providing appropriate support and follow-up to project representatives?
- 4.3 How many objectives have been achieved in the Service Improvement Plan?
- 4.4 Is staff support being provided in the official language of choice?
- 4.5 Conclusions–Staff Support
- 5.0 Findings–Success
- 5.1 Has FedNor contributed to the development and retention of new and existing businesses?
- 5.2 Has FedNor improved competitiveness of Northern Ontario firms?
- 5.3 Has FedNor helped attract, retain and develop human capital, including special client groups (women, Francophones, First Nations and other Aboriginal people, youth)?
- 5.4 Has FedNor contributed to the economic development of Northern Ontario communities?
- 5.5 Has FedNor helped develop business and trade skills?
- 5.6 Has FedNor helped develop external markets for Northern Ontario firms?
- 5.7 Has FedNor increased the use of technology? Has contributed to the development of innovation?
- 5.8 What is the incremental impact of FedNor programs and projects?
- 5.9 Conclusions–Success
- 6.0 Findings–Monitoring and Accountability
- 6.1 Is reporting timely, reliable and complete?
- 6.2 Are program data reports providing FedNor useful information for management purposes and to guide future program decisions?
- 6.3 Is the reporting system allowing FedNor to demonstrate the outputs and outcomes of its programs and thereby to meet accountability requirements?
- 6.4 Conclusions–Monitoring and Accountability
- 7.0 Findings–Alternatives, Cost-Effectiveness and Lessons Learned
- 7.1 Are there alternative service delivery approaches that would increase the cost-effectiveness of FedNor programming?
- 7.2 What lessons have been learned from FedNor programming for the future?
- 7.3 Are FedNor programs being developed and delivered considering the needs of official language minority communities (OLMCs)?
- 7.4 Conclusions–Alternatives, Cost-Effectiveness and Lessons Learned
- 8.0 Conclusions and Recommendations
- Management Response or
(PDF version (22 KB, 7 pages)
Executive Summary
Introduction
The Federal Economic Development Initiative in Northern Ontario (FedNor) was established in 1987 to promote business development and economic diversification in Northern Ontario. Currently, FedNor is responsible for the delivery of the Northern Ontario Development Fund (NODF) or the FedNor Program which promotes economic growth, diversification, job creation and sustainable self-reliant communities in Northern Ontario through a range of initiatives aimed at improving small business access to capital, information and markets; the Community Futures (CF) Program which supports the development and growth of rural Ontario communities; the Eastern Ontario Development Fund which supports economic renewal in rural Eastern Ontario; and, a new funding initiative to support the Social Economy throughout Ontario.
Over the past several years the NODF resources have varied from year to year. In 2002-03 fiscal year (FY), the grants and contribution and operating budgets totalled $60.4 million compared to $53.4 million in 2003–04, $49.0 million in 2004–05 and $57.9 million in 2005-06.
The NODF was subject to a formative evaluation in 2002. A commitment was made to complete a summative evaluation of the NODF in accordance with FedNor's Results-based Management and Accountability Framework (RMAF).
This summative evaluation of the NODF covered three fiscal years (2002-03 to 2004-05) based on data collected as at the end of August 2005. The evaluation involved a series of research questions related to the broader issues of relevance, staff support, success, monitoring and accountability, as well as alternatives, cost-effectiveness and lessons learned.
For more details, please refer to Section 1.0 of this report.
Methodology
The evaluation relied on a range of approaches to ensure that each issue was addressed using multiple lines of evidence. The study methodology included:
- a document review;
- review / analysis of a wide range of existing NODF data;
- analysis of the results of the Service Improvement Initiative surveys, conducted in 2002 (with 100 clients) and again in 2005 (with 151 clients) using survey questions from the Common Measurements Tool (CMT);
- a total of 71 in-depth telephone or in-person interviews with Industry Canada (IC) / FedNor management (5), staff (20), Community Futures Development Corporations (CFDCs) representatives (13) and other stakeholders (33);
- a telephone survey with 200 project funding recipients; and,
- nine project-related case studies involving a review of case-related documents and interviews with various individuals involved in the case.
Overall the approaches and sample sizes used for this evaluation resulted in a strong and reliable summative evaluation, which provided evidence to conclude on all issues. However, it should be noted that no interviews were completed with unsuccessful applicants because all had either been approved at some time by FedNor or could not be located.
For more details, please refer to Section 2.0 of this report.
Findings – Relevance
Overall, the evaluation findings demonstrate that there is an ongoing need for NODF programming and that the projects are relevant. There is a wealth of documentary evidence related to the ongoing economic development needs of Northern Ontario and the challenges faced by Northern communities. The NODF project data illustrates that the program is relevant to a wide range of needs (as demonstrated by the wide range of types of projects funded). Additionally, the profile of the funded organizations demonstrates that the NODF is reaching a diverse group of organizations. The program's relevance was also confirmed through the interviews, where FedNor management, staff and stakeholders all agreed that the projects were relevant in particular because of FedNor's presence in the community and its understanding of local needs. Finally, the recipient survey and case studies provided additional evidence of the program's relevance. The survey results showed that NODF's strategic priorities (telecommunications and ICT, innovation and technology, trade and tourism, human capital, business financing support and community economic development) were extremely important and that FedNor was able to address needs related to those priorities through the NODF. The case studies also provided specific examples of how NODF projects are linked to local economic development needs.
For more details, please refer to Section 3.0 of this report.
Findings – Staff Support
The evidence collected during this evaluation shows that clients are satisfied with the counselling, advice, training and workshops provided by FedNor staff. The great majority (86%) of clients have received counselling or advice and report that they have or will use this advice (97% of those who received counselling / advice). Additionally, while a small proportion (21%) of clients have received training or attended a workshop, the great majority of those clients have or will use what they learned (91%).
In general, the evidence from the interviews, survey and case studies shows that staff provide a lot of support at the project development phase. Staff help organizations refine their projects to better meet NODF requirements; they also help these organizations identify other sources of funding. This support is much appreciated, as evidenced by the high levels of client satisfaction with this (average of 8.7 out of 10). Additionally, clients provided direct evidence of having benefited from this support. However, FedNor management and staff interviewees indicated that monitoring and follow-up was fairly limited. Nevertheless, the services provided by Payments and Monitoring were deemed important and useful.
The evidence gathered shows that FedNor has been successful in making significant progress in four of the five priorities outlined in its Service Improvement Initiative plan.Footnote 1 That is, clients are satisfied with the overall application or proposal assessment process, the payment and monitoring process and the FedNor communications with clients. Additionally, the turnaround time on proposals has been reduced by 29% (from 16.1 weeks in 2001/02 to 11.4 weeks in 2004/05) resulting in a 10% increase in client satisfaction (from an average of 3.4 out of 5 in 2002 to 3.8 in 2005). However, FedNor has been less successful in reducing the turnaround time on payments (increase from 45.42 days in 2001/02 to 57.13 days in 2004/05). Nevertheless, client satisfaction with the payment process has increased slightly albeit not statistically significantly (mean of 3.9 out of 5 in 2005 up from 3.6 in 2002).Footnote 2
For more details, please refer to Section 4.0 of this report.
Findings – Success
The evaluation results show that FedNor has achieved all of the NODF intended outcomes. In some cases, FedNor has been extremely successful, in other cases it has achieved success indirectly, while in other cases it has been only slightly successful, mostly due to the fact that it has funded few projects in those areas. The following highlights some of the key NODF results:
- FedNor has contributed to the development of new businesses and the retention of existing businesses directly through projects and indirectly through the CFDCs capitalization fund, the Credit Union Loan Loss Reserve and the BDC Loan Loss Reserve. Based on CFDCs reports, 1,293 businesses have been assisted (488 new ones) resulting in 6,401 jobs created or maintained. Based on the survey results, at least 124 new businesses were created through direct NODF project assistance resulting in at least 470 jobs created.
- FedNor has also contributed indirectly to the improved competitiveness of Northern Ontario firms by helping them grow (increased revenues of close to $200 thousand for the private sector organizations receiving NODF funding; 55% indicating some other type of growth, such as employment, new services and new capabilities) or develop innovative products, processes or services (71% of private sector firms surveyed).
- FedNor has helped attract, retain and develop human capital directly through 347 human capital projects which target youth (98%), Aboriginal people (12%), Francophones (6%), and / or women (1%). While interviewees generally believe that FedNor's contribution is mostly through the Youth Internship Program, the survey of recipients shows that FedNor's contribution is broader than this. That is, 49% of surveyed recipients indicated that their project had resulted in the attraction of new staff, 39% in the retention of existing staff and / or 53% in the development of existing staff. Only 23% did not involve any human capital impacts.
- Community economic development (CED) is seen to be a key area of NODF success. The data shows that 80% of projects involved community capacity outcomes (close to $100 million in authorized assistance). Interviewees saw FedNor's ability to encourage and build partnerships with a variety of players as a major advantage in strengthening community economic development. The case studies showed direct evidence of CED projects contributing to increasing economic activity in communities. Finally, the survey provided direct evidence of the attraction of more than $1 billion in investments, more than 100 new businesses and dozens of new institutions.Footnote 3
- FedNor has contributed to the development of business and trade skills as evidenced by 43% of surveyed recipients indicating that their projects has resulted in this. However, interviewees had a difficult time describing FedNor's contribution to this and none of the case studies were directly related to this.
- FedNor has contributed less extensively to the development of external markets through direct project funding as well as through the trade missions and other work in this area.
- FedNor has also contributed significantly to increased use of technology and to the development of innovation, as demonstrated through 62 innovation and technology projects (representing close to $25 million in authorized assistance) and other projects resulting in FedNor increasing the number of rural and remote communities with access to high speed Internet and cellular telephone service. Based on the interview, survey and case study evidence, these have resulted in significant socio-economic benefits to the communities involved.
These results are highly attributable to NODF funding. A large proportion of projects would not have gone ahead without FedNor assistance whereas most other projects would have been affected in quality, timing or scope. Additionally, while FedNor cannot necessarily take the full credit for leveraged funds, a contribution of $122 million over the three year period covered by this evaluation has resulted in total project investments of close to $400 million.
For more details, please refer to Section 5.0 of this report.
Findings – Monitoring and Accountability
FedNor has made significant progress in terms of monitoring and accountability. The evidence gathered during this evaluation highlights progress in planning for results and in capturing more complete performance information. However, the interviewees identified some challenges related to monitoring and accountability; most of these challenges were confirmed through the data analysis activities. The key problem lies in the project outcomes and evaluation scoresheets which are completed by the project officers at the end of each project. Project officers are meeting the requirements of completing the forms. However, these forms have not been updated to reflect program changes. Additionally, the forms are completed to varying degrees of accuracy. There are also issues with linking this and other monitoring and accountability tools to the requirements outlined in the program's recent RMAF.
For more details, please refer to Section 6.0 of this report.
Findings – Alternatives, Cost-Effectiveness and Lessons Learned
This evaluation confirmed the findings of the 2002 formative evaluation study of FedNor. Evidence of cost-effectiveness stems from all sources. The data shows that FedNor contributes as little as 1% of the total costs of projects and as much as 100% of the project costs. For every dollar invested by FedNor, another $2.28 are invested by others. There was general consensus among interviewees that there was no other service delivery approach that could work better than the NODF approach. Nevertheless, a range of suggestions were made for increasing cost-effectiveness. The survey results showed that:
- There are other comparable sources of funding available in Northern Ontario (for example, Northern Ontario Heritage Fund) – 47% of surveyed recipients were aware of comparable programs.
- The NODF is effective – as reported under success, it has been effective in achieving its intended outcomes and is incremental to the ability of organizations to undertake the projects.
- The NODF is cost-effective – in its ability to leverage funds as well as in the fact that many (40%) recipients would not have been able to undertake the project if they had received less NODF funding, and those who could (37%) indicated that the lower funding would have affected the effectiveness of their projects in that the timing, quality or scope of the projects would have been affected.
A wide range of lessons learned were provided by the interviewees, survey recipients and case studies. Most of these were suggestions for improvement and are incorporated into the conclusions and recommendations in the next section of this executive summary.
FedNor has been diligent in providing services in the official language of choice. However, it has made less progress in integrating the needs of official language minority communities into its programming. Nevertheless, there is evidence that there has been specific activity in this regard and that progress with respect to this will be evident in the near term.
For more details, please refer to Section 7.0 of this report.
top of pageConclusions and Recommendations
| Conclusions | Recommendations |
|---|---|
| Relevance | |
Conclusion 1 The economy of Northern Ontario continues to struggle with economic development issues. NODF strategic priorities are relevant and adapted to these economic development issues. Additionally, the projects are relevant in their objectives and meet the criteria established by FedNor. The key aspects of NODF which make the program particularly relevant are:
| Recommendation 1 FedNor should continue to adapt the NODF to the changing economic development needs of Northern Ontario. In particular, it should continue to develop strategic approaches that address pan-Northern and / or sectoral needs. |
| Staff Support | |
Conclusion 2 The role of FedNor staff, in particular of program officers, is critical to the successful planning, development and implementation of projects. There are several key aspects with respect to staff support that contribute to this success:
However, there are concerns with some aspects of the support provided in terms of project implementation, monitoring and follow-up. These concerns include:
| Recommendation 2 FedNor should ensure that program officers are aware of the extent of their roles and responsibilities, and that they recognize the areas where flexibility is required versus the areas where consistency is needed. This could be done through more frequent communications via various policy bulletins, training, meetings and other forms of communications amongst program officers as well as between officers and management. Recommendation 3 FedNor should assess the workload distribution of program officers in terms of the time they spend on NODF project planning activities, project implementation and monitoring activities, and project follow-up activities. This assessment should also examine the time spent on other non-NODF activities and tasks. Based on the result of this assessment, FedNor should make the appropriate adjustments, as required, to ensure an appropriate balance in the time spent on these tasks. |
Conclusion 3 All priorities outlined in the Service Improvement Initiative plan have been successfully addressed except with respect to the turnaround time on payments. However, the turnaround time on payments is no longer assessed as being a service improvement priority, from the clients' perspective. This is due to the fact that clients are slightly more satisfied with FedNor's performance on this and they do not believe this to be as important a service feature as it was in earlier years. | Recommendation 4 FedNor should continue to monitor various aspects of its services and to adapt its service improvement priorities as required. The recommendations included in the 2004/05 Service Improvement Initiative report are still relevant in that, not much improvement can be achieved in terms of client satisfaction. Nevertheless, client expectations could be better managed through the establishment of published service standards. |
| Success | |
Conclusion 4 A number of NODF projects have contributed to the development and retention of new and existing businesses. Evidence suggests that NODF projects have resulted in the development of new businesses, jobs and growth in existing businesses through retained and new employees as well as increased revenues. In addition, Northern Ontario CFDCs have indirectly contributed to NODF success in this regard through the impacts of the NODF capitalization assistance. The reported impacts from this assistance include close to 500 new, more than 500 maintained and close to 350 expanded business. Northern CFDC support, resulting at least partially from NODF assistance, have also contributed to the creation of more than 2,100 job and the maintenance of almost 4,300 jobs. The program is therefore contributing to the development and retention of new and existing businesses, both directly and indirectly. | Recommendation 5 FedNor should continue to address the economic development needs of Northern Ontario through its broad range of strategic priorities as these are contributing to the wide ranging impacts of the NODF. |
Conclusion 5 The NODF's contribution to the competitiveness of Northern Ontario firms is, in most cases, indirect through the Community Futures top-up and the BDC investment fund. Nevertheless, the NODF also contributes directly to this objective through its trade networks and missions as well as through projects involving the development of new or improved products, services or technologies. | |
Conclusion 6 The NODF has been successful in attracting, retaining and developing human capital in Northern Ontario. With respect to special target groups, the program has made a significant impact on youth, women, Aboriginal people and Francophones even though the projects did not necessarily target these groups. | |
Conclusion 7 The NODF has made a significant contribution to economic development in Northern Ontario through community level initiatives as well as, to some extent, sectoral initiatives. FedNor's ability to encourage and build partnerships is a major contributor to the program's success in this area. | Recommendation 6 FedNor should keep the requirement for high involvement of other partners and communities in the NODF funded projects as these are also important to the success of the projects and program. Recommendation 7 FedNor should also enhance its support of sectoral initiatives as these are important to the economic development of Northern Ontario communities. |
Conclusion 8 Based on the evidence available for this evaluation, it is difficult to conclude on the extent to which the NODF has helped develop business and trade skills. However, the survey results and case studies indicate that the NODF has made a contribution in this area. | |
Conclusion 9 Based on the activities in support of developing external markets, the NODF has made progress in this regard. Progress has been made as a result of project-specific activities such as trade missions. Progress has also been made as a result of support provided by the trade advisors as well as through other non project-specific activities and support. | |
Conclusion 10 As a result of the projects funded under the Telecommunications and ICT as well as Innovation and Technology strategic priorities, the NODF has contributed to significant investments in this area. These investments have reached a large proportion of communities and businesses in Northern Ontario resulting in increased use of technology and the development of innovations. This has, in turn, contributed to socio-economic benefits in recipient organizations and communities. | |
Conclusion 11 The NODF has been essential in enabling a large number of organizations to undertake the funded projects. As such, the project impacts are highly attributable to the program. In addition, the design features have contributed to high leveraging of funds from other sources. Over the period of the evaluation, $122 million of NODF funding has resulted in a total of $400 million in investments in the projects. FedNor is therefore recognized as a catalyst for economic development. | Recommendation 8 FedNor should continue its practice of appropriately balancing its requirements that NODF funding be incremental to the recipient organization's ability to undertake the projects as well as requiring an appropriate level of leveraging on projects. |
| Monitoring and Accountability | |
Conclusion 12 FedNor has improved its capacity in terms of planning for results. For example, the recent Results-based Management and Accountability Framework (RMAF) is providing management with a better tool for measuring performance. The planning process is more closely linked to the NODF's performance management requirements. FedNor has also invested more resources into this, as evidenced by staff which are dedicated to performance monitoring. Additionally, FedNor has undertaken special studies to review specific aspects of the program (for example, the Youth Internship Program and post evaluations of trade missions). With respect to projects, officers are meeting their requirements in terms of assessing project risk and completing the project outcomes scoresheets. Additionally, with respect to the program as a whole, there is evidence of a lot of analysis and reporting of the data that is currently available. However, the RMAF does not fully reflect the present design and delivery of the NODF. The existing tools and systems have not been updated to reflect the performance measurement requirements outlined in the recent RMAF. Additionally, it is unclear if the information collected from the project outcomes scoresheets is valid and reliable. It is also unclear if program officers clearly understand how to complete the scoresheets. The departmental systems for capturing and analyzing project information remains poorly aligned with NODF requirements. Finally, the departmental system is not aligned with the project outcomes scoresheets. Therefore, it is difficult to clearly determine the extent to which projects are achieving their intended outcomes. | Recommendation 9 FedNor should further refine the NODF RMAF to more accurately reflect the program priorities. The performance reporting systems and tools should also be refined to meet the requirements outlined in the RMAF. In brief, the NODF RMAF would benefit from the following enhancements: 1. A closer integration of the logic model with the expected results, which are priority driven. 2. An integrated performance measurement and evaluation strategy which:
The revised RMAF should feed directly into the revisions of existing tools and systems as well as the development of new tools and systems as required. For example, the outcomes captured on NODF projects in the departmental system should match the outcomes in the RMAF. This is not presently the case. For example, the database captures community capacity, connectedness, e-commerce, export, knowledge-based, tourism and trade outcomes. These are currently not directly linked with neither the program priorities nor the outcomes identified in the program logic model. Similarly, what is measured in the project outcomes scoresheet is not reflective of the logic model outcomes nor of the indicators in the performance measurement plan. Specific instructions on how to specifically complete the project outcomes scoresheets as well as on what is required from the program officer to ensure that the ratings in the scoresheet are reliable must be developed and a means for ensuring data quality and integrity needs to be implemented. |
Conclusion 13 The Industry Canada departmental systems (i.e. the Grants and Contribution Reporting System – GCRS which draws upon the information in the Contribution Management Information System – CMIS) to capture information on projects is inadequate to meet the monitoring and accountability requirements of FedNor with respect to the NODF. It currently does not provide the flexibility required to capture the intended and actual results of projects as outlined in the program's RMAF. Additionally, since RMAFs are intended to be “living” documents, program results can change over time, particularly for a program such as the NODF. The Industry Canada departmental system is not currently flexible enough to provide FedNor with the ability to adjust the fields in the database as the program evolves to better reflect the changing needs of Northern Ontario communities. | Recommendation 10 FedNor should consult with Audit and Evaluation Branch (AEB) and the Information Management Branch (IMB) which is responsible for GCRS and CMIS to ensure that the departmental systems provide FedNor management with the flexibility it requires to appropriately capture the performance information it needs to better meet its monitoring and accountability requirements. If the required flexibility cannot be incorporated into the existing / new system, then FedNor should discuss other options with AEB and IMB regarding linking the FedNor system to ensure that all monitoring and accountability information can be captured and linked without requiring duplication. |
| Alternatives, Cost-effectiveness and Lessons Learned | |
Conclusion 14 There are currently no alternative service delivery approaches for the NODF that would produce the same results at a lower cost. Currently, a significant proportion of the project costs are leveraged through other sources. FedNor collaborates extensively with other organizations to ensure that NODF funding complements rather than duplicates the contributions of these other sources of funding. The due diligence exercised by the program officers and program management to ensure that NODF cost-effective investments in Northern Ontario (i.e., the right level of funding and the right leveraging for strategically needed projects) is very comprehensive and effective. Additionally, a large proportion of clients would not proceed with their projects if lower levels of funding were provided by FedNor. It is therefore evident that FedNor is managing NODF costs appropriately. The projects are contributing to the achievement of their intended outcomes. It is therefore evident that the NODF is effective in achieving success. Overall, the program is therefore managed in a cost-effective fashion. | See recommendations 5 to 8 under Success. |
Conclusion 15 The critical success factors of the NODF are its flexibility, its staff, the partnerships it helps develop and its local presence. | See recommendations 1 to 8 under Relevance, Staff Support and Success. |
Conclusion 16 FedNor's strategic focus is key to its continued relevance. This includes the need for specific strategies to address sectoral needs (including natural resources). Additionally, a means of ensuring that clients are aware of the NODF's strategies would also be beneficial. | See recommendations 1 and 7 under Relevance and Success. Recommendation 11 The new group responsible for gathering market intelligence for FedNor and helping to develop strategies in light of this market intelligence should take due consideration of this lesson learned. |
Conclusion 17 Ongoing staff development is critical to the NODF's continued success. This includes training as required, means of ensuring that best practices (and lessons learned) are shared, clear roles and responsibilities. This will lead to more consistency in dealing with clients. | See recommendation 2 under Staff Support. Recommendation 12 FedNor should continue to have regular organization-wide or strategically driven events aimed at sharing best practices and lessons learned. |
Conclusion 18 The Northern Ontario Community Futures Development Corporations believe they should be more involved in the delivery of some of the NODF programming, in particular, in the trade missions that affect their clients and, possibly in other aspects of projects. | Recommendation 13 While there are currently no alternative service delivery approaches for the NODF, FedNor should further explore the possibilities of involving 3rd parties more extensively in the delivery of the NODF to ensure that it continues to maximize its cost-efficiency. Recommendation 14 FedNor should ensure that, to the extent feasible, all Northern Ontario CFDCs are invited to participate in its NODF trade missions, particularly if clients in their delivery region are participating. |
Conclusion 19 The Youth Internship Program may benefit from increased flexibility, such as: permitting the overlap of interns where appropriate; longer term internships; as well as, the possibility of just an internship program rather than a youth internship program. | Recommendation 15 Recognizing that the Youth Internship Program has evolved extensively over time, as a result of ongoing monitoring of the effectiveness of this program, FedNor should further explore the implications of expanding the NODF Youth Internship Program. |
Conclusion 20 FedNor has been committed to providing services in both official languages. There is also evidence of significant activity by FedNor in consulting with official language minority communities (OLMC) to ensure that their needs are integrated into NODF programming. However, based on stakeholder perceptions as well as some of the program data, FedNor needs to continue to evolve to ensure that it meets the unique needs of OLMCs. | Recommendation 16 FedNor should continue to work towards integrating the needs of the OLMCs into its NODF programming. |
Footnotes
- 1 It is important to note that, while the Service Improvement Initiative was an issue in this evaluation, this initiative is not limited to the NODF but rather to all FedNor programming. As such, it involves analysis of more than just NODF data. (back to footnote reference 1)
- 2 For further information please see:
dnor.gc.ca/eic/site/fednor-fednor.nsf/eng/fn02286.html (back to footnote reference 2) - 3 These numbers should be interpreted with care since they are based on 1) a very small number of respondents (n=14) and 2) a wide range of responses (from as little as $1,000 to as high as $1 billion). (back to footnote reference 3)
1.0 Introduction
1.1 Introduction to the Study
The Federal Economic Development Initiative in Northern Ontario (FedNor) was established in 1987 to promote business development and economic diversification in Northern Ontario. Currently, FedNor is responsible for the delivery of the following programs:
- the Northern Ontario Development Fund (NODF) or the FedNor Program which promotes economic growth, diversification, job creation and sustainable self-reliant communities in Northern Ontario through a range of initiatives aimed at improving small business access to capital, information and markets;
- the Community Futures (CF) Program which supports the development and growth of rural Ontario communities;
- the Eastern Ontario Development Fund which supports economic renewal in rural Eastern Ontario; and,
- a new funding initiative to support the Social Economy throughout Ontario.
The NODF was subject to a formative evaluation in 2002. A commitment was made to complete a summative evaluation of the NODF in accordance with FedNor's Results-based Management and Accountability Framework (RMAF).
This summative evaluation of the NODF involved a series of research questions related to the broader issues of relevance, staff support, success, monitoring and accountability, as well as alternatives, cost-effectiveness and lessons learned.
1.2 NODF Profile4
FedNor's mission for Northern Ontario is to promote economic growth, diversification, job creation, and sustainable, self-reliant communities in Northern Ontario, by working with community partners and other organizations to improve small business access to capital, information, and markets.
Achieving this vision requires FedNor to help build a solid infrastructure in the areas of innovation and technology, telecommunications infrastructure and applications, trade and tourism, business financing support, human capital, and community economic development – to accelerate Northern Ontario's movement to a knowledge-based economy and build more globally competitive businesses through programming which focuses on:
- Connecting Northern Ontario by bringing Point of Presence (PoP) and high-speed Internet into every community and supporting Information and Communications Technologies (ICT) applications particularly in the areas of health, education and business;
- Adding value to the regional economy by commercializing knowledge, developing biotechnology and mining clusters, promoting a world class ecotourism industry, and establishing a mining innovation and telerobotics research centre;
- Exporting Northern Ontario goods and services with the development of US, European and interprovincial export markets;
- Jobs and business opportunities for Northern Ontario youth with support for youth entrepreneurship, internships and enhanced skills development opportunities in Northern Ontario educational institutions and businesses;
- Small and Medium Enterprises (SMEs) access to early-stage financing with enhanced access to patient and venture capital with more partners and leveraged capital; and,
- Strengthening the capacity of communities by supporting community-based planning projects, strategic plans, economic infrastructure and special assistance for economic adjustments.
The resources for the NODF are as per Table 1 which follows.
| 2002–03 | 2003–04 | 2004–05 | 2005–06 | |
|---|---|---|---|---|
| A-Base Funding (Grants & Contributions) | 47.3 | 41.3 | 37.7 | 38.4 |
| A-Base Funding (Operating) | 13.1 | 11.8 | 11.3 | 13.5 |
| Total NODF | 60.4 | 53.1 | 49 | 519 |
| Northern Ontario School of Medicine (one year investment) | 6 | |||
| Total | 60.4 | 53.1 | 49 | 57.9 |
1.3 Report Structure
Performance Management Network Inc. was contracted to undertake this summative evaluation of the NODF. This report addressed the summative evaluation issues included in the Results-based Management and Accountability Framework (RMAF) and Evaluation Plan and is organized as follows:
- Section 2 provides an overview of the methodology used to address the evaluation issues.
- Sections 3 to 7 describes the evaluation findings on issues of relevance, staff support, success, monitoring and accountability, and alternatives, cost-effectiveness and lessons learned.
- Section 8 summarizes the conclusions made throughout the report and provides FedNor management with recommendations for improvement.
A list of Steering Committee members is provided in Annex A. A list of documents reviewed is provided in Annex B. A sample of the interview guides is provided in Annex C and a list of interviewees in Annex D. A sample of the survey questionnaire is found in Annex E and the detailed survey tables in Annex F. Finally, the case study write-ups are provided in Annex G.
4 Source: RMAF for the FedNor Program – March 2005. (Return to reference 4)
2.0 Methodology
2.1 Evaluation Issues
Table 2 over the next several pages identifies the specific issues and how each of the approaches contributed to each issue.
2.2 Methodology
This summative evaluation of the NODF covered three fiscal years (2002–03 to 2004–05) based on data collected as at the end of August 2005 (hereinafter referred to as the period of the evaluation).
2.2.1 Document Review
A large number of documents were reviewed in the context of this summative evaluation. The document review served four key purposes:
- to help in familiarizing the evaluation team with the program and its environment and develop a better understanding of the issues and their context;
- to provide context into some of the issues;
- to minimize the extent to which initial data collection tasks duplicated previous studies; and,
- to provide direct evidence for some of the issues.
In this context, the types of documents which were reviewed included documents on the program and its environment, reports from other evaluation and / or special studies conducted on the NODF or some of its programs, and other documents provided by FedNor staff. A list of the documents reviewed is provided as Annex B.
2.2.2 Database Review
The database review involved 1,075 FedNor projects which were approved during the period of FY 2002–03 to FY 2004–05. Data on these projects was provided by FedNor and analysed to help in the sampling for the survey of recipients as well as in addressing specific evaluation issues.
The database review also included further analysis of previous survey databases developed in the context of FedNor's Service Improvement Initiative. That is, in 2002, a survey of 100 FedNor clients was undertaken in 2002. In follow-up to the 2002 survey, a second survey of 151 clients was conducted in 2005 with clients who had active projects in 2004. The same questionnaire was used both years and was based on the questions from the Common Measurements Tool (CMT), using the five point scale of the CMT.
| Evaluation Issues / Research Questions | Review of: | Interviews | Recip Survey | Case Studies | ||||
|---|---|---|---|---|---|---|---|---|
| Doc. | Data | IC | Non-Studies Recip | CFDC | Others | |||
Note :
| ||||||||
| Relevance | ||||||||
| 1. What evidence exists to show that projects are relevant (e.g., adapted to local economic development needs)? | M | M | M | M | M | M | H | H |
| 2. What is the degree of match between program selection criteria and actual projects? | M | M | L | M | M | |||
| Staff Support | ||||||||
| 3. Are project clients satisfied with counselling, advice, training or workshops provided? What evidence exists to support this statement? | H | M | H | H | M | |||
| 4.Is FedNor providing appropriate support and follow-up to project representatives? What evidence exists to support this statement? | M | M | H | H | M | |||
| 5. How many objectives have been achieved in the Service Improvement Plan? | M | H | L | |||||
| 6. Is staff support being provided in the official language of choice? Evidence? | M | M | M | H | ||||
| Success | ||||||||
| 7.Has FedNor contributed to the development and retention of new and existing businesses? | M | M | L | H | H | H | ||
| 8.Has FedNor improved competitiveness of Northern Ontario firms? Evidence in terms of improved revenues, profits, innovations? | L | M | L | H | H | H | ||
| 9. Has FedNor helped attract, retain and develop human capital, including special client groups (women, Francophones, First Nations and other Aboriginal people, youth)? Evidence? | M | M | L | H | H | H | ||
| 10.Has FedNor contributed to the economic development of Northern Ontario communities? Evidence? | M | M | L | H | H | H | ||
| 11.Has FedNor helped develop business and trade skills? Evidence? | M | M | L | H | H | H | ||
| 12.Has FedNor helped develop external markets for Northern Ontario firms? Evidence? | M | M | L | H | H | H | ||
| 13.Has FedNor increased the use of technology? Has contributed to the development of innovation? Evidence? | M | M | L | H | H | H | ||
| 14. What is the incremental impact of FedNor programs and projects? | M | L | H | H | H | H | H | |
| Monitoring and Accountability | ||||||||
| 15. Is reporting timely, reliable and complete? What evidence exists to support this statement? | M | H | M | M | M | |||
| 16.Are program data reports providing FedNor useful information for management purposes and to guide future program decisions? Evidence? | M | H | ||||||
| 17. Is the reporting system allowing FedNor to demonstrate the outputs and outcomes of its programs and thereby to meet accountability requirements? Evidence? | H | H | ||||||
| Alternatives, Cost-Effectiveness and Lessons Learned | ||||||||
| 18. Are there alternative service delivery approaches that would increase the cost-effectiveness of FedNor programming? | L | H | H | M | M | M | ||
| 19. What lessons have been learned from FedNor programming for the future? | M | M | L | M | H | |||
| 20. Are FedNor programs being developed and delivered considering the needs of official language minority communities (OLMCs)? Evidence? | H | M | M | |||||
2.2.3 Key Informant Interviews
A total of 71 in-depth telephone or in-person interviews were completed. The interview was scheduled at a time that was most convenient to the interviewee. In order to help in preparing for the interview, each person was sent the interview guide as soon as the interview was scheduled. The interview guides used are provided in Annex C.
Table 3 shows the distribution of interviewees by type. The list of interviewees is included in Annex D.
| Type of Interviewees | # of Interviews |
|---|---|
| IC / FedNor management | 5 |
| IC/ FedNor staff | 20 |
| CFDC representatives | 12 |
| Other stakeholders | 33 |
| Total | 71 |
2.2.4 Survey of Recipients
A telephone survey was completed with 200 project funding recipients. Based on the 1,075 projects that have been funded over the years included in the time frame of this summative evaluation, the survey provides results on the projects which are accurate to within plus or minus 6.3%, 19 times out of 20. However, since there are only 476 unique organizations that received funding, the survey results are accurate to within plus or minus 5.4%, 19 times out of 20 for the information gathered which is related to the funded organizations.
The survey covered the wide spectrum of types of projects and types of organizations, as shown in Table 4.
| Description | Actual Distribution | Survey Interviews Completed | ||
|---|---|---|---|---|
| # | % | # | % | |
| ||||
| Studies or Implementation | ||||
| Studies | 261 | 24% | 55 | 27% |
| Implementation | 814 | 76% | 145 | 73% |
| Geographic Distribution | ||||
| Northeastern | 250 | 48% | 99 | 49% |
| North central | 263 | 25% | 47 | 24% |
| Northwestern | 291 | 27% | 54 | 27% |
| Strategic Objectives | ||||
| Business financing support | 32 | 3% | 0 | 0% |
| Telecommunications and ICT | 84 | 8% | 13 | 7% |
| Innovation and technology | 62 | 6% | 12 | 6% |
| Trade and tourism | 134 | 12% | 29 | 14% |
| CED | 416 | 39% | 66 | 33% |
| Human capital | 347 | 32% | 80 | 40% |
| Type of Applicant | ||||
| SME | 54 | 5% | 23 | 12% |
| Educational | 78 | 7% | 12 | 6% |
| Non-profit | 563 | 52% | 104 | 14% |
| Municipalities | 178 | 17% | 33 | 33% |
| Aboriginal | 201 | 19% | 28 | 40% |
| Target GroupsFootnote * | ||||
| Youth | 376 | 35% | 89 | 12% |
| Women | 11 | 1% | 3 | 6% |
| Aboriginal | 206 | 19% | 32 | 52% |
| Francophone | 44 | 4% | 10 | 16% |
| Total | 1,075 | 100% | 200 | 14% |
Adjustments were made based on the pretest results. Following good research practice, the pretest questionnaires were not added to the survey database.
top of page2.2.5 Case Studies
In total, nine case studies were completed. The case studies involved a review of the relevant case-related documents provided by IC / FedNor, interviews with the IC / FedNor project officer, the project recipient and, for internships, some of the interns.
The case studies were selected to cover successful projects as well as projects that would help in the identification of lessons learned. They were selected to include projects from all regions, strategic objectives, as well as other profile characteristics. The cases are summarized in Table 5 on the following page.
Detailed case study write-ups are included in Annex G. These write-ups were forwarded to the people interviewed in the context of the case studies for verification and approval.
| Project Description | Region | Priority | ||
|---|---|---|---|---|
| Title | Organization | FedNor $ | ||
| Development of ultra-sensitive diagnostics for early detection of cancer | Genesis Genomics Inc. | $875,000 | North West | Innovation & Technology |
| Development of a marketing strategy and related marketing materials to attract potential businesses to Timmins | Timmins Economic Development Corp. | $105,000 | North Central | Community Economic Development |
| Youth interns to support the development of information technology products for the Sault Ste. Marie Innovation Centre | Sault Ste. Marie Innovation Centre | $50,000 | North Central | Human Capital |
| Development of new process for the use of flash animation technology of the animated television series “Chilly Beach” | March Entertainment Inc. | $500,000 | North East | Innovation & Technology |
| Installation of tele-medical equipment in Health Canada nursing stations and clinics in seven remote First Nations | Keewaytinook Okimakanak | $450,000 | North West | Telecommunications & ICT |
| Sault Ste. Marie 2003–2004 winter tourism promotion and advertising campaign to overcome effects of SARS | Sault Ste. Marie Economic Development Corp. | $220,000 | North Central | Trade & Tourism |
| Hiring a youth intern to work on Information Technology (IT) systems integration, new product development and provision of client technical support | Sencia Canada Ltd. | $21,500 | North West | Human Capital |
| Strategic plan for the implementation of Geographical Information System (GIS) technology for the municipalities of the Town of Parry Sound, and the Townships of Carling, McDougall, McKellar, Seguin, the Archipelago and Whitestone Strategic Plan | Township of Archipelago | $96,116 | North East | Telecommunications & ICT |
2.3 Strengths and Limitations
Overall, the approaches and sample sizes used for this evaluation resulted in a strong and reliable summative evaluation, which provided the evidence to conclude on all issues. Additionally, the overall evaluation methodology is strong because multiple lines of evidence were used for all issues.
| Démarche | Forces | Faiblesses |
|---|---|---|
| Review of Documents | A wealth of documents were reviewed – these provided information which was useful in addressing most of the evaluation issues. | The review was limited to those documents directly identified by the consulting team as being required for the evaluation or to documents provided by FedNor staff because they were believed to be useful. As such, there is a risk that key documents could have been missed in the review. Nevertheless, this is not a major risk. |
Data Review | This provides quantitative factual information on project results. In the case of this evaluation, because of the recent experience of FedNor with other evaluations, there was a wealth of data available for analysis. Additionally, the consulting team had worked on several other studies for FedNor and therefore had its own extensive databases readily available. | The information in the Project Outcomes Scoresheets was inconsistent. This made some of the data unreliable and therefore unusable for evaluation purposes. |
Interviews | This provides an opportunity to obtain in-depth, qualitative information on the program. | One limitation is that there was a very large number of people who could have been interviewed. This is due to the large number of people involved in program management and delivery as well as in the large number of stakeholders. As such, many people who could have contributed to some of the evaluation issues could not be interviewed, given budgetary constraints. Nevertheless, the number of interviews was sufficient, as evidenced by the amount of fairly consistent feedback received from all interviewee groups. A second limitation involves the fact that the interviews did not include any interviews with unsuccessful applicants. While it was originally intended to interview some of the unsuccessful applicants, in the end, none could be found because they had been approved at some point in time or they could not be located. |
Survey of Recipients . | This provides an opportunity to obtain quantitative information on the program results as well as on other aspects of the program. | The survey approach did not provide as much opportunity for probing into some of the responses and is therefore limited from a qualitative perspective, although some valuable qualitative information was obtained |
Case Studies | Case studies are useful methods for assessing some of the project impacts / results in greater depth. Case studies can be used to highlight lessons learned and best practices related to the specific contributions of projects to community economic development. | Because of the extensive resources involved in completing case studies, only a limited number could be completed. The case studies are therefore not meant to be representative, but provide useful flavour into specific issues. |
3.0 Findings—Relevance
3.1 What evidence exists to show that projects are relevant (e.g., adapted to local economic development needs)?
Document Review
Needs and challenges for economic development in Northern Ontario continue to persist. In 2002, some of the main needs identified related to a dependence on natural resources such as forest products and minerals, lack of appropriate community economic diversification strategies, an aging and declining population, youth out-migration and high unemployment rates. More recently, FedNor has concluded that while much progress has been made, Northern Ontario's economy continues to struggle with similar and persistent socio-economic and geographical challenges including:
- an unemployment rate of 7.8% (2004), far above the 6.8% rate for Ontario and 7.2% rate for Canada;
- a 2% reduction in population (1999–2004) compared to a 9.4% growth in Ontario and 6.9% growth in Canada;
- significant labour losses over the last twenty years (1981–2001) in primary industries (48.5%), manufacturing (33.8%) due largely to the increased use of technology;
- an 11% share of employment in the manufacturing sector compared to 16.3% in Ontario (2001);
- inadequate telecommunications and transportation infrastructure;
- youth out-migration and a regional youth unemployment rate 51% higher than the national average (2001);
- geographic isolation from large urban markets to the south; and,
- distinctive barriers in Aboriginal communities such as social dependency, access to capital and at-risk youth.
A comprehensive analysis of the economic characteristics of Northern Ontario was conducted by Lakehead University in 2004.5 The research included population profile, trends in industrial structure and manufacturing sector, specialization patterns and trends in Northern Ontario's economic base sectors, and Northern Ontario's contribution to the provincial and national economies. An economic well-being index was developed indicating a decline by 32% during 1996–2001 due to the high effective unemployment rate that has resulted in significant out-migration from Northern Ontario.6 The report recommends that FedNor emphasize the following criteria for program areas within its mandate:
- help resource-based industries develop new value-added products and services, commercialize research and develop new markets;
- provide funding (repayable and non-repayable based on performance) to small and medium-sized value added business start-ups in sectors such as forestry, mining, machinery and biotechnology;
- support community projects that are in line with the overall industrialization objectives of promoting these sectors;
- develop low cost energy production to reduce electricity costs to value-added firms; and,
- encourage relocation of existing government agencies to Northern Ontario.7
Data Review
The database review revealed that the NODF is reaching a wide range of recipients and funding a wide range of projects. The profile of projects, based on the information in the database is as per Table 7.
| Characteristic | # of Projects | % |
|---|---|---|
| Studies or Implementation | ||
| Studies | 261 | 24 % |
| Implementation | 814 | 76 % |
| Total | 1 075 | 100 % |
| Region | ||
| North Eastern | 520 | 48 % |
| North Central | 263 | 25 % |
| North Western | 291 | 27 % |
| Total | 1 074 | 100 % |
| Strategic Investments | ||
| Business Financing Support | 32 | 3 % |
| Telecommunications and ICTs | 84 | 8 % |
| Innovation and Technology | 62 | 6 % |
| Trade and Tourism | 134 | 12 % |
| Community Economic Development | 416 | 39 % |
| Human Capital | 347 | 32 % |
| Total | 1 075 | 100 % |
| Target Group | ||
| Youth | 385 | 36 % |
| Women | 14 | 1 % |
| Aboriginal | 207 | 19 % |
| Francophone | 63 | 6 % |
| Total Project Cost | $ | |
| Minimum | 4 030 $ | |
| Maximum | 48 867 137 $ | |
| Mean | 371 224,14 $ | |
| Sum | 399 065 953 $ | |
| FedNor Authorized Assistance | $ | |
| Minimum | 700 $ | |
| Maximum | 4 500 000 $ | |
| Mean | 113 574 $ | |
| Sum | 122 091 955 $ | |
| Proportion of FedNor Funding | % | |
| Minimum | 1,2 % | |
| Maximum | 100 % | |
| Mean | 64,8 % | |
Table 7 shows that FedNor is providing assistance for a wide range of project types, across the regions of Northern Ontario, with a good range of objectives, covering FedNor's target groups (albeit minimally for women and francophones). Additionally, the projects are of varying sizes financially, from as little as 4,030 to as much as close to $50 million.
As for the organizations funded, Table 8 shows that FedNor is providing assistance to a wide range of types of organizations in a wide variety of industry sectors.
| Characteristic | # of Projects | % |
|---|---|---|
| Type of Organization | ||
| Incorporated Company – Private (SME) | 54 | 5% |
| Educational Institution | 78 | 7,3% |
| Other Non-Profit Organization | 563 | 52,4% |
| Municipality / Municipal Development Corporation | 178 | 16,5% |
| Indian Band Council / Aboriginal Community | 201 | 18,7% |
| Federal Government / Federal Crown Corporation | 1 | 0,1% |
| Total | 1 075 | 100% |
| Industry Sector | ||
| Agriculture, Forestry, Fishing and Hunting | 4 | 0,4% |
| Construction | 1 | 0,1% |
| Retail Trade | 1 | 0,1% |
| Transportation and Warehousing | 3 | 0,3% |
| Information and Cultural Industries | 1 | 0,1% |
| Finance and Insurance | 1 | 0,1% |
| Professional, Scientific and Technical Services | 68 | 6,3% |
| Administrative and Support, Waste Management and Remediation Services | 2 | 0,2% |
| Educational Services | 81 | 7,5% |
| Health Care and Social Assistance | 41 | 3,8% |
| Arts, Entertainment and Recreation | 64 | 6% |
| Other Services (except Public Administration) | 198 | 18,4% |
| Public Administration | 610 | 56,7% |
| Total | 1 075 | 100% |
Service Improvement Initiative
In the 2002 Service Improvement Initiative survey, 87% of surveyed recipients indicated that they agreed (strongly agree and agree) that FedNor / Industry Canada was responsive to their needs. In the 2005 survey, 94% of those answering this question indicated that they agreed with the statement. While the increase is not statistically significant, the results show that recipients strongly believe that FedNor is responsive to needs, and thus relevant.
Interviews
All FedNor management and staff interviewees agreed that NODF programming is relevant to the economic needs of communities in Northern Ontario. The relevance of projects is seen to be enhanced by the fact that program officers are out in the community and therefore understand local needs. Interviewees commented that projects are generally targeted to communities and not-for-profit organizations (some of which represent various industrial sectors – health care, mining, agriculture, forestry and tourism). Interviewees commented in the programs ability to not only respond to specific community needs but to bring a broader, more regional perspective to the table. Flexibility of program criteria is seen as a key feature and efforts are made by program officers to ensure supported projects are a good fit with program criteria, indicating that some initiatives are community-oriented while others may have a focus on specific sectors whether it be from a regional or pan-northern perspective. Partnerships are encouraged in order to ensure communities do not work in isolation or at cross-purposes. Staff described their role as being a catalyst for economic development in Northern Ontario. There was also strong agreement amongst management and staff that the new NODF priorities or strategic objectives are appropriate. There was consensus that the change in strategic objectives from the previous ones was appropriate and added greater clarity and definition with respect to FedNor priorities and were a better reflection of work being done through FedNor.
There was also agreement amongst CFDCs and other stakeholders that NODF programming is relevant and that priorities and strategic objectives are appropriate. However, a few individuals felt that FedNor programs were more relevant to larger urban areas and felt that there should be a stronger presence of FedNor officers in their communities.
Recipient Survey
The survey of recipients shows that the NODF priorities are all perceived to be very important to recipients, regardless of their specific project needs. Additionally, when recipients approach FedNor for NODF funding, they indicate that their needs were well met. Table 9 summarizes the average importance ratings of each FedNor priority, the proportion of surveyed recipients who indicated that this priority pertained to their needs in their dealings with FedNor and the average ability of FedNor to address their needs in this area.
| Strategic Priority | Mean Importance (out of 10) | % Needing | Mean Ability to Address Needs (out of 10) |
|---|---|---|---|
| Telecommunications and ICT | 91 | 57% | 8 |
| Innovation and Technology | 86 | 52% | 81 |
| Trade and Tourism | 81 | 54% | 79 |
| Human Capital | 92 | 82% | 84 |
| Business Financing Support | 84 | 3% | 78 |
| Community Economic Development | 91 | 75% | 82 |
When asked in what way the FedNor program was not able to address their needs, 44% of the surveyed recipients indicated that their needs were all met; another 2% said they did not know. The key responses were:
- it does not fund enough; we did not get enough money; it does not cover enough eligible expenses; other money-related issues (22%); and,
- it is too restrictive; the scope of what they fund is too limited; there are too many rules to eligibility (21%).
All other responses were given by less than 10% of the surveyed recipients.
Case Studies
The case studies for the nine projects selected provide specific examples of how NODF projects are linked to local economic development needs. One indicator of the alignment of the projects with local needs is the co-funding that local municipal and other public, not-for-profit and private sector organizations are providing for these projects. Table 10 identifies the types of needs being addressed through each of the nine projects examined in the case studies. The table also lists the local co-funding partners to give examples of the types of local organizations supporting these projects. In most cases, the support is from local municipalities, either directly or indirectly through not-for-profit economic development corporations created by the municipalities.
It should be noted that some NODF projects support broader socio-economic objectives. For example, the funding for the provision of tele-medicine equipment for seven remote First Nations in North Western Ontario, is directly linked to improving the health of the local community. In doing so, the project is building telecommunications and tele-health infrastructure, and supporting the training of technical and health care delivery personnel. These benefits are directly linked to social and health benefits and indirectly to economic benefits by reducing the need to go south for medical diagnosis and treatment. More broadly, access to quality health care is an important precondition to economic development.
| Case Study | Local Needs Being Addressed | Local Organizations Providing Funding |
|---|---|---|
| GIS Strategic Plan for West Simcoe | Municipal and regional strategic planning Improved delivery of municipal services (planning, zoning, fire, police, use of natural resources) | Seven local municipal governments |
| Sault Ste. Marie Innovation Centre youth internship | Development and retention of human capital in North Development and delivery of GIS applications and services to the region | Innovation Centre (not-for-profit responsible for improving competitiveness) |
| Private Sector firm youth internship | Development and retention of human capital in the North Development of technical skills Support for start-up firm | Private sector firm |
| Construct museum complex for Gore Bay Heritage Centre | Tourism development Improved access to cultural events Business opportunities for local crafts | Town of Gore Bay |
| Sault Ste. Marie 2003–2004 Winter Tourism Initiative | Winter tourism development Restoration of tourism business following SARS Support for local businesses linked to tourism | Sault Ste. Marie Economic Development Corporation Local ski and other winter tourist businesses |
| Technology and content development for TV services Chilly Beach in Sudbury | Development of high technology business job creation Development, retention and repatriation of young people | City of Sudbury |
| Development of ultra-sensitive diagnostics for detection of cancer | Development of high technology biotechnology business Creation of jobs Development and retention of young people | Pre-project funding from: Lakehead University Thunder Bay Ventures (local CFDC) Private citizens |
| Development of Marketing Plan and Content for Timmins region | Attraction of new businesses Expansion of existing businesses Creation of jobs Retention of youth | City of Timmins Local businesses |
| Provision of telemedicine equipment for seven remote First Nations in North Western Ontario | Development of telecommunications infrastructure Training of technical and health care delivery personnel Improved access to healthcare Improved delivery of health care services | No other funders Delivery agent is not-for-profit tribal council serving seven remote First Nations |
3.2 What is the degree of match between program selection criteria and actual projects?
Interviews
Management and staff interviewees indicated that they had no difficulty in determining how the projects met the program selection criteria. Several program officers described how they work with clients in the early stages of project development to ensure that the project would be a good fit with the NODF program. Sector specialists also play a key role in ensuring a good match between program selection criteria and actual projects. Some officers also described a process whereby project proposals are discussed at internal team meetings, thereby providing the opportunity to assess their appropriateness in the context of other projects that have been approved or being considered.
Case Studies
All projects examined in the case studies are in general aligned with one of five NODF program elements (Community Economic Development, Trade and Tourism, Innovation and Technology, Telecommunications and ICT, and Human Capital8).
In addition, many of the FedNor project summaries identify specifically the FedNor objective under which the project is being funded. For example, the project involving the development of multimedia technology and content for the television service Chilly Beach in Sudbury under the Innovation and Technology element, was funded under criterion 7.1.2, whereby FedNor can make "contributions to start-ups and pre-commercial product development which would be unlikely to attract commercial debt due to the risk involved". In the case of the Sault Ste. Marie Innovation Centre Youth Internship, it was noted that the project meets the requirements of FedNor's Program Framework, by "promoting entrepreneurship and enhancing business management skills as well as providing a post-secondary graduate with valuable work experience in business and economic development, with the objective of leading to longer term employment". The construction of the Gore Bay museum complex is an example of a tourism related initiative. In this case, the project summary cited Section 7.1.2 c of FedNor's terms and conditions, which provide for "contributions for costs of activities such as the development of economic infrastructure and the strengthening of Northern Ontario's tourism industry through the development of destination tourist facilities".
The case study files also show that the percentage of total project funding for each project follows FedNor criteria. For example, funding for youth internship projects consists of non-repayable contributions that are limited to 50% of eligible costs for private sector firms, but provide up to 90% funding for public and not-for-profit organizations. For contributions to projects led by private sector firms, contributions are limited to 50% of total eligible costs and are repayable and depending on project success, may exceed the amount of the contribution. For one of the projects involving private sector firms examined, repayment is based on 1% of annual gross sales arising from commercialization of the product, to a maximum of 125% of the contribution. For the other project, repayment is set at a fixed amount per year, to a maximum of 120% of the contribution.
The case studies also show that there is flexibility in administering the guidelines and criteria. In one of the projects involving a private sector firm, the recommended contribution is 57% of eligible costs, exceeding the normal 50% limit. This was justified on the basis of the "strategic importance of this project to Northern Ontario" and "the difficulty such innovative companies have in raising capital in Northern Ontario".
3.3 Conclusions – Relevance
1. The economy of Northern Ontario continues to struggle with economic development issues. NODF strategic priorities are relevant and adapted to these economic development issues. Additionally, the projects are relevant in their objectives and meet the criteria established by FedNor.
The key aspects of NODF which make the program particularly relevant are:
- its flexibility;
- its broad criteria and broad range of priorities;
- the range of project size it funds;
- its broad reach;
- the fact that it is customized to needs;
- its partnership approach;
- its geographic delivery; and,
- its ever evolving strategic outlook.
5 Dr. B. Moazzami, Department of Economics, Lakehead University, Northern Ontario in the 21st Century: New Challenges and Opportunities.(Return to reference 5)
6 Ibid (p. 102–106) (Return to reference 6)
7 Ibid (p. 154–155) (Return to reference 7)
8 Excludes Business Financing Support which was not included in the case studies.(Return to reference 8)
4.0 Findings – Staff Support
4.1 Are project clients satisfied with counselling, advice, training or workshops provided?
Interviews
FedNor management and staff felt that for the most part clients were satisfied with counselling and advice provided. Several described their close relationships with clients and stressed the importance of early involvement with proponents as project ideas are developing. Several were unaware of specific training and workshops provided by FedNor through the NODF apart from some workshops related to trade and tourism.
CFDC interviewees provided a mixed reaction to the question of satisfaction with counselling, advice, training and workshops. Some were very satisfied with support and advice from FedNor. Many were unaware of training or workshops that had been provided. A concern with the cost to travel long distances to attend training sessions was identified as an impediment. Some also expressed concern that there appears to be inconsistencies in the advice provided by FedNor staff with respect to project selection criteria and matters pertaining to reporting and payment claims.
Recipient Survey
In total, 86% of surveyed recipients indicated that they had received counselling or advice from FedNor. Of those who did receive counselling or advice, 97% indicated that they had used or intended to use the advice. The key ways of using this advice were:
- for project applications / proposals (32%);
- for project planning purposes (17%);
- to find partners or other sources of funding or other contacts (15%);
- for general knowledge on their services and how to use or access them (13%);
- to help in filling out various forms (11%); and,
- to help in project management or project implementation (11%).
All other responses were provided by less than 10% of the respondents.
Only 21% of surveyed recipients indicated that they had received training or attended a workshop offered by FedNor. However, of those, the great majority (91%) indicated that they had used or intended to use what they had learned. The key ways of applying what they learned were:
- for day-to-day activities (23%);
- for project management or project implementation (15%);
- for planning purposes (15%); and,
- for project applications / proposals (10%).
All other responses were provided by less than 10% of the respondents.
Case Studies
None of the projects examined in the case studies involved formal counselling, training or workshops. Therefore the issue was interpreted to involve the advice provided by project managers to applicants in developing the project application.
A number of the organizations applying for project funding have long standing relationships with FedNor and have received funding for several projects. In one case examined, the Sault Ste. Marie Innovation Centre has had eight youth interns funded through FedNor. In many of these cases, project applicants are generally familiar with the criteria for funding and require little additional advice or support from FedNor staff. However, in other cases, advice from the FedNor officer has had a major effect on the scope of the project. An example of this is the project involving development of a GIS plan for seven municipalities in the District of Parry Sound. Initially the Township of the Archipelago submitted an application to develop a plan for their Township alone. The FedNor officer encouraged a broadening of the application to include seven local municipalities, all of which could benefit from a GIS plan. Through the revised project, a number of rural municipalities were able to pool resources to undertake a project that took advantage of the GIS expertise of one staff member of the Township of the Archipelago to benefit all seven municipalities. The revised project was also consistent with the FedNor objective of developing larger regionally based projects, where appropriate, to encourage networking and partnerships among small Northern communities.
top of page4.2 Is FedNor providing appropriate support and follow-up to project representatives?
Service Improvement Initiative9
There were several questions in the Service Improvement Initiative survey which dealt with staff support and follow-up. Table 11 summarizes the satisfaction with relevant aspects of FedNor support and follow-up as well as the importance of these features.
| Feature | Mean Satisfaction (out of 5) | Mean Importance (out of 5) | Service Gap (Satisfaction minus Importance) |
|---|---|---|---|
| Courteous | 46 | 45 | 1 |
| Helpful | 45 | 48 | -3 |
| Competent | 45 | 48 | -3 |
| Have up-to-date information | 43 | 47 | -4 |
| Respectful | 46 | 45 | 1 |
| Flexible | 42 | 46 | -4 |
| Protect privacy / confidentiality | 46 | 46 | 0 |
| Keep clients informed of the status of their requests | 41 | 47 | -6 |
| Offer suggestions about other services offered by other organizations | 36 | 41 | -5 |
| On-going business relationship with clients | 44 | 46 | -2 |
| Appointments easy to make | 42 | 44 | -2 |
| Overall, with staff service | 44 | 47 | -3 |
| Strategic advice and support to strengthen proposal | 42 | 46 | -4 |
| Helpful advice and support during the payment process | 43 | 46 | -3 |
| Regular and timely monitoring of projects | 41 | 43 | -2 |
| Help in approving logo placement and design of promotional materials | 37 | 4 | -3 |
| Questions are answered | 43 | 48 | -5 |
| Consistent information / advice | 41 | 47 | -6 |
| Written and verbal language is clear | 42 | 46 | -4 |
| Overall satisfaction with communications | 44 | 46 | -4 |
| Staff did an excellent job | 45 | n.a. | n.a. |
| Overall FedNor service delivery | 44 | n.a. | n.a. |
The table shows that, while there are gaps between the satisfaction of recipients with support features and the importance of these features, overall, surveyed recipients were highly satisfied with all aspects of staff support. The only features with average ratings below 4 (satisfied) were related to offering suggestions about other services offered by other organizations and help by the Communication Officer in approving logo placement and design of promotional materials.
The table also shows that the largest staff support gaps when comparing satisfaction to important are in keeping clients informed of the status of their requests, providing consistent information / advice, offering suggestions about other services offered by other organizations, and answering questions.
Interviews
FedNor management noted that staff support was more intensive at the project development phase where the officers worked intensively with the clients to ensure that they had the tools they needed to meet FedNor requirements. This included assistance in refining goals and objectives to better meet FedNor strategic objectives; assistance in identifying other sources of funding and working with these sources, as applicable, to ensure that they complemented rather than duplicated each other; and helping throughout the proposal writing stages. FedNor management believed that staff did an outstanding job in this regard. However, management felt that monitoring and follow-up, once a project was approved, was somewhat limited.
FedNor officers also described support to project representatives as being most intensive during the project development phase. Many officers also have on-going and long-term relationships with clients. Support and follow-up is carried out on specific projects as well as through the participation of officers at meetings, steering committees and various networks and organizations within communities. Several officers indicated that they would like to provide more support and follow-up on projects but that workload demands and in some cases geographic considerations placed limitations on time available. Some indicated that an increased focus on 'after-care' would be beneficial.
Officers also spoke positively about the FedNor's risk mitigation approach to the assessment of project proponents. This approach helps to determine the level of follow-up and support that should be provided to clients in order to ensure success of projects. Program officers also expressed satisfaction with services provided by Payments and Monitoring and described the importance of their role in project monitoring.
Again the response of CFDC interviewees was mixed with respect to the level of support and follow-up provided by FedNor. About half were highly satisfied, appreciative of the constructive role played by FedNor officers. Specific areas of concerns that were noted by about half of the interviewees include frustration with slow turnaround time on project approvals and payments and onerous reporting requirements. A few commented that they would like FedNor to have a greater presence in their community.
Recipient Survey
The surveyed recipients were asked what support they had received from FedNor staff during and in follow-up to the project. Only 8% indicated that they had received no support and 2% did not know what support they had received. However, 4% indicated that the staff had been "supportive in every way". The most frequently mentioned responses were:
- reporting assistance and oversight; ensuring that we report; assistance with claims (25%);
- assistance in proposal preparation; how to get funding; how to fill out the application form; how to comply with the application requirements (25%);
- provision of advice; answering our questions; providing suggestions (24%); and,
- attending meetings; regular contacts; site visits; other personal communications (22%).
All other responses were provided by less than 10% of the respondents.
When asked how satisfied they were with the support and follow-up provided, 39% indicated that they were extremely satisfied and an additional 41% gave a rating of 8 or 9 out of 10. Only 5% gave this a rating of 5 or less (i.e., dissatisfaction). Overall, the mean satisfaction was 8.7 out of 10, which is very high.
When asked how they had benefitted from the staff support and follow-up, only 5% said they had not benefitted and 2% said they did not know how they had benefitted. The most frequently benefits gained from the staff support and follow-up were:
- the project was successful, met their goals, it was a better project as a result of the support (20%);
- the organization was able to do the project (20%);
- the organization accessed the funds (19%); and,
- this resulted in employment (10%).
All other responses were mentioned by less than 10% of the respondents.
When asked if they had received enough support and follow-up, 84% indicated that they had. For the few who indicated that they had not received enough support, the reported negative impacts included:
- delays / missed deadlines (33% of those who indicated that they had not received enough support);
- added confusion / complexity to the process (26%);
- resulted in more work for us (22%); and,
- unable to complete the project (11%).
Case Studies
Evidence from the case studies shows that FedNor officials often provide ongoing monitoring and support to organizations receiving funding. At times, this support includes helping develop applications for additional funding to support the organization's overall objective and through them the achievement of the overall FedNor mandate. A prime example is the provision of funding to Keewaytinook Okimakanak (K-Net) to install tele-medicine equipment for seven remote First Nations. This is part of a much larger initiative of FedNor and Bell Canada involving the coordination of 20 million in regional telecommunications infrastructure. This particular project is supportive of KNet's 6 million Health Canada Primary Health Care Transition Fund to establish permanent tele-medicine services to the remaining 18 remote First Nations in the Sioux Lookout Zone that do not have this service. Another example is the provision of funding through several projects to the Sault Ste. Marie Innovation Centre for a total of eight youth interns. Almost all of these interns have remained in the North. In the case of the construction of the museum complex in Gore Bay, this is just the latest in a number of FedNor funded projects developing museum facilities and interpretation centres in communities on Manitoulin Island, as a means to develop the Island as a destination tourist attraction.
top of page4.3 How many objectives have been achieved in the Service Improvement Plan?
Overview
The FedNor Service Improvement Initiative (SII) Plan covers the services provided by FedNor for all of its programming. Therefore, while this issue was included in this evaluation of the NODF, it is important to note that the evidence presented in this section is not limited to NODF performance, but rather on organizational performance. For example, the data on turnaround time on payments includes all FedNor payments, be they NODF projects, payments on other FedNor programs, such as the Community Futures Program, or even payments for contracting for services.
Additionally, the survey data presented is based on two surveys conducted with FedNor clients and was therefore not limited to NODF clients.
Nevertheless, the majority of FedNor activities in this regard involves NODF services.
Service Improvement Initiative10
The FedNor Service Improvement Initiative (SII) Plan identifies five priorities. Performance against these priorities is summarized in Table 12.
Table 12: Service Improvement Initiative Performance against Priorities
Priority 1: Reduce the turnaround time on proposals
In the 2001/02 SII survey, 21% of clients were very satisfied with the turnaround time on applications; in the 2004/05 survey, the proportion of very satisfied had increased to 32%, an increase in satisfaction of 11%. The overall mean has also increased from 3.4 to 3.8 out of 5, or a 10% increase in average satisfaction (this increase is statistically significant).
Priority 2: Improve overall application / proposal assessment process
Satisfaction with various aspects of the application / proposal assessment process has not changed significantly between the 2001/02 and 2004/05 surveys. Clients (2004/05) are, on average, satisfied that:
- FedNor / IC staff provided strategic advice and support to strengthen their proposal (mean of 4.2);
- the FedNor / IC application and evaluation process was fair (mean of 4.2);
- the information that they required in order to submit an application was available (mean of 4.1);
- application documents were easy to understand (mean of 4.0);
- overall, with the application and assessment process (mean of 4.0); and,
- the turnaround time on applications was acceptable (mean of 3.8).
Priority 3: Reduce turnaround time on payments
In 2001/02, the average turnaround time for processing payments was 45.42 days. The survey of clients in 2001/02 revealed that 32% of respondents were very satisfied that the payment process was timely and 29% were very satisfied with the overall payment and monitoring phase of their project. Given the level of satisfaction and the importance of this to clients, the turnaround time on payments was deemed to be a service improvement priority.
In 2004/05, the average turnaround time for processing payments was 57.13 days (an increase of 26% from 2001/02). The survey of clients in 2004/05 revealed that 37% of respondents were very satisfied that the payment process was timely (an 5% increase in satisfaction – which is not statistically significant). Additionally, 33% of respondents were very satisfied with the overall payment and monitoring phase of their project in 2004/05 (a 4% increase in overall satisfaction – which is not statistically significant). However, given the level of satisfaction and the importance of this to clients, the turnaround time payments was not deemed to be a service improvement priority in 2004/05.
Priority 4: Improve overall payment and monitoring process
Satisfaction with various aspects of the payment and monitoring process has not changed significantly between the 2001/02 and 2004/05 surveys. Clients (2004/05) are, on average, satisfied that:
- FedNor staff provided helpful advice and support during the payment process (mean of 4.3);
- the approved FedNor logos were easily located on the FedNor website (mean of 4.3);
- the information required in order to request a payment was available (mean of 4.1);
- FedNor's monitoring of projects was regular and timely (mean of 4.1);
- overall with the payment and monitoring phase of the project (mean of 4.0);
- FedNor's payment process was timely (mean of 3.9);
- the requirements regarding project announcements / communications were clear (mean of 3.9);
- forms were easy to understand and fill out (mean of 3.7);
- the Communication Officer was helpful in approving logo placement and design of promotional materials (mean of 3.7); and,
- the public announcement of projects was well planned (3.4).
Priority 5: Enhance communications with clients
Satisfaction with various aspects of FedNor communications with clients has not changed significantly between the 2001/02 and 2004/05 surveys. Clients (2004/05) are, on average, satisfied that:
- they had a choice of English or French language (mean of 4.7);
- questions were answered (mean of 4.3);
- it was easy to find out how to get FedNor's service (mean of 4.3);
- overall with communications (mean of 4.3);
- written and verbal language was clear (mean of 4.2); and,
- they received consistent information / advice (mean of 4.1).
All relevant results from the Service Improvement Initiative survey are presented in summary form in Table 13 which follows:
| Feature | 2002 Mean Satisfaction (out of 5) | 2005 Mean Satisfaction (out of 5) | Statistically Significant Change |
|---|---|---|---|
| Priority 1: Reduce the turnaround time on proposals | |||
| The turnaround time on applications was acceptable | 3.4 | 3.8 | Yes |
| Priority 2: Improve overall application / proposal assessment process | |||
| FedNor / IC staff provided strategic advice and support to strengthen their proposal | 4.1 | 4.2 | No |
| The FedNor / IC application and evaluation process was fair | 4.3 | 4.2 | No |
| The information that they required in order to submit an application was available | 4.2 | 4.1 | No |
| Application documents were easy to understand | 3.9 | 4 | No |
| Overall, with the application and assessment process | 4.1 | 4 | No |
| Priority 3: Reduce turnaround time on payments | |||
| FedNor's payment process was timely | 3.6 | 3.9 | No |
| Priority 4: Improve overall payment and monitoring process | |||
| FedNor staff provided helpful advice and support during the payment process | 4.3 | 4.3 | No |
| The approved FedNor logos were easily located on the FedNor website | 4.2 | 4.3 | No |
| The information required in order to request a payment was available | 4.2 | 4.1 | No |
| FedNor's monitoring of projects was regular and timely | 4.1 | 4.1 | No |
| Overall with the payment and monitoring phase of the project | 3.9 | 4 | No |
| The requirements regarding project announcements / communications were clear | 4.1 | 4 | No |
| Forms were easy to understand and fill out | 3.6 | 3.7 | No |
| The Communication Officer was helpful in approving logo placement and design of promotional materials | 3.8 | 3.7 | No |
| The public announcement of projects was well planned | 3.7 | 3.4 | No |
| Priority 5: Enhance communications with clients | |||
| They had a choice of English or French language | 4.6 | 4.7 | No |
| Questions were answered | 4.3 | 4.3 | No |
| It was easy to find out how to get FedNor's service | 4.3 | 4.3 | No |
| Overall with communications | 4.3 | 4.3 | No |
| Written and verbal language was clear | 4.1 | 4.2 | No |
| They received consistent information / advice | 4.1 | 4.1 | No |
Interviews
The majority of management and staff interviewed had some general knowledge of FedNor's Service Improvement Plan, indicating that a major focus was on improving turnaround time on project approvals and payments. Most were aware that changes to program codes had been established to more accurately capture the life cycle of project proposals and reflect the situation where submitted proposals are incomplete and require additional information from the proponent.
Managers were of the opinion that significant progress had been made and that some of the satisfaction levels were so high that things could not improve much. However, there was general agreement that work was still required with the payment and monitoring process.
Officers indicated that process improvements have been made and described a good working relationship between program officers and payments staff. Interviewees commented that the organization is committed to continually finding ways to improve administrative processes. Program officers also make an effort to meet directly with new clients at project outset to ensure reporting requirements are clear and often include a representative from the Payments and Monitoring group in these discussions. Program officers were also pleased with the electronic messages they receive that serve as reminders when client reports are due.
top of page4.4 Is staff support being provided in the official language of choice?
Database Review
The FedNor recipient database identifies 91 French clients and 984 English clients. Therefore, according to the data, 8.5% of clients are French. The FedNor staff list identifies 29 unilingual (English) officers and 16 bilingual ones. Therefore 35.5% of officers can provide services to the 8.5% of French clients. It is noteworthy that bilingual resources are readily available at all levels of management and at all staff levels.
Service Improvement Initiative
The two SII surveys revealed that clients were very satisfied that they had a choice of English or French languages. In 2001/02, 72% of clients were very satisfied with this and in 2004/05, 74% of clients were very satisfied.
Interviews
FedNor management and staff were asked if they were able to provide clients with services in both official languages. While less than half those interviewed indicated that they were bilingual, all of the interviewees stated that this had never presented a problem and that, if a Francophone client did require services in French, staff resources would be available to meet these needs.
Recipient Survey
In total, 86% of surveyed recipients indicated that they preferred to deal with FedNor staff in English, 11% preferred French and 3% had no preference. When asked if they were able to get support in the official language of choice, an overwhelming 97% said yes. However, those who preferred French were statistically significantly less likely to be able to get support in their language of choice than their English counterparts. Nevertheless, as shown in Table 14, the great majority of French and English clients are able to get staff support in the language of their choice.
| * denotes less than 1% | ||
| Able to get Staff Support in Language of Choice | Language of Choice | |
|---|---|---|
| French | English | |
| Yes | 91% | 99% |
| Sometimes | 5% | * |
| No | 4% | 0% |
| Don't know | 0% | * |
4.5 Conclusions – Staff Support
2. The role of FedNor staff, in particular of program officers, is critical to the successful planning, development and implementation of projects. There are several key aspects with respect to staff support that contribute to this success:
- the extensive advice and counselling provided by the officers in the development of proposals;
- the due diligence exercised by program officers in ensuring, not only that NODF funding does not duplicate or overlap other sources of funding, but also that the client is aware and has access to all other potential sources of funding;
- the local presence of the program officers;
- the on-going relationship of staff with some clients; and,
- the ability to provide services in the official language of choice.
However, there are concerns with some aspects of the support provided in terms of project implementation, monitoring and follow-up. These concerns include:
- some inconsistency among program officers in applying the criteria as well as in the level and type of support provided during the project; and,
- workload demands that do not provide program officers with the time to provide an adequate level of monitoring and follow-up that they (and others) believe is required.
3. All priorities outlined in the Service Improvement Initiative plan have been successfully addressed except with respect to the turnaround time on payments. However, the turnaround time on payments is no longer assessed as being a service improvement priority, from the clients' perspective. This is due to the fact that clients are slightly more satisfied with FedNor's performance on this and they do not believe this to be as important a service feature as it was in earlier years.
9 As a part of the Government of Canada Service Improvement Initiative, FedNor / Industry Canada surveys of clients and staff were undertaken in 2002. The purpose of the surveys was to compare client and staff perceptions, determine where success had been realized and areas for FedNor / Industry Canada service improvement. In follow-up to the 2002 surveys, FedNor / Industry Canada contracted a second survey of clients in 2005. The 2005 approach involved a survey of 151 FedNor / Industry Canada clients who had active projects in 2004. For further information please see: http://www.ic.gc.ca/eic/site/ae-ve.nsf/eng/03067.html (Return to reference 9)
10 The Service Improvement Initiative has, to date, involved two surveys resulted in two separate reports (in 2002 and 2005). Basic information on the sample sizes is provided in the methodology section. More details on the studies themselves is available in the two reports produced at the time of the surveys.(Return to reference 10)
5.0 Findings – Success
5.1 Has FedNor contributed to the development and retention of new and existing businesses?
Document Review
Through the NODF, FedNor provides indirect assistance to private sector organizations through:
- direct capitalization of the CFDCs (top-up to the CFDC investment fund);
- the Credit Union Loan Loss Reserve; and,
- The BDC Loan Loss Reserve.
These organizations in turn use the NODF funds to provide assistance to private sector organizations for the development of new businesses and the retention of existing ones. These private sector firms are secondary recipients of NODF funding. As such, FedNor has reports and data from the CFDCs / Credit Unions / BDC on the funding and its impacts.
An independent review and evaluation of the effectiveness of the Credit Union Loan Loss Reserve program was conducted in November 2003. The study concluded that the financing provided under the funding program has resulted in both job creation and retention. Feedback received from participants in the program indicated a high level of satisfaction, with only minor recommendations noted related to eligible projects / expenditures, interest rates and loan amortization periods.Footnote 11
FedNor also completed an independent review of the effectiveness of the lending program established with the Business Development Bank. The lending program was designed to assist small and medium sized enterprises in Northern Ontario. Although there were a total of 25 loans issued under the program (for a total dollar value of 2,621,500), participation in the program has been non-existent since July 2004. The September 2005 evaluation included a number of recommendations concerning the program's future. It was recommended that if a decision is taken to continue with the program that project eligibility requirements for the program should be expanded, marketing efforts should increase within BDC, the program should be modified to accommodate quasi-equity and equity financing, and that a number of administrative and reporting improvements should be implemented.Footnote 12
Data Review
The data shows that 32 "projects" have been funded with the CFDCs, BDC and Credit Unions, for a total of 27,483,930 in NODF assistance.
The Northern Ontario CFDCs received a total of 11,892,180 in NODF capitalization assistance (direct capitalization and special capitalization "top ups"). It is impossible to determine the impacts of these "top-ups" since the CFDCs do not track the projects funded through their NODF capitalization fund separately from their existing investment fund. However, the CFDCs report performance from their investment activities as summarized in Table 15.
| Performance Area | Result |
|---|---|
| Businesses started | 488 |
| Businesses maintained | 458 |
| Businesses expanded | 347 |
| Total businesses assisted | 1,293 |
| Jobs created | 2,124 |
| Jobs maintained | 4,277 |
| Total jobs created / maintained | 6,401 |
| Funds leveraged – owner's equity | $37,193,602 |
| Funds leveraged – third party | $52,507,462 |
| Total funds leveraged | $89,701,064 |
Interviews
Management and staff emphasized FedNor's role as working with the not-for-profit sector to achieve results that create an environment in which new and existing business can develop and prosper. In this respect NODF's contribution to private sector firms is indirect. Numerous examples were provided by CFDCs and other stakeholders which highlight the ways in which FedNor has contributed to the development and retention of new and existing businesses. For example, FedNor has provided support in areas such as:
- the Sudbury and Area Mining and Supply Association whose mission is to provide the most innovative and highest quality supply / product / services for domestic and worldwide services;
- the Discover Abitibi Initiative, a joint collaboration with provincial, municipal and private sector partners to coordinate and direct an integrated geoscientific investigation of the Abitibi Greenstone belt of North Eastern Ontario in order to provide tools for the discovery of new mineral wealth and generate investment in region;
- business retention and expansion surveys in a number of communities (including Kenora, Dryden and Red Lake) serve to identify relevant issues and lead to the development of action plans;
- support to various business centres, economic development organizations and CFDCs;
- the film and television industry;
- the Shania Twain Centre and the Sudbury Art Gallery;
- a feasability study for the Group Health Centre;
- a educational video for the Ontario Mining Association;
- the Wood Works project of the Canadian Wood Council to promote the use of wood in non-residential buildings;
- helping a First Nation's organization stabilize a store front for nature products that now acts as an anchor for the downtown area;
- development of an abattoir and bakery in a First Nations community;
- bringing a Teletech Call Centre to Timmins which is now a major employer; and,
- the Iroquois Cranberry Growers were assisted with financing to upgrade processing equipment with an optical sorter.
Recipient Survey
In total, 23% of surveyed recipients indicated that their project involved the development of new businesses. Those who indicated that the project involved the development of new businesses also reported an average of 3.4 new businesses created (between 0 and 30) as a result of the project. For the survey sample, this represented a total of 124 new businesses created. In addition, these 124 new businesses created an average of 13.1 jobs or a total of 470 jobs created.
As previously noted, a total of 54 private sector organizations have received assistance from NODF. A total of 20 of those were surveyed in this evaluation. Table 16 shows the growth in the surveyed private sector organizations.
| Before project | Now | Change | |
|---|---|---|---|
| Full-time Employees | |||
| Mean | 7 | 85 | 15 |
| Sum | 133 | 170 | 37 |
| Part-time Employees | |||
| Mean | 5 | 125 | 75 |
| Sum | 10 | 25 | 15 |
Private sector organizations were also asked if the project had helped them retain some of their existing employees. In total, 53% said yes and reported that the project had helped retain an average of 2.6 full-time employees and no part-time employees. This represents a total of 26 full-time jobs retained for the surveyed private sector organizations.
Case Studies
The projects examined show that NODF projects help retain and create businesses in Northern Ontario in a number of ways, some direct and some indirect. Two of the projects funded start-up private sector initiatives that, if successful, would directly result in new businesses in Northern Ontario. One of these has already proven successful, and the other has just completed the proof of concept stage and is involved in product development. Another project helped attract new business to Northern Ontario through a successful marketing plan that described business opportunities in the region. This has led to several retail businesses coming to town, that will employ several hundred people. The increased economic activity generated by these new local businesses will also help existing local businesses survive and grow.
Two other projects contribute to retention and creation of businesses indirectly through increased tourism. Tourists spend money on accommodation and meals, and other retail purchases. This spending helps retain and grow existing businesses and possibly develop new tourist related business.
Table 17 summarizes the contribution of each case study to the retention of existing businesses and creation of new ones.
| Case Study | Retention and Growth of Existing Businesses | Creation of New Businesses |
|---|---|---|
| GIS Strategic Plan for West Simcoe | Minor indirect through improved municipal planning | Minor indirect through improved municipal planning |
| Sault Ste. Marie Innovation Centre youth internship | Medium direct through introduction of new capabilities | None |
| Private Sector firm youth internship | Major direct through development of new products and applications | None |
| Construct museum complex for Gore Bay Heritage Centre | Major indirect through increased tourism | Minor indirect through increased tourism |
| Sault Ste. Marie 2003–2004 Winter Tourism Initiative | Major indirect through increased tourism | Minor indirect through development of new winter tourism attractions |
| Technology and content development for TV services Chilly Beach in Sudbury | Minor through sales of products and services to new company and employees in region | Major – creation of new multimedia production capability |
| Development of ultra-sensitive diagnostics for detection of cancer | None | Major – creation of new biopharmaceutical business |
| Development of Marketing Plan and Content for Timmins region | Major through construction of new buildings, purchase of equipment and services, and retail sales to new employees | Major through attraction of new retail and other businesses to community |
| Provision of tele-medicine equipment for seven remote First Nations in North Western Ontario | Minor through training of personnel to utilize telecommunications equipment | None |
5.2 Has FedNor improved competitiveness of Northern Ontario firms?
Interviews
As stated earlier, FedNor's contribution to the competitiveness of firms in Northern Ontario is indirect. Interviewees identified examples such as FedNor's support of trade networks and missions and business training services offered by their partners. FedNor's support and participation in the Royal Winter Fair was an example identified by a few interviewees as an important initiative to bring firms from Northern Ontario to Toronto and provide exposure to the Southern Ontario and international marketplace. Interviewees discussed a number of direct and spin-off benefits for Northern Ontario firms. They reported that international trade missions and the role played by trade advisors who work directly with firms are making an important contribution to increasing the competitiveness of firms. Stakeholders and CFDCs generally found it harder to provide specific examples or comment on FedNor's contribution to the competitiveness of firms.
Recipient Survey
The survey of recipients gauged the impact of FedNor on the competitiveness of Northern Ontario firms by asking private sector organizations about their gross revenues and profits before their application to FedNor for the project as well as now. The results demonstrate that FedNor has contributed to improved competitiveness as shown in Table 18.
| Survey Sample (20 firms) | |||
|---|---|---|---|
| Before project | Now | Change | |
| Mean | $793,165.60 | $984,401.24 | +$191,235.64 |
| Sum | $15,863,312.00 | $16,734,821.00 | +$871,509.00 |
The survey results revealed that several private sector recipients had experienced significant reductions in their profitability or even losses.Footnote 13
In total, 55% of the surveyed private sector organizations indicated that their organization had grown in other ways as a result of their NODF project. The responses were fairly unique to each organization but included growth in employment, new services, and new capabilities.
In total, 71% of private sector organizations also reported that their organization had developed an innovative product, process or service as a result of the project.
Case Studies
Three of the case studies involved projects with private sector firms, and they were all essentially start-ups, developing new and innovative products and services. In the case of March Entertainment, the innovative technology developed has already proven commercially successful and has enabled the production of animated programming for internet and television at approximately 60% of the cost of the previous approach. As an indication of the competitiveness of the firm, it now conducts production of animated programming for other companies under subcontract, as well as for itself. These case studies were discussed in the previous section (Section 5.1) on the creation of new businesses.
top of page5.3 Has FedNor helped attract, retain and develop human capital, including special client groups (women, Francophones, First Nations and other Aboriginal people, youth)?
Document Review
Annual evaluations of the Youth Internship Program were conducted. Some of the key information and key findings are provided in the following table.
| 2002 | 2003 | 2004 | |
|---|---|---|---|
| # of interns completing survey | 96 | 69 | 112 |
| # of representatives from host organizations | 160 | 30 | 114 |
| % of hosts satisfied | 93% | 91% | 96% |
| % of youths satisfied | 88% | 97% | 92% |
| % who indicated they would be employed following their internship | 72% | 71% | 65% |
Data Review
As previously noted, FedNor has provided assistance for 347 human capital projects. These involved special client groups as shown in Table 20.
| Target Group | # of Projects | % of Human Capital Projects |
|---|---|---|
Note: Totals may equal more than 100% due to the fact that some human capital projects could target several groups. | ||
| Youth | 340 | 98% |
| Women | 2 | 1% |
| Aboriginal | 43 | 12% |
| Francophone | 20 | 6% |
| No target group involved | 6 | 2% |
| Total | 347 | 100% |
Interviews
All interviewees stated that they very familiar with FedNor's Youth Internship Program (YIP) and stressed that it has been very successful in developing skills for youth and tackling the problem of youth out-migration from Northern Ontario. The Youth Internship Program also reaches FedNor's other target groups: Francophones, Women, First Nations and other Aboriginal Groups. Many of the interviewees also have first hand knowledge of the program as they had used youth interns within their organizations. Although satisfied with the program, many felt that there should be greater flexibility with respect to the term of the internship assignments. Some felt that in certain cases a term longer than one year would be beneficial particularly if the assignment was tied to the completion of a specific project. Another suggestion related to the Program is that there be an opportunity to have an overlap period for the interns so the outgoing intern can provide some training to the incoming intern. One person also suggested that it would make sense for CFDCs to administer the YIP to speed up the application process. Other youth related initiatives identified by interviewees included FedNor's support of business plan competitions, the Scoops Program targeted towards at-risk youth, working with the Mineral Council Cluster to address gaps in highly qualified personnel, establishment of a facility for training welders, training simulators for forestry industry, support to educational institutions to enhance their capacity for on-line course offerings so youth may stay in their own community, and efforts to encourage youth to pursue careers in health care and mining. Most interviewees felt that FedNor was not targeting women specifically although support is provided to organizations such as business women's networking and some micro-lending initiatives.
Recipient Survey
The survey of recipients revealed that 49% of projects resulted in the attraction of new staff to the funded organization, 39% resulted in the retention of existing staff within the organization and 53% resulted in the development of existing staff within the organization. Only 23% of the projects did not involve any form of human capital. The results are summarized in Table 21.
| Target Group | Survey Sample | ||
|---|---|---|---|
| % incidence | Mean # | Sum # | |
| Attraction of New Staff to Organization | |||
| Youth | 30% | 1.2 | 111 |
| Women | 32% | 1.3 | 123 |
| Aboriginal | 8% | 7 | 63 |
| Francophone | 13% | 6 | 53 |
| Total | 49% | 3 | 293 |
| Retention of Existing Staff Within Organization | |||
| Youth | 12% | 7 | 58 |
| Women | 26% | 1.7 | 130 |
| Aboriginal | 7% | 1.2 | 91 |
| Francophone | 11% | 0.5 | 40 |
| Total | 39% | 5.2 | 498 |
| Development of Existing Staff Within Organization | |||
| Youth | 17% | 8 | 77 |
| Women | 44% | 8 | 80 |
| Aboriginal | 13% | 5 | 50 |
| Francophone | 13% | 4 | 412 |
| Total | 53% | 5.8 | 604 |
For youth internships, 72% of respondents indicated that the youth had obtained on-going employment after the internship as follows:
- 51% within the funded organization (45% in the intern's area of expertise);
- 35% in another Northern Ontario organization (21% in the intern's area of expertise);
- 9% outside Northern Ontario (7% in the intern's area of expertise); and,
- 5% did not know where the intern had found employment.
Based on the aforementioned 340 youth internships, this means that more than 200 youth found employment in Northern Ontario after their internship.
Case Studies
Many NODF projects contribute to the attraction, retention and development of human capital, either directly or indirectly. Examples of a direct contribution are provided by the youth internship case studies, whose objective is to provide work experience and skills development for post-secondary students, with a view to long-term employment with the participating organization after the project. A broader goal is to provide employment opportunities for youth in the North to counteract the out-migration of youth from the North. As mentioned previously, 11 youth internships at the Sault Ste. Marie Innovation Centre have resulted in nine of the eleven people developing useful skills in information technology (IT) related areas and securing long-term employment in the region. None of the case studies included projects that involved special client groups other than youth.
A number of other projects examined through the case studies also demonstrate the achievement of this outcome. The successful creation of a multimedia animation production capability in Sudbury has resulted in the creation of about 60 jobs to date, with another 40 expected over the next few months. A number of the skilled animation positions are occupied by young people who went south to Sheridan or Algonquin Colleges for their schooling and have returned to the Sudbury area to work. The others are held by individuals from the South who have moved North for employment. All support worker positions in the company are held by local residents. This is an example of a single project contributing to all aspects of this objective and more, namely the attraction, development, retention and repatriation of human capital.
In another case, the creation of new businesses in Timmins, resulting in several hundred new retail positions will also contribute to the development and retention of human capital in the North and reduced out-migration.
top of page5.4 Has FedNor contributed to the economic development of Northern Ontario communities?
Document Review
A review of documentation indicates that several consultations and conferences have been carried out with respect to tourism in Northern Ontario. Eco-North Conferences were held in 2002 and 2004. FedNor has also supported the development of information tools to support tourism operators in marketing and planning.Footnote 14 In September 2003, consultations held with over 350 tourism stakeholders resulted in the identification of five major needs for the sector including the need for a comprehensive tourism strategy for Northern Ontario, a coordinated marketing and branding strategy with a consistent message to position Northern Ontario as a world-class tourism destination, infrastructure investment for major tourist attractions, easier access to capital for operators and business training for operators and staff.Footnote 15 In May 2004, FedNor and the Ontario Tourism Marketing Partnership Corporation (OTMPC) signed a Memorandum of Understanding to officially enter into a partnership to provide strategic support for Northern Ontario's tourism industry. The Canadian Tourism Commission (CTC) agreed to participate on a project-by-project basis and the Ontario Ministry of Northern Development and Mines (MNDM) and the Northern Ontario Heritage Fund Corporation (NOHFC) have agreed in principle to consider participating as a partner to the agreement in its second and third years.Footnote 16
Data Review
Based on the FedNor recipient database, 80% of projects (860 projects) involved community capacity outcomes. These involved total FedNor authorized assistance of 99,344,732 and total project costs of 331,854,669.
Additionally, 25% (264 projects) involved tourism outcomes. These involved FedNor authorized assistance of 22,938,651 and total project costs of 82,617,135.
Finally, 3% (30 projects) involved trade outcomes. These projects involved FedNor authorized assistance of 2,993,694 and total project costs of 2,993,694.
Interviews
Community economic development is seen to be a key area of success by interviewees. FedNor's ability to encourage and build partnerships with a variety of players is seen as a major advantage in strengthening economic development. Some interviewees commented that FedNor brings a broader, more regional perspective to local economic development initiatives. Many economic development initiatives have been targeted towards various sectors such as tourism, agriculture, mining, forestry, health and the arts. While other initiatives are community driven such as economic diversification and adjustment strategies, community strategic plans and feasability studies. Some interviewees did express concern that many smaller communities and municipalities lacked the capacity and / or resources to follow through on implementing recommendations stemming from various studies.
Recipient Survey
The survey of recipients revealed that 74% of the youth internship projects had contributed to community economic development. Some of the reported ways in which this had occurred included:
- increased visibility / marketing / awareness / promotion (25%);
- increased participation / expanded customer base (19%);
- business growth (14%);
- economic development planning (14%); and,
- employment (11%).
All other responses were provided by less than 10% of the applicable respondents.
For those who received assistance for community economic development projects, 36% of those surveyed indicated that the project had resulted in the attraction of investments to their area. This represented average investments of more than 75 million per project. Respondents also indicated that these investments were over an average period of 1.4 years. Table 22 summarizes these results.
| Investments / year | Total Investments | |
|---|---|---|
Note: The reader should interpret these numbers with care since they are based on 1) a very small number of respondents (n=14) and 2) a wide range of responses (from as little as 1,000 to as high as 1 billion). | ||
| Minimum | $1,000 | $1,000 |
| Maximum | $333 million | $1 billion |
| Mean | $24.7 million | $75.5 million |
| Sum | $345.8 million | $1.016 billion |
Additionally, 21% of community economic development project recipients surveyed indicated that their project had resulted in the attraction of businesses (i.e., private sector organizations) and / or institutions (e.g., educational, environmental, tourism and other types of institutions) to their area. In such cases, the recipients reported an average of 7.3 new businesses and 1.8 new institutions. Table 23 summarizes these results.
| New Businesses | New Institutions | |
|---|---|---|
| Minimum | 0 | 0 |
| Maximum | 41 | 12 |
| Mean | 73 | 18 |
| Sum | 80 | 14 |
Based on the survey results, the new businesses and institutions were predominantly in the following sectors:
- forestry (31%);
- retail (31%); and,
- tourism / hospitality (15%).
All other sectors were mentioned by less than 10% of the respondents (or only 1 respondent).
Case Studies
A number of the projects examined by the case studies have been community economic development projects managed by municipalities or not-for-profit economic development organizations. All these projects have the objective of improving some aspect of the business environment of the municipality or region, to help increase economic activity and maintain existing businesses or attract new ones. The various projects use a number of strategies to accomplish this goal.
Some projects, such as the development of a marketing plan to attract businesses to Timmins will have a major impact on the local economy, bringing hundreds of new jobs and millions in new construction to the region. The following table summarizes the ways in which the case studies involving economic development have impacted the community.
| Case Study | Project Description | Impact |
|---|---|---|
| GIS Strategic Plan for seven municipalities in the District of Parry Sound | Development of Strategic Plan to guideline the development and utilization of GIS and related services in the seven municipalities improved delivery of municipal services (planning, zoning, fire, police, use of natural resources) | Improved municipal planning, business development, delivery of fire, police and other services to businesses and homeowners Forestry and other natural resource planning Provide GIS and related information to potential new businesses |
| Sault Ste. Marie Innovation Centre youth internship | Youth internship for postsecondary graduates with organization developing and implementing GIS and other IT applications | Improved GIS applications for use by the municipality Supply of human capital with IT expertise for local businesses |
| Construct museum complex for Gore Bay Heritage Centre | Construction of museum complex to house museum collection, and provide a venue for local craft and cultural workshops and events | Increased tourism providing revenues to local tourist and retail businesses and local crafts people |
| Sault Ste. Marie 2003–2004 Winter Tourism Initiative | Development of 2003–2004 winter tourism promotion and marketing plan and material | Increased winter tourist traffic, providing revenues to local ski operation, snowmobiling and other tourist and retail businesses |
| Development of marketing plan and content for Timmins region | Development of marketing plan and content to promote Timmins as an attractive location for business and professionals | Attraction of Home Depot and Canadian Tire and several other smaller retail stores to Timmins, resulting in millions in new construction and several hundred new retail jobs |
| Provision of tele-medicine equipment for seven remote First Nations in North Western Ontario | Provision of tele-medicine equipment for seven remote First Nations in North Western Ontario | Improved access to health care Training of nurse practitioners |
5.5 Has FedNor helped develop business and trade skills?
Document Review
In order to assist tourism stakeholders, FedNor developed A Guide to Using Market Research and Marketing Measurement for Successful Tourism Destination Marketing. This is a step-by-step guide that provides general information about tourism market research methodologies, the rationale behind the practice, as well as the benefits and limitations of a variety of available measures.Footnote 17
Interviews
Interviewees generally had a difficult time describing FedNor's contribution to the development of business and trade skills. CFDCs indicated that they play a role in the development of business skills. Management and staff discussed FedNor's support of trade networks and advisors who work directly with firms. In some cases, FedNor has provided funds for training (e.g., supported a mystery shopper initiative and provided follow-up training to business owners, investment to establish welding labs in a community in partnership with local schools and the private sector). An increasing shortage of skilled labour was described as being a major concern for Northern Ontario particularly for resource-based and agriculture industries.
Recipient Survey
In total, 43% of surveyed recipients indicated that their projects had resulted in the development of business and trade skills in their organization. These organizations benefitted in the following ways:
- increased capability / capacity to do things in-house (20%);
- new or expanded services (17%);
- new knowledge / ideas / understanding (17%);
- better trained staff (13%); and,
- improved marketing (13%).
All other responses were provided by less than 10% of respondents.
Case Studies
None of the projects examined by the case studies were directly related to business and skills development. However, several of the case studies included provide examples of how business and trade skills are developed or transferred. The two youth internships provide examples of the development of business and technical skills by post-secondary youth during the internship period, which can then be used either within the organization after being hired, or by the graduating intern in employment at other organizations. In the case of the Sault Ste. Marie Innovation Centre, one of the youth interns brought important skills concerning the security of web-based remote access to the organization that were transferred to other staff and Centre applications.
The projects involving funding of private sector firm innovation have also contributed to this outcome. Most new employees hired by the firms have been college or university graduates in their first or second job, who are developing new technical skills and business experience.
top of page5.6 Has FedNor helped develop external markets for Northern Ontario firms?
Data Review
The FedNor database revealed that only 2% of the projects (or 22 projects) involved export outcomes. Similarly, for those completed project outcomes sheets (after the project is completed), the project officers are asked to rate, on a scale of 1 to 5, the extent to which the project contributed to increased trading opportunities. Of the 630 completed project outcomes sheets, the mean for this question was 2.4 out of 5Footnote 18. The distribution of responses is provided in Figure 1.
Interviews
In general, CFDCs and other stakeholders were very supportive of FedNor's efforts to support the development of external markets for Northern Ontario firms. It is expected that the benefits of trade missions and other work in this areas will be longer term in nature. Interviewees were aware of various international trade missions, trade shows and the role of trade advisors. A few CFDCs suggested that it would be wise to include representatives from CFDCs in future trade missions as they are often the first point of contact for local firms interested in expanding to other markets. The Northwest-Midwest Alliance, the Royal Winter Fair and Naturallia initiatives were all identified as being successful undertakings supported by FedNor.
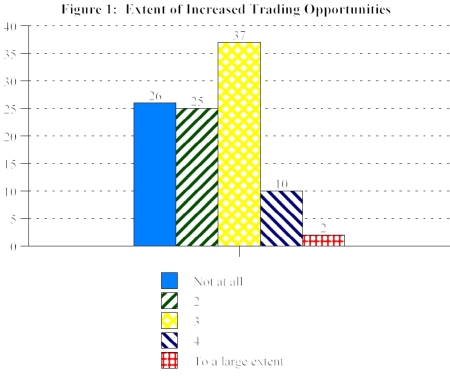
Recipient Survey
In total, 17% of surveyed recipients indicated that the project had contributed to the development of external or export markets for their organization. For those who indicated that it had, these markets were in other parts of Ontario (80%), in the United States of America (60%), in other Canadian provinces (57%) and / or in other countries (54%). These resulted in an average of 163 new clients from these new markets, for a total across all surveyed organizations of 3,430 new clients.Footnote 19
The organizations who reported benefitting from the development of external markets reported the following additional benefits:
- improved company image / exposure / marketing / raised awareness / profile (23%);
- increased sales / revenues (20%);
- employment (11%);
- new knowledge (11%); and,
- growth of organization / sustainability (11%).
All other responses were provided by less than 10% of the respondents.
Case Studies
Most of the projects examined involve public or not-for-profit organizations, and will not have direct outcomes related to export sales. However, one of the case studies involving private firms provides an example of a successful project that has already contributed to the development of an external market. March Entertainment has sold the Chilly Beach and other animation series developed with the technology funded by the NODF project to the U.S., Sweden and other countries. The other private sector project involving development of technology by Genesis Genomics will, if successfully commercialized while remaining in Thunder Bay, result in major levels of export sales from the North, estimated to be in the tens of millions of dollars over the next ten years.
top of page5.7 Has FedNor increased the use of technology? Has contributed to the development of innovation?
Document Review
With respect to results achieved in the area of telecommunications, FedNor's has identified the following key results:
- Point of Presence (PoP) in 102 communities;
- deployment of high-speed Internet in over 40 communities;
- eight regional networks servicing 85 communities; and,
- 1,000 businesses in business-to-business (B2B) activity.
In 2004, a Socio-economic Impact Study of FedNor Broadband and ICT Investments in Timmins and Cochrane District, Ontario was conducted. The study includes recommendations for assessing impacts from FedNor funded projects. The study indicated that the following economic impacts can be directly attributed to FedNor investments in the Timmins and Cochrane District region:
- 805 new full-time jobs and 1 part-time job (805.7 full-time equivalents – FTEs);
- 8 full-time and 13 part-time jobs retained that would have been lost without the investment (11.4 FTEs);
- 6.6 million in commercial / industrial expansion and operating costs; and,
- 8.6 million in expenditures associated with equipment and software installation and service.
A model was used to estimate the future effects of these impacts over the next two to four years. Based an investment of approximately 2 million made by FedNor, the following impacts are expected:
- 28.64 million increase in GDP for Cochrane District and 9.75 million increase for the Province of Ontario; and,
- 928 person years of employment for Cochrane District and 125.6 for the rest of Ontario; and 3.21 million increase in provincial tax revenues and 5 million increase in federal tax revenues.Footnote 20
Data Review
FedNor has provided assistance for 62 innovation and technology projects. This involved FedNor authorized assistance for a total of 24,348,577 and total project costs of 115,420,583.
There are 138 projects (13%) where connectedness outcomes were reported in the FedNor database. In addition, 53 (5%) involved e-commerce and 212 (20%) involved knowledge-based outcomes.
When asked to summarize the extent to which projects contributed to a greater participation in the knowledge-based economy, project officers rated their completed projects, on average, as 2.8 out of 5 in this regard. The distribution of responses is illustrated in Figure 2.
Interviews
All interviewees felt that FedNor has made major contributions to enhancing the use of technology and applications in Northern Ontario. An increasing number of rural and remote communities now have the ability to utilize technology such as the high speed Internet and cellular phone service. Enhanced telecommunications capacity bridges the communication gap and compensates for issues related to remoteness and isolation (particularly for youth who now can connect to the outside world more easily).
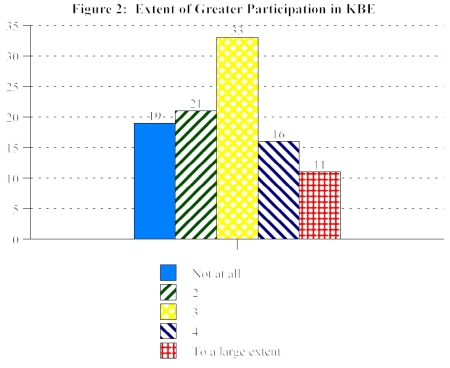
On the applications side, interviewees felt that small businesses and tourism operators are making greater use of e-commerce, web-based applications and marketing tools. Access and use of technology such as video conferencing and digital imaging capabilities have also brought huge benefits to the Northern universities and aided in the provision of health care services to remote communities. Tele-health means that patients do not necessarily need to travel long distance for medical care. Colleges and universities are now able to offer a significant number of courses on-line providing students with greater flexibility and the ability to stay in their local community while pursuing post-secondary education and training.
Recipient Survey
Surveyed recipients were asked if their organization had adopted a new technology as a result of the project. In total, 31% reported that it had. Reported benefits resulting from the adoption of this new technology included:
- new or improved services, systems or products (29%);
- exposure / marketing / credibility / image (19%);
- increased productivity or efficiency (14%); and,
- more up-to-date organization (10%).
All other benefits were provided by less than 10% of the respondents.
Surveyed recipients were also asked if the project had resulted in increased use of technology in the organization. More than half (55%) reported that it had. Reported benefits resulting from this included:
- improved productivity or efficiency (16%);
- website-related benefits (14%);
- improved communications (11%); and,
- improved skills / capacity (10%).
All other benefits were noted by less than 10% of the respondents.
In total, 39% of surveyed recipients indicated that their organization had increased its use of telecommunications as a result of the project. Resulting benefits included:
- increased reach / participation (17%);
- increased use of the Internet (17%);
- improved communications (15%);
- website-related benefits (13%); and,
- improved productivity or efficiency (10%).
All other benefits were mentioned by less than 10% of the respondents.
Finally, 38% of surveyed recipients indicated that their organization had increased its use of research and development as a result of the project. Reported benefits were widely spread and were therefore not reported in a quantified manner. However, a few verbatim responses include:
"We can use the study to encourage the province and universities to invest in the local research firm, to increase the amount of research done here."
"Increased information regarding environmental conditions."
"We went into resourcing more up-dated procedures, new ways to handle human waste."
"We now have a state-of-the-art software product that will be of great appeal in the marketplace."
"We recognized that we were performing R&D. It made us look more acutely at each project to see which components of the project actually fell under the realm of R&D."
"It allowed us to partner with local companies to jointly develop applied research."
"We developed a framework for an innovation toolkit."
"We developed new techniques and expanded to include the mining sector."
"By increasing the skills in those areas of R&D that our organization had developed."
"It's helping us identify new healthy sustainable energy."
Additionally, 38% of surveyed recipients indicated that their organization had developed an innovative product, process or service. Again, reported benefits were widely spread and therefore difficult to quantify. A few verbatim responses include:
"A wider market."
"We're producing a product that is delivered to receiving mills that is in turn creating revenues."
"It enhanced local community life."
"We sell the innovation. That would contribute to income."
"Increase sales, reduced costs."
"Organization has not benefitted as much as community has benefitted but it has broadened our base re: going into schools and broadening the curriculum there – students are exposed to art forms that they would not have otherwise been exposed to."
"Increased awareness of Northern Ontario Agri-food products. Being able to participate in new marketing initiatives."
"Through integration of other health related networks."
"Able to undertake more initiatives. Able to involve the public more in our operations."
"Increased revenues for our company."
"We're seen as being part of the leading edge in these technologies."
"Increased our relationship with First Nations and the non-timber forest products. Increased relationship with private land owners."
"We will develop aeration technology for sewage treatment."
Case Studies
The case studies included three projects that directly contributed to the development of innovative technology by private sector firms. These were the development of multimedia flash animation technology to create television content, which is being used in commercial production, and the development of mitochondrial DNA analysis capability for the early detection of cancer, which is still in the product development and testing phase. The third project involved the development of new software applications related to DNA testing. In examining the level of outcomes, it is important to keep the relative size of these three projects in mind. The multimedia project had a total budget of 5.4 million, the mitochondrial DNA project 1.72 million, and the Youth Internship 43,000.
NODF has also funded the development of innovative technical infrastructure, as a means to deliver services to the community more effectively and economically. For example, the project involving development of a GIS Strategic Plan for seven rural municipalities in the District of Parry Sound has contributed to the building of technical infrastructure related to GIS in these communities. This infrastructure will contribute to the improved, more efficient delivery of municipal services such as planning, fire, police and public utilities to taxpayers by these municipalities. Similarly, the project to fund the installation of tele-medicine equipment in seven remote First Nations is designed to help provide more effective and efficient health care services to these groups.
top of page5.8 What is the incremental impact of FedNor programs and projects?
Database Review
While the survey results will show the incremental impact of FedNor on projects, the FedNor data shows the financial project investments from FedNor funded projects. These are summarized in Table 25.
| Description | FedNor ($) | Total Project | Leveraged | % FedNor Contribution |
|---|---|---|---|---|
| Note: While the additional funds are not fully attributable to the program (in light of the fact that some recipients may still have proceeded with the project, albeit differently), they are highly attributable to the NODF because of the high incrementality as well as the fact that, in many cases, FedNor did not fund 100% of the project costs, and therefore required leveraged funds before it would approve projects. | ||||
| Studies or Implementation | ||||
| Studies | $ 16,587,046 | $ 35,680,831 | $ 19,093,785 | 46.5 |
| Implementation | $ 109,529,409 | $ 363,385,122 | $ 253,855,713 | 30.1 |
| Region | ||||
| North Eastern | $ 60,463,425 | $ 169,831,905 | $ 109,368,480 | 35.6 |
| North Central | $ 24,659,693 | $ 84,736,002 | $ 60,076,309 | 29.1 |
| North Western | $ 37,993,337 | $ 129,498,046 | $ 91,504,709 | 29.3 |
| Strategic Investments | ||||
| Business Financing | $ 15,383,930 | $ 27,483,930 | $ 12,100,000 | 56.0 |
| Telecommunications & ICTs | $ 18,731,510 | $ 50,439,013 | $ 31,707,503 | 37.1 |
| Innovation & Technology | $ 24,348,577 | $ 115,420,583 | $ 91,072,006 | 21.1 |
| Trade & Tourism | $ 17,716,965 | $ 63,827,268 | $ 46,110,303 | 27.8 |
| CED | $ 40,099,225 | $ 128,406,335 | $ 88,307,110 | 31.2 |
| Human Capital | $ 9,836,248 | $ 13,488,824 | $ 3,652,576 | 72.9 |
| Type of Organization | ||||
| SME | $ 8,809,090 | $ 16,969,576 | $ 8,160,486 | 51.9 |
| Educational | $ 15,974,564 | $ 93,114,819 | $ 77,140,255 | 17.2 |
| Other Non-Profit | $ 58,924,327 | $ 164,100,394 | $ 105,176,067 | 35.9 |
| Municipal | $ 16,627,114 | $ 57,627,160 | $ 41,000,046 | 28.9 |
| Aboriginal | $ 27,781,360 | $ 52,254,004 | $ 24,472,644 | 53.2 |
| Federal | $ 3,000,000 | $ 15,000,000 | $ 12,000,000 | 20.0 |
| Project Status | ||||
| Not completed | $ 74,514,407 | $ 224,542,314 | $ 150,027,907 | 33.2 |
| Completed | $ 51,602,048 | $ 174,523,639 | $ 122,921,591 | 29.6 |
| Total | ||||
| Total | $ 122,091,955 | $ 399,065,953 | $ 276,973,998 | 30.6 |
Interviews
As reported by the vast majority of interviewees, FedNor has made a significant impact in Northern Ontario. Interviewees commented that FedNor has leveraged significant amounts of financial support from other organizations through partnerships. Several CFDCs and stakeholders commented that many projects would not have gone ahead without the encouragement and support of FedNor. Some interviewees described FedNor as being an enabler or catalyst for economic development. Program officers indicated that incrementality has a lot to do with selecting projects that will have a multiplying effect over time. Stakeholders identified a number of projects that have demonstrated significant incremental impacts (e.g., support to the Northern Ontario School of Medicine, work with Sault Ste. Marie, West Nippissing, Wood Works, tele-health projects, NEONET, and Discover Abitibi).
There was general agreement from the vast majority of interviewees that FedNor programs are complementary to other programs available in Northern Ontario. In order to avoid potential duplication or overlap, FedNor works collaboratively with other provincial ministries and federal departments and agencies. Some interviewees felt that there is similarity in the mandates and objectives of other programs but indicated that eligibility criteria were sufficiently different that duplication and overlap were not seen to be an issue. Staff indicated that they are very familiar with their provincial and federal colleagues and as part of fulfilling due diligence requirements on specific projects the role and contribution of each party are clearly defined. CFDCs and other stakeholders also commented on the collaborative relationship that they had observed between FedNor and representatives of other programs. One interviewee emphasized the lack of resources at the municipal level for investment. The interviewee commented that it would be nice to see a federal / provincial agreement on sector development that assessed the fairness of funding formula given revenue streams back to the community (i.e., revenue back to the local tax base would occur over a much longer period than revenue generated for the provincial and federal levels through income taxes, provincial sales tax and GST).
Recipient Survey
In order to determine the extent to which FedNor played an incremental role in the ability of the funded organizations to undertake the project, survey recipients were asked about the impact on the project of not having NODF funding. The responses were categorized according to the following project incrementality principles:
- Full incrementality – the absence of NODF funding would have had a major negative impact on the project in that the organization would not have been able to proceed with it.
- Major incrementality – the absence of NODF funding would have had a major negative impact on the project but the organization may still have been able to proceed with it. However, the scope, timing, quality, etc.. of the project would have been affected.
- Minor incrementality – the absence of NODF funding would have had a minor negative impact on the project.
- No incrementality – the absence of NODF funding would have had no impact at all on the project.
Using these categories, Figure 3 illustrates that NODF is highly incremental on the projects it funds. The following statistically significant differences should be highlighted about Figure 3:
- NODF is significantly more likely to be fully incremental on studies than implementation projects;
- NODF is significantly less likely to be fully incremental on innovation and technology projects as well as human capital projects than on telecommunications and ICTs, trade and tourism, and CED projects; and,
- NODF is significantly less likely to be fully incremental for SMEs than any other type of organization.
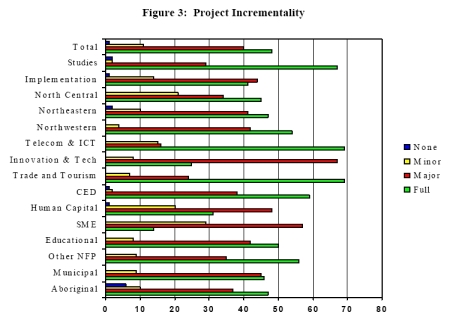
Case Studies
There was full or major project incrementality for the funding provided by FedNor for all nine of the projects examined for the case studies. For several projects, there was full incrementality. These included:
- the two youth internship projects;
- the Gore Bay museum construction project;
- the two private sector firm innovative product development projects;
- the GIS Strategic Plan for seven municipalities in the District of Parry Sound; and,
- the provision of tele-medical equipment for seven remote First Nations.
For each of these cases, the project would not have proceeded at all without FedNor funding. This was definitely true for those projects where FedNor provided 50% or more of the funding. A closer examination of the project funding the development of multimedia production in Sudbury shows that FedNor contributed 500,000 or about 9% of the total budget of 5,400,000. Because of the limited financial resources of March Entertainment, the project would not have gone ahead in the North without the contributions of each of the major funding partners, including FedNor.
For the other four projects, there was major project incrementality in that the initiative would likely have gone ahead, but with a much reduced level of effort and expected outcomes.
top of page5.9 Conclusions – Success
4. A number of NODF projects have contributed to the development and retention of new and existing businesses. Evidence suggests that NODF projects have resulted in the development of new businesses, jobs and growth in existing businesses through retained and new employees as well as increased revenues. In addition, Northern Ontario CFDCs have indirectly contributed to NODF success in this regard through the impacts of the NODF capitalization assistance. The reported impacts from this assistance include close to 500 new, more than 500 maintained and close to 350 expanded business. Northern CFDC support, resulting at least partially from NODF assistance, have also contributed to the creation of more than 2,100 job and the maintenance of almost 4,300 jobs. The program is therefore contributing to the development and retention of new and existing businesses, both directly and indirectly.
5. The NODF's contribution to the competitiveness of Northern Ontario firms is, in most cases, indirect through the Community Futures top-up and the BDC investment fund. Nevertheless, the NODF also contributes directly to this objective through its trade networks and missions as well as through projects involving the development of new or improved products, services or technologies.
6. The NODF has been successful in attracting, retaining and developing human capital in Northern Ontario. With respect to special target groups, the program has made a significant impact on youth, women, Aboriginal people and Francophones even though the projects did not necessarily target these groups.
7. The NODF has made a significant contribution to economic development in Northern Ontario through community level initiatives as well as, to some extent, sectoral initiatives. FedNor's ability to encourage and build partnerships is a major contributor to the program's success in this area.
8. Based on the evidence available for this evaluation, it is difficult to conclude on the extent to which the NODF has helped develop business and trade skills. However, the survey results and case studies indicate that the NODF has made a contribution in this area.
9. Based on the activities in support of developing external markets, the NODF has made progress in this regard. Progress has been made as a result of project-specific activities such as trade missions. Progress has also been made as a result of support provided by the trade advisors as well as through other non project-specific activities and support.
10. As a result of the projects funded under the Telecommunications and ICT as well as Innovation and Technology strategic priorities, the NODF has contributed to significant investments in this area. These investments have reached a large proportion of communities and businesses in Northern Ontario resulting in increased use of technology and the development of innovations. This has, in turn, contributed to socio-economic benefits in recipient organizations and communities.
11. The NODF has been essential in enabling a large number of organizations to undertake the funded projects. As such, the project impacts are highly attributable to the program. In addition, the design features have contributed to high leveraging of funds from other sources. Over the period of the evaluation, 122 million of NODF funding has resulted in a total of 400 million in investments in the projects. FedNor is therefore recognized as a catalyst for economic development.
Footnotes
- 11 KPMG, Evaluation of Credit Union Lending Program, November 12, 2003. (back to footnote reference 11)
- 12 KPMG, Evaluation of BDC Loan Loss Reserve, September 21, 2005. (back to footnote reference 12)
- 13 It is not possible within the scope of this evaluation to determine the reasons for these losses. Nevertheless, two out of 12 respondents indicated losses for their most recent fiscal year end whereas an additional four out of 12 reported reductions in their profitability. (back to footnote reference 13)
- 14 Mitchell, Erin and Westlake, Mitchell, A Guide to Using Market Research and Marketing Measurement for Successful Tourism Destination Marketing, June 2005, and, Research Resolutions and Consulting Ltd. Information Tools for Marketing and Planning, Tourism Volume, Value and Characteristics in Northern Ontario, Canadian International Travel Surveys, 2002. (back to footnote reference 15)
- 16 Assessing the Challenges: Summary Report of the 2003 Northern Ontario Tourism Consultations, 2003. (back to footnote reference 14)
- 15 Strategic Tourism Development and Marketing Partnership for Northern Ontario. Year 1: Progress to Date, Draft Revised January 25, 2005. (back to footnote reference 16)
- 17 A Guide to Using Market Research and Marketing Measurement for Successful Tourism Destination Marketing, 2005 (back to footnote reference 17)
- 18 Note: the average is not higher if only trade projects are selected. (back to footnote reference 18)
- 19 One respondent reported 3,000 new clients; the balance therefore represent a total of 430 new clients. (back to footnote reference 19)
- 20 Strategic Networks Group, EKOS, and Phoenix Strategic Perspectives Inc., Socio-Economic Impact Study of FedNor Broadband and ICT Investments in Timmins and Cochrane District, Ontario (p. 5). (back to footnote reference 20)
6.0 Findings – Monitoring and Accountability
6.1 Is reporting timely, reliable and complete?
Document Review
A review of FedNor Business Plans for the previous three years indicates that FedNor has enhanced its capacity in the area of performance-based planning, monitoring and reporting. For example, some noteworthy examples evident in the most recent annual Business Plans are as follows:
- planning pressures facing the program are described (e.g., funding renewal, advertising expenditures, social economy, etc.);
- outcomes, activities / outputs and for each strategic priority area are clearly identified along with budget allocations for each of the priorities;
- in most instances, performance targets are identified; and,
- a corporate management renewal action plan that addresses IC priorities in areas such as the Service Improvement Initiative, Government On-line as well as other internal priorities related to human resources and financial management and communications.
Although a review of the Business Plans for the previous years shows an increased level of sophistication in planning and analysis of FedNor's operating environment, the organization and format of the Business Plans has changed each year making it difficult to easily track progress against specific performance measures on a year-to-year basis.
Data Review
A review of the FedNor data found that, for most completed projects, the project officer had completed the required Project Outcomes and Evaluation Scoresheets. However, further analysis of this data showed that the scoresheets were completed inconsistently and incorrectly. For example:
- Questions 1 to 12 of the score sheet require yes or no answers; the instructions in the user manual specifies that the only symbols allowed in entry are "Y" or "N" and that N/A or no response are not correct entries; however, analysis of the data reveals the following problems with the responses to these questions:
- numeric values (2 or 3 in each of the 12 questions);
- ND (no data) (between 3 and 14 depending on the question);
- N/A (as many as 95 for question 2);
- the word "Excerpts" was written in one case at question 2;
- there were 36 blanks for each question; 37 blanks for question 9; and,
- therefore the correct Y/N answers were between 534 and 642 out of 683 entries.
- For questions 15 to 35, a 1 to 5 score was to be provided; the instructions in the user manual specified that no zeroes should be used except for question 33 where a "0" indicates that the questions is not applicable; however, analysis of the data reveals a range of zeroes (for all questions except question 31 – as many as 47 for question 24), blanks (between 39 and 56 blanks for all questions), 80 N/As and 4 NDs for question 33. The number of correct 1 to 5 answers (and 0 to 5 for question 33) therefore ranges between 573 and 643 out of 683.
- Another problem involves overall scores above 1.0 for those areas where computations are required.
Interviews
FedNor staff were somewhat satisfied with timeliness, reliability and completeness of reporting from clients. As would be expected, there are some clients who are very good at meeting all reporting requirements and others who are not. Program officers are very pleased with the support they receive from Payments and Monitoring and the systems in place for monitoring reporting requirements. Staff indicated that the assessment approach for ranking client risk has been useful. Officers also discussed that for new clients they make an effort to ensure that the reporting requirements are clearly understood and that they will often include a representative from Payments and Monitoring in discussions with clients at project outset to discuss procedures and answer client questions. Program officers have found the electronic reminders of when reports are due to be very useful. It was suggested by a few officers that FedNor could benefit from a full scale client relationship management system that would serve as a central database for tracking interactions with clients. Current systems are organized by project. Generally, interviewees indicated that reporting has improved but further enhancements to administrative practices should continue to be developed (e.g., an electronic payment system is under development and testing).
Interviews with CFDCs and other stakeholders revealed that there are differences in opinion with respect to how easy or difficult it is to meet FedNor reporting requirements as it relates to NODF projects. While some were generally satisfied, many felt that reporting is onerous and disproportionate to the funding received and that reporting requirements have increased exponentially in the past few years. The most significant concern expressed was that processing of payments takes too long particularly for smaller organizations that have cash flow challenges.
Recipient Survey
In total, 93% of surveyed recipients indicated that they fully understood when they were supposed to submit reports and 91% understood what information they needed to include in those reports.
6.2 Are program data reports providing FedNor useful information for management purposes and to guide future program decisions?
Interviews
FedNor management noted that, when they needed specific information for management purposes, they asked for this information. They noted that, in some cases, it was a lot of work for the people who had to provide the information, because the information was not readily available. However, management generally agreed that, if they needed information, they could get it.
6.3 Is the reporting system allowing FedNor to demonstrate the outputs and outcomes of its programs and thereby to meet accountability requirements?
Interviews
FedNor management noted that performance monitoring was still in various stages of development for a range of valid reasons. These included: recent changes to the FedNor RMAF which has implications related to the performance measurement system; changes to the departmental system; new staff / changes in the staff involved in the further development of performance measurement tools; and conflicting priorities.
While all managers interviewed agreed that a lot of progress had been made over the last several years, the key issues raised by some managers were:
- Project Outcomes and Evaluation Scoresheets : There is no link between the project objectives, as stated in the applications, and the project outcomes reports that are completed by the project officers. Additionally, these are completed to varying degrees of accuracy depending on the officers. Finally, the scoresheet has not been updated in quite some time and is not linked to the program's outcomes as outlined in the NODF's logic model.
- Departmental System : There are noted difficulties in working with the Industry Canada departmental system for capturing and analysis of information on projects. The system does not provide the flexibility required to easily capture outputs and outcomes that are specific to NODF. A separate NODF database may be helpful if this issue cannot be appropriately addressed.
- Lack of Baseline Data : At the project level, the tools are not available to collect baseline data and to thus be able to measure the impacts of the projects (e.g., socio-economic impacts of tourism projects). Additionally, many clients do not have the capacity to do this appropriately. Even though it may be ineffective to attempt to do this for all areas, it could be strategically important to do it for key program areas and to thus be able to show program progress (not necessarily project progress) in these key areas.
- Ad Hoc Information : while it is important to ensure that FedNor has quantitative performance information, this information is not necessarily required on an ongoing basis and it may not be feasible to collect it on an ongoing basis. Ad hoc information is extremely useful for ongoing management and should not be ignored.
FedNor staff were less familiar with the performance measurement system currently in place for the NODF. Most seemed to be unaware of how project specific results are integrated or interpreted on a more macro level. Some felt that the current score sheet that is completed by officers at the end of projects needs to be revamped and should include room for anecdotal and interpretative information. Some officers also indicated that more work should be done with project proponents at the outset to discuss the importance of performance data to instill awareness and emphasize FedNor's commitment to results-based management.
6.4 Conclusions – Monitoring and Accountability
12. FedNor has improved its capacity in terms of planning for results. For example, the recent Results-based Management and Accountability Framework (RMAF) is providing management with a better tool for measuring performance. The planning process is more closely linked to the NODF's performance management requirements. FedNor has also invested more resources into this, as evidenced by staff which are dedicated to performance monitoring. Additionally, FedNor has undertaken special studies to review specific aspects of the program (for example, the Youth Internship Program and post evaluations of trade missions). With respect to projects, officers are meeting their requirements in terms of assessing project risk and completing the project outcomes scoresheets. Additionally, with respect to the program as a whole, there is evidence of a lot of analysis and reporting of the data that is currently available.
However, the RMAF does not fully reflect the present design and delivery of the NODF. The existing tools and systems have not been updated to reflect the performance measurement requirements outlined in the recent RMAF. Additionally, it is unclear if the information collected from the project outcomes scoresheets is valid and reliable. It is also unclear if program officers clearly understand how to complete the scoresheets. The departmental systems for capturing and analyzing project information remains poorly aligned with NODF requirements. Finally, the departmental system is not aligned with the project outcomes scoresheets. Therefore, it is difficult to clearly determine the extent to which projects are achieving their intended outcomes.
13. The Industry Canada departmental systems (i.e. the Grants and Contribution Reporting System – GCRS which draws upon the information in the Contribution Management Information System – CMIS) to capture information on projects is inadequate to meet the monitoring and accountability requirements of FedNor with respect to the NODF. It currently does not provide the flexibility required to capture the intended and actual results of projects as outlined in the program's RMAF. Additionally, since RMAFs are intended to be "living" documents, program results can change over time, particularly for a program such as the NODF. The Industry Canada departmental system is not currently flexible enough to provide FedNor with the ability to adjust the fields in the database as the program evolves to better reflect the changing needs of Northern Ontario communities.
7.0 Findings – Alternatives, Cost-Effectiveness and Lessons Learned
7.1 Are there alternative service delivery approaches that would increase the cost-effectiveness of FedNor programming?
Document Review
A formative evaluation study of FedNor conducted in 2002 also dealt with the issue of whether there might be more cost-effective ways of delivering FedNor. The evaluation concluded that based on input from clients, staff and experts, FedNor is providing relevant, largely unique services in a flexible, client-friendly manner. FedNor improves its cost-effectiveness by co-funding projects with other public sector partners as well as the client. The wide range of programs and services provided by FedNor directly and through partnerships was seen as a strength.
Data Review
As previously noted, FedNor has been able to leverage an extensive amount of money in the projects it funds. While it funds up to 100% of the project cost, it also funds as little as 1% of the total project cost. Overall, FedNor's contribution to projects is in the 30% range. Therefore, over the three years included in the scope of this evaluation, the NODF has authorized assistance totaling more than 122 million for projects totaling close to $400 million. Overall, for every dollar invested by FedNor, another 2.28 are invested by others.
Interviews
FedNor managers did not believe that there was another service delivery approach that could work better than the NODF approach. Some of the identified strengths included its geographic delivery and its flexible approach to decision-making. Nevertheless, FedNor is currently putting in place a new group which will be responsible for gathering and analysing information that will provide FedNor with much needed tools to make more strategic investments in certain sectors of importance to Northern Ontario. It is believed that this should help FedNor be more effective in its delivery.
In terms of cost reduction with similar results, a range of thoughts were brought forth by managers, but all were somewhat unique. This included:
- With the addition of other initiatives such as the Social Economy initiative, the Eastern Ontario Development Fund, the Softwood Lumber initiative, and others, some administrative costs previously fully borne by the NODF have now been spread across several programs. This has therefore reduced the overall administrative cost of delivery of the NODF.
- On the other hand, one manager though that these initiatives just added burden on the organization, with few benefits associated with the FedNor mandate.
- One manager thought that the administrative burden associated with small projects, including youth internships, could be more cost-effectively administered through contribution agreements with the CFDCs.
The vast majority of other interviewees could not identify an alternative service delivery approach that could work better than the current model. Stakeholders support the current model and most appreciate the role played by program officers and value their input and advice. They valued the knowledge, experience and participation of FedNor at the local level and felt that this was a major reason for the programs success. There were three areas of concern expressed by CFDCs and other stakeholders. Firstly, several interviewees felt that FedNor needs to raise awareness of its priorities and programs within some communities. Secondly, concern was also expressed that there is inconsistency in the level of service provided by program officers and also that there is inconsistency with respect to the interpretation of project selection criteria and reporting requirements. Lastly, there is still some concern that the turnaround time on proposals and payments is too slow.
Staff offered a few suggestions for increasing cost-effectiveness. For example, it was suggested that FedNor:
- improve its database of project outcomes so that they could be used by officers to benchmark anticipated results for new projects;
- implement a client management system so all officers have centralized access to information on clients;
- ensure staff has access to current office applications;
- focus on sector support as well as geographic;
- implement an electronic claims system;
- communicate roles and responsibilities of different groups within the organization structure so that staff has a better overall understanding; and,
- share the strategic plan with all staff.
Recipient Survey
There are several interesting survey findings related to alternatives and cost-effectiveness. These include:
- the current availability of alternative sources of funding in Northern Ontario;
- incrementality versus results;
- leveraging; and,
- possibilities to fund less.
Availability of Alternative Sources of Funding
When asked if they were aware of other programs or services of the federal or provincial government which are comparable or similar to NODF and which is available in Northern Ontario, 47% said yes. Comparable programs or services mentioned include:
- Northern Ontario Heritage Fund (65%);
- Human Resources and Skills Development Canada (16%);
- Trillium Foundation (13%); and,
- Northern Development and Mines (10%).
All other programs were mentioned by less than 10% of respondents.
When asked how the NODF compared to these other programs and services, 48% said it was better (or much better), 42% noted that it was about the same and 10% indicated that the NODF was poorer (or much poorer) than these others.
Incrementality Versus Results
As previously noted, in most cases NODF assistance is critical to the ability of the organization to undertake the project as planned. Close to half (48%) of the projects would not have occurred without FedNor's involvement.
This means that the project results are highly attributable to NODF funding. As previously noted, NODF projects have been highly successful in achieving intended results. These results are summarized as follows:
- development of new businesses – 23% incidence resulting in an average of 13.1 jobs per project with new businesses
- average increase in full-time employment of SMEs of 1.5 full-time employees and 0.75 part-time employees;
- 53% of SMEs reported that they were able to retain, on average, 2.6 full-time
- SMEs reported a mean increase in gross revenues of close to 200 thousand;
- 55% of SMEs reported that they had grown in other ways;
- 75% reported the development of an innovative product, process or service;
- 49% attracted, on average, 3.0 new staff to their organization, including 1.2 youth, 1.3 women, 0.7 Aboriginal people, and 0.6 Francophones;
- 39% retained, on average, 5.2 existing staff within their organization, include 0.7 youth, 1.7 women, 1.2 Aboriginal people and 0.5 Francophones;
- 72% of youth interns found on-going employment after the internship, 86% of those in Northern Ontario;
- 74% of youth internship projects contributed to community economic development;
- 36% of community economic development projects resulted in the attraction of, on average per project, 24.7 million in investments;
- 21% of community economic development projects resulted in the attraction of, on average per project, 7.3 new businesses and 1.8 new institutions;
- 43% of surveyed recipients indicated that their projects had resulted in the development of business and trade skills in their organization;
- 17% of surveyed recipients indicated that the project had contributed to the development of external or export markets for their organization, resulting in an average of 163 new clients per organization;
- 31% of surveyed recipients indicated that their organization had adopted a new technology as a result of the project;
- 55% of surveyed recipients reported that the project had resulted in increased use of technology in their organization;
- 39% of surveyed recipients reported that their organization had increased its use of telecommunications as a result of the project; and,
- 38% of surveyed recipients indicated that their organization had increased its use of R&D.
Leveraging
As previously noted, the NODF projects have involved significant leveraged funds from other sources. Based on the survey results, these are as per Table 26.
| Source | Average | % |
|---|---|---|
| FedNor | $ 118,707.99 | 11.6 |
| Funded organization | $ 329,753.80 | 32.4 |
| Other federal government funding, excluding FedNor | $ 199,749.89 | 19.6 |
| Provincial government funding | $ 163,788.50 | 16.1 |
| Private sector contribution | $ 192,132.07 | 18.9 |
| Contribution from not-for-profit sector | $ 15,053.25 | 1.5 |
| Total project cost | $ 1,019,185.50 | 100.0 |
The table shows that FedNor is not the largest average contributor to the total project cost. Nevertheless, as previously noted, FedNor is critical to the organization's ability to undertake the project as planned.
Possibilities to Fund Less
Recipients were asked if they would have gone ahead with the project if FedNor assistance had been smaller. Only 37% said that they would while 40% stated that they would not and 23% were unsure. Therefore, 40% of clients would not have proceeded with the project if FedNor had provided less financial assistance. In those cases, FedNor therefore funded the bare minimal that was required to ensure that the project took place.
Additionally, in cases where the recipients indicated that they would have gone ahead, this would not have come without an impact on the project. That is:
- 51% said the start of the project would have been delayed;
- 57% said it would have taken more time to complete the project;
- 73% stated that the scope of the project would have been reduced; and,
- 69% noted that the quality of the project would have been affected.
This indicates that, from a cost perspective, FedNor funding could not be reduced without affecting the effectiveness of the projects.
top of page7.2 What lessons have been learned from FedNor programming for the future
Interviews
Most of the reported lessons learned were more suggestions for improvement. Comments made by FedNor staff indicate strong support and pride in the program. Lessons learned and some suggestions for improvement from staff included:
- availability of specialist knowledge works well but there is a need for more targeted strategies for specific sectors (particularly for tourism which was described as a fragmented industry) and it is important to emphasize a pan-northern view;
- give more recognition of the social development sector and develop strategies to support this sector as a key component of a healthy community;
- support strategies, not just projects, to have the greatest impact over time;
- should have greater focus on continuous improvement and sharing best practices for officers across all of Northern Ontario;
- attention to detail on specific projects is key to success – progress has been made regarding accountability and monitoring but FedNor needs to focus on meaningful performance measures that are realistic to collect;
- critically important to invest time at the early stages of project development;
- flexibility of FedNor programs leads to success – the cookie cutter approach taken by other programs does not work – the needs are too diverse;
- need to balance the level of scrutiny we give to small projects versus large projects;
- need to invest more time and resources on client after-care;
- continuous in-take of applications helps make us successful and more responsive to community needs;
- success of the program is highly dependent on individual staff and personality. Need to ensure greater consistency in how officers deal with clients and provide training where necessary on interpersonal skills and client service; and,
- clarify roles and responsibilities of internal groups for all staff.
CFDCs made the following comments:
- flexibility of FedNor programs is critical to success;
- it would be a different world without top-ups on Community Futures investment funds;
- should be someway to make longer term commitments to economic development and youth internship as many initiatives take longer to develop;
- have learned to plan ahead and expect delays on applications – would like faster turnaround time on project approvals and payments;
- need to improve communications in the community on FedNor programs and services;
- would like to see a specific development strategy for Northern Ontario so we could measure ourselves against it;
- provide more direct funding to CFDCs and give them more discretion on projects;
- increase the local presence of FedNor program officers and provide greater consistency with respect to what ideas do / do not get approved; and,
- economic development priorities should be more bottom-up – sometimes feel like we have to force fit FedNor priorities into our business plan with no additional resources (e.g., social economy agenda is unclear).
Stakeholders expressed similar concerns with respect to turnaround times on applications and payments, as well as raising awareness of FedNor programs in general. They also offered the following suggestions for improvement:
- in the case where a strategic plan is in place, it would be helpful for FedNor to indicate up front on areas where it could provide support rather than have proponents take time on preparing inappropriate submissions;
- put extra effort into assisting smaller organizations to cope with reporting requirements and paperwork as it can be overwhelming for some – forms can be a deterrent to smaller organizations applying for support;
- should not forget the role and contribution of natural resources to the economy – would like a policy to support these industries and bring our experts home from other countries;
- need a policy to support agriculture that promotes the environment and quality of community;
- extend flexibility of term for youth interns;
- FedNor should be careful not to fund competing organizations of clients (particularly in the tourism marketing area);
- provide clients with feedback on project deliverables (e.g., feasibility reports);
- access to capital for private sector is still a major challenge;
- have all Program Officers play by the same rules and guidelines;
- would like a yearly meeting with FedNor to review previous projects, assess criteria and results achieved as well as discuss FedNor's vision and priorities to see how they link to our own;
- as a not-for-profit organization we have learned to be more business oriented in our thinking as a result of involvement with FedNor;
- important to communicate to the public more information regarding FedNor's mandate, priorities and areas of success; and,
- FedNor should do more economic research and increase its focus on key performance indicators and strategic outcomes.
Recipient Survey
The responses from the survey of recipients regarding lessons learned were wide ranging. In total, 35% reported a positive lesson learned about their experience with FedNor, 17% reported a negative lesson learned about their experience with FedNor and 18% reported a general lesson from their experience that is neither positive nor negative. The other lessons learned were related to the project or to something else (e.g., economic development principles).
Case Studies
There were a number of different lessons learned for the projects examined. The most commonly reoccurring lesson was the need for a project champion, someone with a vision, who believed deeply in the objective and had a willingness to work through adversity to achieve success.
In a case related to youth internships, one of the organizations, the Sault Ste. Marie Innovation Centre has had good success in keeping the interns in the region, first having them accept post-internship employment with the Centre and then having most of the ones who left the Centre remain in the city. Of the total of 11 interns that have come to the Innovation Centre, nine are still in the city, including three at the Centre. According to managers at the Centre, they make a special effort to select interns who are committed to remaining in the North. Perhaps FedNor should consult with the Innovation Centre to see if there is anything about their selection procedures that can be shared with FedNor project officers and through them incorporated into the intern selection procedures.
top of page7.3 Are FedNor programs being developed and delivered considering the needs of official language minority communities (OLMCs)?
Document Review21
FedNor has a long history of integrating Francophone needs within NODF programming, from Dialogue sessions undertaken with Francophone communities (1999–2000), to delivery of staff training and awareness sessions on official languages (2001–2002), to participation in Industry Canada consultations in Sudbury with Francophones (November 2001), and participation in development of a dedicated Official Language Economic Development initiative that was funded through the March 2003 Government of Canada Action Plan on Official Languages.
In May 2002, FedNor's formative program evaluation concluded that FedNor's programs and services are well aligned to meeting the needs of its targeted groups (including Francophones), that FedNor is reaching its intended target groups, and that it is increasing the participation of Francophones and other target groups through projects specifically targeted at those groups or through projects that reach those groups while not specifically targeting them. The report recommended that FedNor continue to offer programs and services that are broad-based, flexible and accessible to a wide range of clients and that it continue to make special efforts to meet the needs of target groups. Stakeholders commented that one of the positive impacts of FedNor has been the recognition of Northern Ontario as a bilingual region. In Thunder Bay, stakeholders pointed to FedNor's role in developing capacity in the Francophone community and helping the community to organize itself.
Since then, in the delivery of its programs and through financial contributions to Francophone and bilingual organizations, FedNor continues to respond to needs identified by the Francophone communities themselves. FedNor has supported the efforts of Francophone community groups that are endeavouring to stimulate innovation, increase the presence of Francophones in the knowledge economy, encourage community economic development and entrepreneurship, promote the growth of small business, the expansion of tourism, the integration of youth, and finally, ensure that communities are well connected.
FedNor has also continued its efforts to address the needs of the Francophone community, as outlined in detail, through annual Section 41 Achievement Reports, Annual Reviews and Administrative Reviews.
FedNor maintains ongoing dialogue with Francophone clients and representatives of Francophone organizations, to remain current on their needs and priorities. For example:
- FedNor dialogues with Francophone clients and representatives of Francophone organizations, on an ongoing basis, through FedNor program officers who have a strong local presence and ongoing dialogue with their Francophone clients, to whom they provide assistance in developing projects specifically designed to meet the needs of this community;
- Through representatives such as its Official Languages Champion and its Official Languages Coordinator, FedNor also participates in various consultations at national, provincial and regional levels, including the National Committee for Canadian Francophonie Human Resources Development (RDÉE-Canada ) ; the Joint Committee of the Regroupement de développement Économique et d'employabilité (RDÉE-Ontario ) and its regional consultations; departmental and interdepartmental consultations with OLMCs; official languages symposiums, and attendance at various conferences and AGMs. These forums contribute to maintaining open communications between OLMCs and FedNor representatives, helping to enhance awareness of, and response to, OLMC needs.
To facilitate consideration of official languages in its planning activities, in 2002–2003, FedNor identified a Champion for Official Languages within FedNor's management team and Sectoral Official Languages Leads at the program officer level.
In 2003–2004, significant resources were invested in the initial development of new program, communications and outreach initiatives under the Government of Canada Action Plan, the fruits of which are now coming on stream, as outlined below. These initiatives will help ensure that our programming continues to remain in line with the needs of the Francophone community.
While a 2004–2005 staff training session focussed on linguistic tools, plans are in place to coordinate annual staff training sessions on various official languages aspects, including awareness of the particular needs of OLMCs.
Last fall (2005), FedNor produced a publication specifically designed to underline success stories regarding FedNor partnerships with OLMCs, to enhance awareness in OLMCs of programming available to them.
On an ongoing basis, FedNor shares with staff various information and working tools to assist them and their clients in addressing the needs of Francophones (e.g. information on programs that target Francophones; developments within Francophone community; resource documents on providing bilingual services, links to websites of Francophone organizations, strategic plans of Francophone communities/organizations)
More recent initiatives that were in development during the period of the evaluation, also include the following:
- In May 2005, FedNor staffed its first dedicated Official Languages Coordinator position to provide dedicated support to official languages planning and promotion activities relative to official language minority communities;
- a new OLMC Consultation Plan is designed to enhance dialogue with OLMCs and foster a common understanding of the special considerations that OLMCs want us to consider when developing programs and services;
- the upcoming OLMC Program Promotion and Consultation Tour is an opportunity to identify what's important to OLMCs today. The tour will also enhance awareness in OLMCs of our programs. Consultation findings will be shared with FedNor management and staff to help keep them to date on current OLMC needs and priorities.
Database Review
An analysis of the database for the years covered by this evaluation shows that the average FedNor authorized assistance for projects identified as being targeted to Francophone communities is significantly lower than the authorized assistance to those not targeted to Francophones. Table 27 summarizes the FedNor data that was provided.
1The average FedNor to Francophone projects is significantly lower than the FedNor to non-Francophone projects, statistically speaking. (Return to text) 2The average % FedNor contribution is not significantly different between the two groups.. (Return to text) | |||
| Description | OLMC Target | Non-OLMC Target | Total |
|---|---|---|---|
| # of projects | 63 | 1012 | 1075 |
| % of total projects | 5.9% | 94.1% | 100.0 % |
| Average in authorized assistance1 | $57,223 | $121,059 | $113,574 |
| Total in authorized assistance | $3,605,053 | $122,511,402 | $122,091,955 |
| % of total authorized assistance | 3.0% | 100.3% | 100.0% |
| Average % FedNor contribution of project cost2 | 65.6% | 64.7% | 64.8% |
Interviews
Interviewees felt that FedNor programs are being developed and delivered considering the needs of official language minorities. Stakeholders were very aware of FedNor's expectations for bilingual communications related to projects (e.g., advertisements, press releases and other project deliverables). A few commented that FedNor also takes a common sense approach with respect to managing translation costs.
Nevertheless, two Francophone interviewees were of the opinion that, while FedNor has made efforts to provide services in both official languages, and provided funding to Francophone communities, little had been done to specifically integrate the needs of OLMCs into FedNor programming.
top of page7.4 Conclusions – Alternatives, Cost-Effectiveness and Lessons Learned
14. There are currently no alternative service delivery approaches for the NODF that would produce the same results at a lower cost. Currently, a significant proportion of the project costs are leveraged through other sources. FedNor collaborates extensively with other organizations to ensure that NODF funding complements rather than duplicates the contributions of these other sources of funding. The due diligence exercised by the program officers and program management to ensure that NODF cost-effective investments in Northern Ontario (i.e., the right level of funding and the right leveraging for strategically needed projects) is very comprehensive and effective. Additionally, a large proportion of clients would not proceed with their projects if lower levels of funding were provided by FedNor. It is therefore evident that FedNor is managing NODF costs appropriately. The projects are contributing to the achievement of their intended outcomes. It is therefore evident that the NODF is effective in achieving success. Overall, the program is therefore managed in a cost-effective fashion.
15. The critical success factors of the NODF are its flexibility, its staff, the partnerships it helps develop and its local presence.
16. FedNor's strategic focus is key to its continued relevance. This includes the need for specific strategies to address sectoral needs (including natural resources). Additionally, a means of ensuring that clients are aware of the NODF's strategies would also be beneficial.
17. Ongoing staff development is critical to the NODF's continued success. This includes training as required, means of ensuring that best practices (and lessons learned) are shared, clear roles and responsibilities. This will lead to more consistency in dealing with clients.
18. The Northern Ontario Community Futures Development Corporations believe they should be more involved in the delivery of some of the NODF programming, in particular, in the trade missions that affect their clients and, possibly in other aspects of projects.
19. The Youth Internship Program may benefit from increased flexibility, such as: permitting the overlap of interns where appropriate; longer term internships; as well as, the possibility of just an internship program rather than a youth internship program.
20. FedNor has been committed to providing services in both official languages. There is also evidence of significant activity by FedNor in consulting with official language minority communities (OLMC) to ensure that their needs are integrated into NODF programming. However, based on stakeholder perceptions as well as some of the program data, FedNor needs to continue to evolve to ensure that it meets the unique needs of OLMCs.
21 Note: The information provided in this section was taken directly from a paper provided by FedNor staff.(Return to reference 21)
8.0 Conclusions and Recommendations
The conclusions presented throughout this report are reiterated in Table 28 with their ensuing recommendations.
| Conclusions | Recommendations |
|---|---|
| 8.1 Relevance | |
Conclusion 1 The economy of Northern Ontario continues to struggle with economic development issues. NODF strategic priorities are relevant and adapted to these economic development issues. Additionally, the projects are relevant in their objectives and meet the criteria established by FedNor. The key aspects of NODF which make the program particularly relevant are:
| Recommendations 1 FedNor should continue to adapt the NODF to the changing economic development needs of Northern Ontario. In particular, it should continue to develop strategic approaches that address pan-Northern and / or sectoral needs. |
| 8.2 Staff Support | |
Conclusion 2 The role of FedNor staff, in particular of program officers, is critical to the successful planning, development and implementation of projects. There are several key aspects with respect to staff support that contribute to this success:
However, there are concerns with some aspects of the support provided in terms of project implementation, monitoring and follow-up. These concerns include:
| Recommendations 2 FedNor should ensure that program officers are aware of the extent of their roles and responsibilities, and that they recognize the areas where flexibility is required versus the areas where consistency is needed. This could be done through more frequent communications via various policy bulletins, training, meetings and other forms of communications amongst program officers as well as between officers and management. Recommendations 3 FedNor should assess the workload distribution of program officers in terms of the time they spend on NODF project planning activities, project implementation and monitoring activities, and project follow-up activities. This assessment should also examine the time spent on other non-NODF activities and tasks. Based on the result of this assessment, FedNor should make the appropriate adjustments, as required, to ensure an appropriate balance in the time spent on these tasks. |
Conclusion 3 All priorities outlined in the Service Improvement Initiative plan have been successfully addressed except with respect to the turnaround time on payments. However, the turnaround time on payments is no longer assessed as being a service improvement priority, from the clients' perspective. This is due to the fact that clients are slightly more satisfied with FedNor's performance on this and they do not believe this to be as important a service feature as it was in earlier years. | Recommendations 4 FedNor should continue to monitor various aspects of its services and to adapt its service improvement priorities as required. The recommendations included in the 2004/05 Service Improvement Initiative report are still relevant in that, not much improvement can be achieved in terms of client satisfaction. Nevertheless, client expectations could be better managed through the establishment of published service standards. |
| 8.3 Success | |
Conclusion 4 A number of NODF projects have contributed to the development and retention of new and existing businesses. Evidence suggests that NODF projects have resulted in the development of new businesses, jobs and growth in existing businesses through retained and new employees as well as increased revenues. In addition, Northern Ontario CFDCs have indirectly contributed to NODF success in this regard through the impacts of the NODF capitalization assistance. The reported impacts from this assistance include close to 500 new, more than 500 maintained and close to 350 expanded business. Northern CFDC support, resulting at least partially from NODF assistance, have also contributed to the creation of more than 2,100 job and the maintenance of almost 4,300 jobs. The program is therefore contributing to the development and retention of new and existing businesses, both directly and indirectly. | Recommendations 5 FedNor should continue to address the economic development needs of Northern Ontario through its broad range of strategic priorities as these are contributing to the wide ranging impacts of the NODF.. |
Conclusion 5 The NODF's contribution to the competitiveness of Northern Ontario firms is, in most cases, indirect through the Community Futures top-up and the BDC investment fund. Nevertheless, the NODF also contributes directly to this objective through its trade networks and missions as well as through projects involving the development of new or improved products, services or technologies. | |
Conclusion 6 The NODF has been successful in attracting, retaining and developing human capital in Northern Ontario. With respect to special target groups, the program has made a significant impact on youth, women, Aboriginal people and Francophones even though the projects did not necessarily target these groups. | |
Conclusion 7 The NODF has made a significant contribution to economic development in Northern Ontario through community level initiatives as well as, to some extent, sectoral initiatives. FedNor's ability to encourage and build partnerships is a major contributor to the program's success in this area. | Recommendations 6 FedNor should keep the requirement for high involvement of other partners and communities in the NODF funded projects as these are also important to the success of the projects and program. Recommendations 7 FedNor should also enhance its support of sectoral initiatives as these are important to the economic development of Northern Ontario communities. |
Conclusion 8 Based on the evidence available for this evaluation, it is difficult to conclude on the extent to which the NODF has helped develop business and trade skills. However, the survey results and case studies indicate that the NODF has made a contribution in this area. | |
Conclusion 9 Based on the activities in support of developing external markets, the NODF has made progress in this regard. Progress has been made as a result of project-specific activities such as trade missions. Progress has also been made as a result of support provided by the trade advisors as well as through other non project-specific activities and support. | |
Conclusion 10 As a result of the projects funded under the Telecommunications and ICT as well as Innovation and Technology strategic priorities, the NODF has contributed to significant investments in this area. These investments have reached a large proportion of communities and businesses in Northern Ontario resulting in increased use of technology and the development of innovations. This has, in turn, contributed to socio-economic benefits in recipient organizations and communities. | |
Conclusion 11 The NODF has been essential in enabling a large number of organizations to undertake the funded projects. As such, the project impacts are highly attributable to the program. In addition, the design features have contributed to high leveraging of funds from other sources. Over the period of the evaluation, 122 million of NODF funding has resulted in a total of 400 million in investments in the projects. FedNor is therefore recognized as a catalyst for economic development. | Recommendations 8 FedNor should continue its practice of appropriately balancing its requirements that NODF funding be incremental to the recipient organization's ability to undertake the projects as well as requiring an appropriate level of leveraging on projects. |
| 8.4 Monitoring and Accountability | |
Conclusion 12 FedNor has improved its capacity in terms of planning for results. For example, the recent Results-based Management and Accountability Framework (RMAF) is providing management with a better tool for measuring performance. The planning process is more closely linked to the NODF's performance management requirements. FedNor has also invested more resources into this, as evidenced by staff which are dedicated to performance monitoring. Additionally, FedNor has undertaken special studies to review specific aspects of the program (for example, the Youth Internship Program and post evaluations of trade missions). With respect to projects, officers are meeting their requirements in terms of assessing project risk and completing the project outcomes scoresheets. Additionally, with respect to the program as a whole, there is evidence of a lot of analysis and reporting of the data that is currently available. However, the RMAF does not fully reflect the present design and delivery of the NODF. The existing tools and systems have not been updated to reflect the performance measurement requirements outlined in the recent RMAF. Additionally, it is unclear if the information collected from the project outcomes scoresheets is valid and reliable. It is also unclear if program officers clearly understand how to complete the scoresheets. The departmental systems for capturing and analyzing project information remains poorly aligned with NODF requirements. Finally, the departmental system is not aligned with the project outcomes scoresheets. Therefore, it is difficult to clearly determine the extent to which projects are achieving their intended outcomes. | Recommendations 9 FedNor should further refine the NODF RMAF to more accurately reflect the program priorities. The performance reporting systems and tools should also be refined to meet the requirements outlined in the RMAF. In brief, the NODF RMAF would benefit from the following enhancements:
The revised RMAF should feed directly into the revisions of existing tools and systems as well as the development of new tools and systems as required. For example, the outcomes captured on NODF projects in the departmental system should match the outcomes in the RMAF. This is not presently the case. For example, the database captures community capacity, connectedness, e-commerce, export, knowledge-based, tourism and trade outcomes. These are currently not directly linked with neither the program priorities nor the outcomes identified in the program logic model. Similarly, what is measured in the project outcomes scoresheet is not reflective of the logic model outcomes nor of the indicators in the performance measurement plan. Specific instructions on how to specifically complete the project outcomes scoresheets as well as on what is required from the program officer to ensure that the ratings in the scoresheet are reliable must be developed and a means for ensuring data quality and integrity needs to be implemented. |
Conclusion 13 The Industry Canada departmental systems (i.e. the Grants and Contribution Reporting System – GCRS which draws upon the information in the Contribution Management Information System – CMIS) to capture information on projects is inadequate to meet the monitoring and accountability requirements of FedNor with respect to the NODF. It currently does not provide the flexibility required to capture the intended and actual results of projects as outlined in the program's RMAF. Additionally, since RMAFs are intended to be "living" documents, program results can change over time, particularly for a program such as the NODF. The Industry Canada departmental system is not currently flexible enough to provide FedNor with the ability to adjust the fields in the database as the program evolves to better reflect the changing needs of Northern Ontario communities. | Recommendations 10 FedNor should consult with Audit and Evaluation Branch (AEB) and the Information Management Branch (IMB) which is responsible for GCRS and CMIS to ensure that the departmental systems provide FedNor management with the flexibility it requires to appropriately capture the performance information it needs to better meet its monitoring and accountability requirements. If the required flexibility cannot be incorporated into the existing / new system, then FedNor should discuss other options with AEB and IMB regarding linking the FedNor system to ensure that all monitoring and accountability information can be captured and linked without requiring duplication. |
| 8.5 Alternatives, Cost-Effectiveness and Lessons Learned | |
Conclusion14 There are currently no alternative service delivery approaches for the NODF that would produce the same results at a lower cost. Currently, a significant proportion of the project costs are leveraged through other sources. FedNor collaborates extensively with other organizations to ensure that NODF funding complements rather than duplicates the contributions of these other sources of funding. The due diligence exercised by the program officers and program management to ensure that NODF cost-effective investments in Northern Ontario (i.e., the right level of funding and the right leveraging for strategically needed projects) is very comprehensive and effective. Additionally, a large proportion of clients would not proceed with their projects if lower levels of funding were provided by FedNor. It is therefore evident that FedNor is managing NODF costs appropriately. The projects are contributing to the achievement of their intended outcomes. It is therefore evident that the NODF is effective in achieving success. Overall, the program is therefore managed in a cost-effective fashion. | See recommendations 5 to 8 under Success. |
Conclusion 15 The critical success factors of the NODF are its flexibility, its staff, the partnerships it helps develop and its local presence. | See recommendations 1 to 8 under Relevance, Staff Support and Success. |
Conclusion 16 FedNor's strategic focus is key to its continued relevance. This includes the need for specific strategies to address sectoral needs (including natural resources). Additionally, a means of ensuring that clients are aware of the NODF's strategies would also be beneficial. | Voir les recommandations 1 et 7 sous Pertinence et Succès. Recommendations 11 The new group responsible for gathering market intelligence for FedNor and helping to develop strategies in light of this market intelligence should take due consideration of this lesson learned. |
Conclusion 17 Ongoing staff development is critical to the NODF's continued success. This includes training as required, means of ensuring that best practices (and lessons learned) are shared, clear roles and responsibilities. This will lead to more consistency in dealing with clients. | See recommendation 2 under Staff Support. Recommendations 12 FedNor should continue to have regular organization-wide or strategically driven events aimed at sharing best practices and lessons learned. |
Conclusion 18 The Northern Ontario Community Futures Development Corporations believe they should be more involved in the delivery of some of the NODF programming, in particular, in the trade missions that affect their clients and, possibly in other aspects of projects. | Recommendations 13 While there are currently no alternative service delivery approaches for the NODF, FedNor should further explore the possibilities of involving 3rd parties more extensively in the delivery of the NODF to ensure that it continues to maximize its cost-efficiency. Recommendations 14 FedNor should ensure that, to the extent feasible, all Northern Ontario CFDCs are invited to participate in its NODF trade missions, particularly if clients in their delivery region are participating. |
Conclusion 19 The Youth Internship Program may benefit from increased flexibility, such as: permitting the overlap of interns where appropriate; longer term internships; as well as, the possibility of just an internship program rather than a youth internship program. | Recommendations 15 Recognizing that the Youth Internship Program has evolved extensively over time, as a result of ongoing monitoring of the effectiveness of this program, FedNor should further explore the implications of expanding the NODF Youth Internship Program. |
Conclusion 20 FedNor has been committed to providing services in both official languages. There is also evidence of significant activity by FedNor in consulting with official language minority communities (OLMC) to ensure that their needs are integrated into NODF programming. However, based on stakeholder perceptions as well as some of the program data, FedNor needs to continue to evolve to ensure that it meets the unique needs of OLMCs. | Recommendations 16 FedNor should continue to work towards integrating the needs of the OLMCs into its NODF programming. |
Management Response to Conclusions and Recommended Areas for Follow-up
Recommendation 1 :FedNor should continue to adapt the NODF to the changing economic development needs of Northern Ontario. In particular, it should continue to develop strategic approaches that address pan-Northern and/or sectoral needs.
Management Response: Agreed
NODF has been designed with a flexible set of program authorities and considerable scope to allow the program to evolve and adapt to changing economic realities and community needs. The recently updated regional development strategy focuses on six strategic priorities: Community Economic Development; Information and Communications Technology; Innovation; Human Capital; Trade and Tourism; and Business Financing Support. These priorities were established in light of formal and informal consultations with other Departments, Northern Ontario's community leaders, special clients groups, advocates within key Northern Ontario sectors including mining, forestry and tourism, northern exporters and entrepreneurs. This programming will be supported by a new Sectoral Strategies Unit responsible for the development of strategies for supporting key priorities and sectors.
FedNor will continue to consult with stakeholders to build on the success of NODF and to remain responsive to new challenges and opportunities as they emerge.
Recommendation 2 :FedNor should ensure that program officers are aware of the extent of their roles and responsibilities, and that they recognize the areas where flexibility is required versus the areas where consistency is needed. This could be done through more frequent communications via various policy bulletins, training, meetings and other forms of communications amongst program officers as well as between officers and management.
Management Response: Agreed
FedNor is committed to provide opportunities for information exchange and program training so as to ensure the optimum level of flexibility and consistency in the area of program delivery. FedNor will continue to encourage the sharing of information including best practices and lessons learned among officers and management through regular unit and organization-wide meetings; formal and informal training sessions; and annual planning retreats. These opportunities will be further supported by the provision of reference materials such as policy bulletins and other written communications documents.
Recommendation 3 : FedNor should assess the workload distribution of program officers in terms of the time they spend on NODF project planning activities, project implementation and monitoring activities, and project followup activities. This assessment should also examine the time spent on other non-NODF activities and tasks. Based on the result of this assessment, FedNor should make the appropriate adjustments, as required, to ensure an appropriate balance in the time spent on these tasks.
Management Response: Agreed
in staffing actions whereby additional resources were dedicated to the geographic delivery offices. FedNor will ensure that the new workload distribution of program officers allows the appropriate amount of time to be spent on project planning activities; project implementation and monitoring; and project follow-up activities.
Recommendation 4 :FedNor should continue to monitor various aspects of its services and to adapt its service improvement priorities as required. The recommendations included in the 2004/05 Service Improvement Initiative report are still relevant in that, not much improvement can be achieved in terms of client satisfaction. Nevertheless, client expectations could be better managed through the establishment of published service standards.
Management Response: Agreed
Building on the existing high level of client satisfaction, FedNor will continue to introduce processes that will further enhance services to its clients. FedNor's Service Improvement Plan, a dynamic tool which embraces the concept of continuous improvement, will be adjusted to reflect the results of the 2005 Client Satisfaction Survey and other client feedback. With input from FedNor's Service Improvement Initiative Team, service standards in key service areas will be reviewed and communicated to staff and clients. Performance against set standards will continue to be monitored and reported on.
Recommendation 5 : FedNor should continue to address the economic development needs of Northern Ontario through its broad range of strategic priorities as these are contributing to the wide-ranging impacts of the NODF.
Management Response: Agreed
See response to Recommendation #1.
Recommendation 6 :FedNor should keep the requirement for high involvement of other partners and communities in the NODF-funded projects as these are also important to the success of the projects and program.
Management Response: Agreed
FedNor recognizes that one of the keys to the success of NODF is the development of alliances with communities and organizations; the private sector; and other levels of government throughout Northern Ontario. These collaborations result in projects which have broad, community-based support that address current local or regional issues and capitalize on opportunities. Cost-effectiveness of NODF programming is also enhanced as NODF funding levers significant financial contributions toward these projects by co-funders.
top of pageRecommendation 7 : FedNor should also enhance its support of sectoral initiatives as these are important to the economic development of Northern Ontario communities.
Management Response: Agreed
FedNor recently formed a new Sectoral Strategies Unit which is responsible for the development of sectoral strategies in key industry sectors including forestry, mining, Aboriginal economic development, innovation and ICT. FedNor's International Business Centre will continue to focus on the Trade and Tourism sectors. These units will gather and develop sectoral intelligence; collaborate with community stakeholders, business leaders and other levels of government; and develop and support the implementation of approved sectoral strategies and communications plans.
Recommendation 8 : FedNor should continue its practice of appropriately balancing its requirements that NODF funding be incremental to the recipient organization's ability to undertake the projects as well as requiring an appropriate level of leveraging on projects.
Management Response: Agreed
FedNor staff will continue to exercise comprehensive due diligence to ensure that strategically needed projects proceed with an appropriate combination of contributions from the applicant, NODF and other sources of funding. Supporting this, FedNor will continue to extensively collaborate with other organizations to ensure that NODF funding complements rather than duplicates other sources of funding.
Recommendation 9 :FedNor should further refine the NODF RMAF to more accurately reflect the program priorities. The performance reporting systems and tools should also be refined to meet the requirements outlined in the RMAF. In brief, the NODF RMAF would benefit from the following enhancements:
- A closer integration of the logic model with the expected results, which are priority driven.
- An integrated performance measurement and evaluation strategy which:
- is directly linked to the logic model;
- provides assurance that every aspect of the logic model is measured at some point in time (not necessarily ongoing);
- recognizes the variable level of risk associated with the projects and clients;
- provides a more direct link between the evaluation success issues and the program's logic model; and,
- identifies the tools that are in place or needed to meet the performance measurement and evaluation strategy.
The revised RMAF should feed directly into the revisions of existing tools and systems as well as the development of new tools and systems as required. For example, the outcomes captured on NODF projects in the departmental system should match the outcomes in the RMAF. This is not presently the case. For example, the database captures community capacity, connectedness, e-commerce, export, knowledge-based, tourism and trade outcomes. These are currently not directly linked with neither the program priorities nor the outcomes identified in the program logic model. Similarly, what is measured in the project outcomes scoresheet is not reflective of the logic model outcomes nor of the indicators in the performance measurement plan.
Specific instructions on how to specifically complete the project outcomes scoresheets as well as on what is required from the program officer to ensure that the ratings in the scoresheet are reliable must be developed and a means for ensuring data quality and integrity needs to be implemented.
Management Response: Agreed
FedNor recognizes that reporting on program activities and their results is critical to the accountability of the use of public funds and sound performance management of the program. FedNor is committed to revising the NODF RMAF, in accordance with the above recommendations, by fall 2006. It is proceeding with the development of new data collection tools and an accompanying guide which will align with and reflect the expected results of the current program priorities.
Recommendation 10 :FedNor should consult with Audit and Evaluation Branch (AEB) and the Information Management Branch (IMB) which is responsible for GCRS and CMIS to ensure that the departmental systems provide FedNor management with the flexibility it requires to appropriately capture the performance information it needs to better meet its monitoring and accountability requirements. If the required flexibility cannot be incorporated into the existing/new system, then FedNor should discuss other options with AEB and IMB regarding linking the FedNor system to ensure that all monitoring and accountability information can be captured and linked without requiring duplication.
Management Response: Agreed
FedNor will continue to consult with AEB and IMB regarding the design of the departmental information systems. FedNor is represented on the Industry Canada Working Group for the G&C Replacement by staff from finance, program delivery and policy who are providing input on specific areas such as monitoring and accountability so that the new system will meet FedNor's needs.
Recommendation 11 :The new group responsible for gather market intelligence for FedNor and helping to develop strategies in light of this market intelligence should take due consideration of this lesson learned.
Management Response: Agreed
Sectoral strategies will be supported by communication plans which strive to enhance the awareness, on the part of clients and key stakeholders, of NODF's priorities, strategies and successes.
Recommendation 12 :FedNor should continue to have regular organization-wide or strategically driven events aimed at sharing best practices and lessons learned.
Management Response: Agreed
See response to Recommendation #2.
top of pageRecommendation 13 : While there are currently no alternative service delivery approaches for NODF, FedNor should further explore the possibilities of involving third parties more extensively in the delivery of the NODF to ensure that it continues to maximize its cost-efficiency.
Management Response: Agreed
FedNor will assess the possibilities of involving third parties more extensively in the delivery of NODF. This assessment will be conducted within the parameters of the Treasury Board Policy on Transfer Payments.
Recommendation 14 : FedNor should ensure that, to the extent feasible, all Northern Ontario CFDCs are invited to participate in its NODF trade missions, particularly if clients in their delivery region are participating.
Management Response: Agreed
FedNor views the CFDC networks as partners in export development. In the Northwest region, FedNor has contracted with the Northwestern Ontario Development Network (NODN), a network of CFDCs, municipal and provincial membership, to deliver the Export Development Initiative. The NODN membership is actively involved in the recruitment and referral of clients for trade missions and trade services. Currently, FedNor is working with the Northeast CFDC network to coordinate their involvement as one of two host organizations for the Export Development Initiative.
Recommendation 15 : Recognizing that the Youth Internship Program has evolved extensively over time, as a result of ongoing monitoring of the effectiveness of this program, FedNor should further explore the implications of expanding the NODF Youth Internship Program.
Management Response: Agreed
As part of the ongoing process of responding to the changing economic development needs of Northern Ontario, FedNor will continue to assess the objectives and design of the Youth Internship Program and modify accordingly. This assessment would include an analysis of comparable programs, particularly those offered by the Province of Ontario, and budgetary constraints.
Recommendation 16 :FedNor should continue to work toward integrating the needs of the Official Language Minority Communities (OLMCs) into its NODF programming.
Management Response: Agreed
In May 2005, FedNor staffed its first dedicated Official Languages Coordinator position to provide dedicated support to planning and promotional activities relative to OLMCs. A new OLMC Consultation Plan is being developed to enhance dialogue with OLMCs, foster a common understanding of the that OLMCs would like FedNor to take into account when developing programs and services, and enhance the awareness of FedNor programs among OLMCs. Consultation findings will be shared with FedNor management and staff to inform them of OLMC needs and priorities.
Management Accountability
These program-related recommendations will be addressed within operational plans and delivery strategies to be undertaken by Industry Canada/FedNor in 2006–07 and beyond.
Leadership in implementing these recommendations is to be provided by the Industry Canada/FedNor Management Team in cooperation with partner organizations, and is to be overseen by the Assistant Deputy Minister of Operations, Industry Canada.
Long Description
Figure 1
The image depicts a bar graph with the heading "Extent of Increased Trading Opportunities". The chart shows the percentage of respondents who chose the options "Not at all", 2, 3, 4, and "To a large extent". 26% responded "Not at all", 25% responded with "2", 37% responded with "3", 10% responded with "4", and 2% responded with "To a large extent"
Figure 2
The image depicts a bar graph with the heading "Extent of greater participation in KBE"". The chart shows the percentage of respondents who chose the options "Not at all", 2, 3, 4, and "To a large extent". 19% responded "Not at all", 21% responded with "2", 33% responded with "3", 16% responded with "4", and 11% responded with "To a large extent"
Figure 3
The image shows a bar chart with the heading "Project Incrementality" For each category it shows the percentage of projects that are None, Minor, Major, and Full. For the first category, "Total", None is approximately 1%, Minor is approximately 11%, Major is approximately 40% and Full is approximately 48%. For the next category, "Studies", None is approximately 2%, Minor is approximately 2%, Major is approximately 28% and Full is approximately 68%. For the next category, "Implementation", None is approximately 1%, Minor is approximately 14%, Major is approximately 44% and Full is approximately 41%. For the next category, "North Central", None is approximately 0%, Minor is approximately 22%, Major is approximately 34% and Full is approximately 44%. For the next category, "Northeastern", None is approximately 2%, Minor is approximately 10%, Major is approximately 42% and Full is approximately 46%. For the next category, "Northwestern", None is approximately 0%, Minor is approximately 5%, Major is approximately 42% and Full is approximately 53%. For the next category, "Telecom & ICT", None is approximately 0%, Minor is approximately 15%, Major is approximately 16% and Full is approximately 69%. For the next category, "Innovation & Tech", None is approximately 0%, Minor is approximately 7%, Major is approximately 67% and Full is approximately 26%. For the next category, "Trade and Tourism", None is approximately 0%, Minor is approximately 7%, Major is approximately 24% and Full is approximately 69%. For the next category, "CED", None is approximately 1%, Minor is approximately 2%, Major is approximately 38% and Full is approximately 59%. For the next category, "Human Capital", None is approximately 1%, Minor is approximately 20%, Major is approximately 47% and Full is approximately 32%. For the next category, "SME", None is approximately 0%, Minor is approximately 29%, Major is approximately 57% and Full is approximately 14%. For the next category, "Educational", None is approximately 0%, Minor is approximately 8%, Major is approximately 42% and Full is approximately 50%. For the next category, "Other NFP", None is approximately 0%, Minor is approximately 9%, Major is approximately 35% and Full is approximately 56%. For the next category, "Municipal", None is approximately 0%, Minor is approximately 9%, Major is approximately 45% and Full is approximately 46%. For the final category, "Aboriginal", None is approximately 7%, Minor is approximately 10%, Major is approximately 36% and Full is approximately 47%.