
This publication is a report on the administration of the Canada Small Business Financing Act from April 1, 2015, to March 31, 2016.
This publication is available online at canada.ca/csbfp and upon request in accessible formats (Braille, large print, etc.). Contact:
Small Business Financing Directorate
Small Business Branch
1-866-959-1699 (toll-free in Canada)
Permission to Reproduce
Except as otherwise specifically noted, the information in this publication may be reproduced, in part or in whole and by any means, without charge or further permission from the Department of Industry, provided that due diligence is exercised in ensuring the accuracy of the information reproduced; that the Department of Industry is identified as the source institution; and that the reproduction is not represented as an official version of the information reproduced or as having been made in affiliation with, or with the endorsement of, the Department of Industry.
For permission to reproduce the information in this publication for commercial redistribution, please fill out the Application for Crown Copyright Clearance at ic.gc.ca/copyright-request or contact:
Web Services Centre
Innovation, Science and Economic Development Canada
Telephone (toll-free in Canada): 1-800-328-6189
Telephone (international): 613-954-5031
TTY (for hearing impaired): 1-866-694-8389
Business hours: 8:30 a.m. to 5:00 p.m. (Eastern Time)
Email: ISED@Canada.ca
© Her Majesty the Queen in Right of Canada, represented by the Minister of Industry, 2017.
Aussi offert en français sous le titre Loi sur le financement des petites entreprises du Canada : Rapport annuel 2015-2016.

The Honourable
Bardish Chagger
Minister of Small Business and Tourism
I am pleased to present to Parliament the 2015–16 annual report on the Canada Small Business Financing (CSBF) Program, in accordance with section 20 of the Canada Small Business Financing Act.
The CSBF Program continues to be an important part of our government’s support for small and medium-sized businesses. The program is designed to ensure that small business owners, in particular those with difficulty accessing financing, have a fair opportunity to get the financing they require to start up, expand, and innovate. In February 2016, the CSBF Program made amendments to its regulations which provided more flexible loan repayment schedules for small business owners and reduced administrative burden for program stakeholders.
This report details how the CSBF Program, working with financial institutions across the country, has helped small businesses access over 5,000 loans worth about $880 million in 2015–16. Of this amount, 60 percent went to small businesses that were in operation for less than one year, satisfying an important objective of the program to extend financing that would otherwise not have been available.
The Government of Canada understands that small businesses are the backbone of the economy and is committed to creating a healthy and sustainable environment for small business owners to innovate, prosper, and modernize at home and on a global scale.
Sincerely,
The Honourable
Bardish Chagger, P.C., M.P.
PDF version
Table of contents
- Overview of the Canada Small Business Financing Program
- Major program parameters
- Highlights of 2015–16
- Program analysis
- 4.1 Program activities and changes
- 4.2 Loan volumes
- 4.3 Claim volumes
- 4.4 Loans and claims by asset type
- 4.5 Loans and claims by size of loan
- 4.6 Loans and claims by province and territory
- 4.7 Loans and claims by industry sector
- 4.8 Loans and claims by age of business
- 4.9 Loans and claims by borrower size and type of business
- Cost recovery
- Program liability
- Future directions
1. Overview of the Canada Small Business Financing Program
The purpose of the Canada Small Business Financing (CSBF) Program is to increase the availability of financing to small businesses by extending financing that would otherwise have been unavailable to them, or been available under less favourable conditions (also referred to as "incrementality"). By sharing the burden of risk on loans, the government facilitates access to term loans made by private sector lenders to small businesses to purchase or improve real property, leasehold improvements and equipment. To be eligible, borrowers must be for-profit businesses with annual revenues of $10 million or less. It is a national program that operates through a network of financial institutions in all provinces and territories.
The role of federal government
Innovation, Science and Economic Development (ISED) Canada administers the CSBF Program by registering loans, collecting fees and paying lenders eligible portions of losses on defaulted loans. The Department, however, is not involved in the disbursement and administration of those loans.
The role of lenders
It is the responsibility of private sector lenders to make all credit decisions, approve and disburse the loans, register the loans with the CSBF Program and administer and receive payments on the loans. Each lender has its own lending criteria subject to the requirements of the CSBF Program. Once the loan is approved, the borrower receives the funds from the lender, not the government.
If a loan is in default, a lender must recover all assets taken as collateral for the loan, together with all the necessary documentation to justify the claim, before forwarding their claim for loss to the CSBF Program. Once the lender's information is reviewed and the claim is approved, the lender is paid 85 percent of their net eligible loss.
Incrementality
The CSBF Program increases the availability of financing for small businesses that would otherwise have been unavailable, or been available under less favourable terms such as cost prohibitive interest rates (i.e., incremental loans). According to the program's last incrementality study (2015), about 67 percent of CSBF Program loans were fully financially incremental, meaning that they would not have been granted in the absence of the program.
2. Major program parameters
The CSBF Program operates according to the following major parameters:
Assets financed
Loans can be used to finance: (1) the purchase and improvement of equipment; (2) leasehold improvements; (3) the purchase and improvement of real property; and (4) program registration fees.
Small business eligibility
In order for a business to be eligible it must be a for-profit business; revenues cannot exceed $10 million per year; and the business must be located in Canada with its work carried out in Canada.
Percentage of assets accepted for financing
Up to 100 percent of the eligible cost of assets can be financed.
Fees collected
(1) The registration fee is a one-time, upfront fee of 2 percent of the amount financed, paid at the time of registration. This can be included in the CSBF loan; and (2) The administration fee is an annual 1.25 percent fee (paid quarterly) charged to the lender on the outstanding loan amounts. Lenders may pass this fee on to borrowers as part of the interest rate charged on their loans.
Maximum interest rate
(1) The maximum floating rate is the lender's prime rate plus 3 percent (includes the 1.25 percent administration fee); and (2) The maximum fixed rate is the lender's residential mortgage rate plus 3 percent (includes the 1.25 percent administration fee).
Maximum financing amount
A borrower can finance up to $1 million (of which a maximum of $350,000 can be used to finance the purchase or improvement of equipment or leasehold improvements).
Length of term
(1) The maximum term for leasehold and equipment financing is 10 years from the date of first payment of principal and/or interest; and (2) The maximum term for real property financing is 15 years from the date of first payment of principal and/or interest.
Loss-sharing ratio on claims
The Government of Canada's share of eligible losses on loans is 85 percent. Lenders are responsible for the remaining 15 percent.
Cap on claim payments
For each five-year lending period, the Government of Canada's obligation to an individual lender is to pay eligible claims on defaulted loans up to a maximum of the aggregate of:
- 90 percent of the first $250,000 in loans registered; plus
- 50 percent of the next $250,000; plus
- 12 percent of all loans in excess of $500,000.
3. Highlights of 2015–16
Lenders granted small businesses loans worth $879.9 million
In 2015–16, there were 5,044 loans made to Canadian small business valued at $879.9 million. Compared to the previous year, the number of loans remained stable, while the value of loans increased by $81.7 million. The average loan size was $174,453, an increase of 13.2 percent compared to 2014–15.
Equipment and leasehold improvements were the most common assets financed
Equipment continued to be the largest asset type financed at $351.6 million (40.0 percent). This was followed closely by leasehold improvements at $316.3 million (35.9 percent), and real property at $212 million (24.1 percent). The percentage of real property financing increased slightly in 2015–16 relative to 2014–15 (24.1 percent vs. 20.3 percent) while the shares of equipment and leasehold improvement financing have dropped slightly.
Lending is accessible in every province and territory
Ontario and Quebec represented the majority of lending at $558.1 million (63.4 percent). The third-largest province was Alberta at $144.8 million (16.5 percent). These percentages were similar to last year.
Accommodation and food services and retail sectors represented the majority of lending
Accommodation and food services was the largest industry sector using the CSBF Program at $338.5 million, representing 38.5 percent of the total value of loans made—the retail trade sector followed at 11.8 percent. These percentages were similar to last year.
Start-ups and new businesses received the largest share of financing
Start-ups and businesses operating less than one year continued to receive the majority of loans, $530.0 million (60.2 percent). This percentage has remained stable over the last 10 years.
Claims paid of $61.2 million
The CSBF Program paid a total of 944 claims to lenders representing $61.2 million, with the average claim being $64,883. The number and value of claims paid decreased by 4.7 percent and 7.6 percent respectively compared to last year.
4. Program analysis
4.1 Program activities and changes
On June 23, 2015, legislative amendments came into force to increase the amount of financing available under the program to allow more small businesses to apply for CSBFP loans. In particular, the maximum real property loan amount increased from $500,000 to $1 million, and the program eligibility threshold for small businesses was expanded from $5 million to $10 million in gross annual revenues.
Additionally, regulatory changes came into force on February 19, 2016, which increased the maximum term for loans from 10 to 15 years for real property loans, reduced administrative burden for program stakeholders and aligned the regulations with legislative changes made in June 2015. These changes contributed to the 10 percent increase in the value of lending observed over the past year.
Moreover, throughout 2015–16, the CSBF Program performed a wide range of outreach activities to promote the regulatory and legislative amendments and increase program awareness among small businesses, lenders and business support organizations throughout Canada.
The CSBF Program's website continued to be one of the Department's most popular sites, with 208,103 visits in 2015–16. Also, more than 3,000 telephone and email inquiries were received from small businesses and lenders through the info line and website, and over 68,500 information pamphlets were distributed.
4.2 Loan volumes
In 2015–16, the total value of loans made by lenders under the CSBF Program surpassed $879 million. This represented a significant injection of new financing for small businesses, while increasing program lending by $81.7 million over the previous year. The number of loans registered under the program amounted to 5,044, which was slightly down from the previous year (see Figure 1). For 2015–16, 98 percent of the loans made by lenders were registered within two business days.
The average loan size was $174,453, an increase of 13.2 percent or $20,294 from the previous fiscal year. The increase can be attributed to the 2015 legislative amendments that increased the maximum loan amount to $1 million, up from $500,000. Over the last decade, small businesses have received $9.3 billion in asset-based financing, representing over 70,000 loans.
The CSBF Program continued to encourage lenders to submit loan registrations and fees electronically through a modernized online system, which furthered the program's efforts to digitalize processes, increase efficiency and reduce the administrative burden placed on lenders. By March 2016, 83 percent of CSBF Program loans were registered online and 45 percent of revenues were processed electronically.
Figure 1: Number and Value of CSBF Loans, 2006–16

For more details, see Table 1 in the Appendix.
4.3 Claim volumes
In 2015–16, there were 944 claims paid to lenders, representing a total value of $61.2 million, an average of $64,883 per claim (see Figure 2). Claims paid in 2015–16 were associated with loans made during the 1999–2016 period. On average, the CSBF Program took 13 business days to process those claims once all the required documentation was received.
Compared to the previous year, the total number of claims decreased slightly by 47 (4.7 percent) and the total value of claims decreased by $5.1 million (7.6 percent).
As part of the Government of Canada's Direct Deposit Initiative, the CSBF Program, along with lenders, initiated the digitalization of claim payments in 2014–15. Throughout 2015–16, the program processed 96 percent of all claim payments through direct deposit, a significant increase from 27 percent in 2014–15.
Failure to comply with program requirements resulted in the non-payment of 62 claims. Four claim decisions were appealed, two of these appeals were approved, one was rejected and one remained to be completed as at March 31, 2016.
Figure 2: Number and Value of CSBF Claims, 2006–16

For more details, see Table 1 in the Appendix.
4.4 Loans and claims by asset type
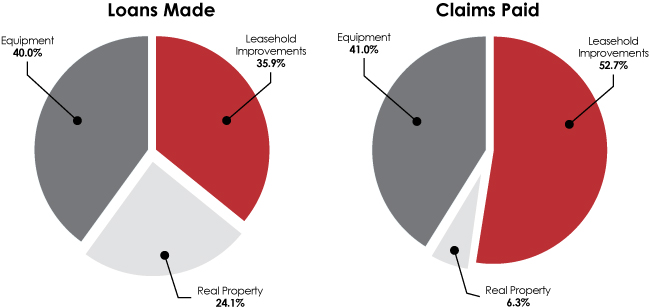
Small businesses can obtain CSBF loans to finance assets such as equipment, leasehold improvements, and real property. Figure 3 shows the value of loans and claims by asset type for 2015–16:
- Equipment accounted for the largest percentage of the total value of loans (40.0 percent), and the second largest percentage of the total value of claims (41.0 percent).
- Leasehold improvements accounted for 35.9 percent of the total value of loans and 52.7 percent of the total value of claims.
- Real property represented the smallest percentage of the total value of loans (24.1 percent) and claims (6.3 percent).
On June 23, 2015, the CSBF Program increased the maximum loan amount from $500,000 to $1 million for the purchase of real property (of which a maximum of $350,000 could be used to finance the purchase of leasehold improvements and equipment). As a result, the average loan size for real property was significantly higher than other types (real property, $272,902; leasehold improvements, $197,693; and equipment, $131,829).
In 2015–16, the percentage of real property financing increased to 24.1 percent, up from 20.3 percent in 2014–15, while equipment and leasehold improvement financing dropped slightly.
Figure 3: CSBF Loans and Claims by Asset Type, 2015–16
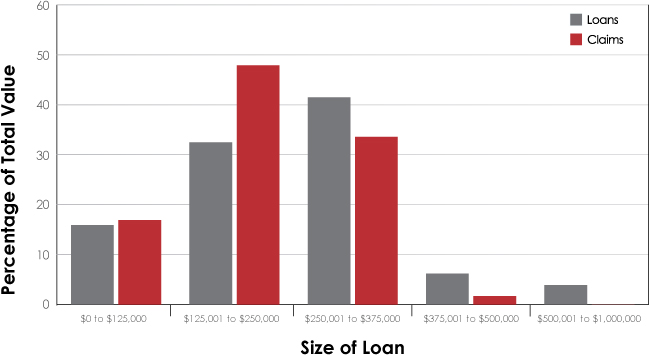
4.5 Loans and claims by size of loan
The majority of loans made under the CSBF Program were valued between $125,000 to $375,000, representing 2,710 loans (53.7 percent of the total number of loans) or $651.0 million (74.0 percent of the total value of loans).
Similarly, 548 (58.1 percent) of claims paid were on loans valued between $125,000 to $375,000. The total value of these claims amounted to $49.9 million (81.5 percent of all claims) in 2015–16 (see Figure 4).
The distribution of loan and claim sizes was in line with the previous year.
Figure 4: Percentage of Total Value of CSBF Loans and Claims by Size of Loan, 2015–16
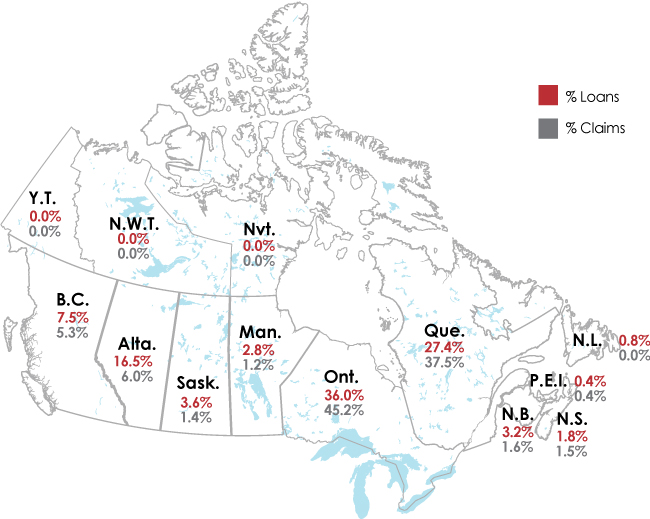
4.6 Loans and claims by province and territory
The CSBF Program is accessible to small businesses in all provinces and territories in Canada (see Figure 5). The program is demand-driven—its usage reflects choices made by lenders and small businesses. Provincially, Ontario and Quebec accounted for more than 63 percent of the value of loans made, while Alberta was the third-largest user of the program, accounting for 16.5 percent of the value of loans made in 2015–16. The overall geographical breakdown of loans and claims in 2015–16 was as follows:
- Ontario and Quebec: 3,134 loans (62.1 percent of the total number of loans) with a value of $558.1 million (63.4 percent of the total value of loans), representing the largest share of loans registered
- Western Canada: 1,572 loans (31.2 percent) with a value of $267.1 million (30.4 percent)
- Atlantic Canada: 338 loans (6.7 percent) with a value of $54.8 million (6.2 percent)
Similarly, the majority of claims were from Ontario and Quebec: 768 claims (81.4 percent of the total number of claims) with a value of $50.7 million (82.7 percent of the total value of claims).
Loan and claim shares by province and territories were similar to 2014–15 levels.
Figure 5: Percentage of Total Value of CSBF Loans and Claims by Province and Territory, 2015–16
For more details, see Table 2 in the Appendix.
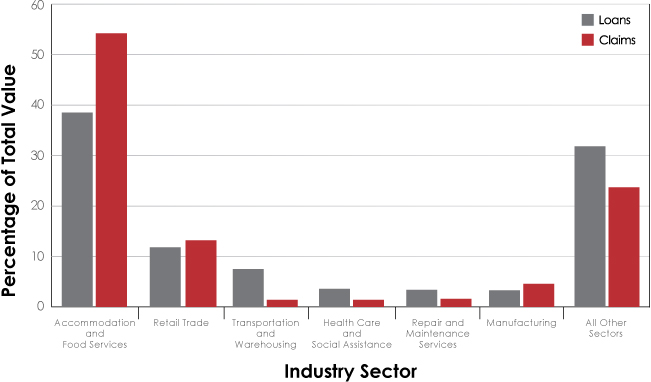
4.7 Loans and claims by industry sector
Businesses operating in the accommodation and food services sector accounted for the largest share of borrowers, representing 1,548 loans (30.7 percent of the total number of loans) and with a value of $338.5 million (38.5 percent of the total value of loans) in 2015–16. Retail trade was the next largest sector with 578 loans (11.5 percent of the total number of loans) and $104.1 million (11.8 percent of the total value of loans).
Accordingly, these two sectors also accounted for the majority of claims with 575 claims (60.9 percent) valued at $41.2 million (67.3 percent).
The breakdown of loans and claims for the top six industry sectors is illustrated in Figure 6. Lending and claim shares for the main industry sectors were relatively stable compared to last year.
Figure 6: Percentage of Total Value of CSBF Loans and Claims by Main Industry Sector, 2015–16
For more details, see Table 3 in the Appendix.
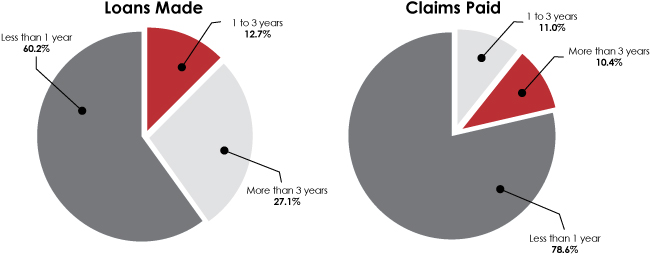
4.8 Loans and claims by age of business
CSBF loans are incremental in that they increase the availability of financing for small businesses that would otherwise have been unavailable, or been available under less favourable terms. Research shows that start-ups have the greatest difficulty in accessing capital. In 2015–16, start-up businesses (i.e., those that were in operation for less than one year) received just over 60 percent of the total value of loans registered ($530.0 million) and 54.9 percent of the total number of loans (2,770 loans) (see Figure 7).
Likewise, businesses less than one year old accounted for the majority of claims paid with 703 claims (74.5 percent) valued at $48.1 million (78.6 percent) over the same period. Over the last decade, the percentage of loans and claims has remained relatively constant, irrespective of business age.
Figure 7: CSBF Loans and Claims by Age of Business, 2015–16
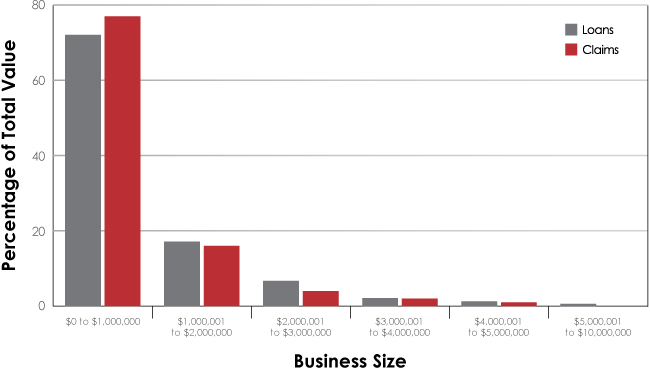
4.9 Loans and claims by borrower size and type of business
Under the CSBF Program, small businesses with annual revenues of up to $2 million accounted for the vast majority of loans made at 92.3 percent of the number and 89.3 percent of the value of loans in 2015–16. The bulk of claims paid were also for small businesses with revenues under $2 million (94.7 percent of the number and 93.4 percent of the value of claims) (see Figure 8).
Figure 8: Percentage of Total Value of CSBF Loans and Claims by Business Size, 2015–16
Moreover, corporations received the largest share of the total value of loans with 93.1 percent in 2015–16, while partnerships and sole proprietors received the remainder of the loans at 6.9 percent. Claims data were somewhat similar: 95.6 percent of the claims were from corporations and 4.4 percent were from partnerships and sole proprietors.
Lending and claim percentages by borrower size and type have remained stable over the last decade.
In terms of type of business, non-franchise businesses accounted for 71.8 percent of the total value of loans and 61.9 percent of the total value of claims in 2015–16. Franchise businesses represented the balance with 28.2 percent of the total value of loans and 38.1 percent of the total value of claims. The average loan size for non-franchises was significantly lower than for franchises: $163,089 and $212,000 respectively. Lending and claim shares by type of business were comparable to last year.
5. Cost recovery
Cost recovery refers to the extent to which CSBF Program revenues collected help offset claims paid on defaulted loans. The CSBF Program has two sources of revenue: 1) a one-time upfront 2 percent registration fee on the loan amount; and 2) a 1.25-percent annual administration fee on the outstanding loan balance.
For the current five-year lending period (2014–19), CSBF Program revenues amounted to $51.8 million, while total claim expenses were $5.5 million, resulting in a net revenue of $46.4 million as at March 31, 2016. A positive net balance in the current lending period is due to the timing of the revenues and claims. Revenues are collected at the time of loan registration, while claims are typically received three to four years after loans have been disbursed. Therefore, differences in net balances for each five-year lending period are attributable to the length of time over which loans have been outstanding, with older cohorts of loans being associated with more claim expenses. Below is a summary of the revenues and expenses for each of the five-year lending periods as at March 31, 2016.
| 5-Year Lending Period | Revenues($ millions) | Expenses($ millions) | Net Cumulative Revenues and Expenses ($ millions) |
|---|---|---|---|
| 1999–2004 | 290.3 | 418.4 | (128.1) |
| 2004–09 | 264.7 | 443.1 | (178.4) |
| 2009–14 | 247.4 | 245.6 | 1.8 |
| 2014–19 | 51.8 | 5.5 | 46.4 |
For additional information on the CSBF Program's cost recovery and economic benefits, refer to Section 5.4 and Section 5.5 of the Comprehensive Review Report 2009–2014.
6. Program liability
Under the Canada Small Business Financing Act, the Government of Canada's maximum liability for all loans registered within each five-year lending period is capped by the aggregate of the 90–50–12 percent formula (or 90–50–10 percent for loans made prior to April 1, 2009) calculated for each lender (as explained in section 2). For large volume lenders, this represents roughly 12 percent of their loans registered over each five-year lending period (or 10 percent for loans made prior to April 1, 2009).
The contingent liability represents the maximum amount of money that the government is responsible to pay if all outstanding loans were to default simultaneously as at March 31, 2016. This amount can be defined specifically as the lower of the existing net liability (i.e., the maximum liability less claims already paid) and 85 percent of the outstanding loan balance amount.
Below is a summary of the maximum and contingent liabilities for each of the five-year lending periods as at .
| 5-Year Lending Period | Loans Made ($ millions) | Maximum Liability ($ millions) | Contingent Liability ($ millions) |
|---|---|---|---|
| 1999–2004 | 5,361.6 | 660.4 | 0.8 |
| 2004–09 | 5,042.1 | 627.9 | 56.3 |
| 2009–14 | 4,699.6 | 679.3 | 444.6 |
| 2014–19 | 1,678.2 | 281.6 | 277.3 |
7. Future directions
Over the last fiscal year, significant legislative and regulatory changes were made to expand program eligibility, increase access to financing and reduce administrative burden. These changes will enable more small businesses to apply for financing in the amounts that better reflect their needs, while ensuring that they are not overburdened by onerous repayment terms. While it is too early to report on the impact of these changes, preliminary estimates suggest that program uptake is on the rise.
Moving forward, the CSBF Program will continue to strengthen its efforts with lenders to increase awareness and encourage uptake of the program among underrepresented groups (e.g., women entrepreneurs). In addition, the Canada Business Network will be working closely with key stakeholders, such as Regional Development Agency partners and Chartered Professional Accountants, to increase collaboration and maximize awareness of the CSBF Program across Canada, particularly in the three northern territories.
Small businesses are the backbone of the economy and significant contributors to growth and innovation. As one of the government’s long-standing support mechanisms for small businesses, the CSBF Program is continually examining how it can evolve, particularly in light of the government’s Innovation and Skills Plan, and the forthcoming 2014-19 Comprehensive Review of the CSBF Program.
The CSBF Program will continue to assist lenders in taking advantage of the more efficient online loan registration application when registering loans and submitting fees. In the coming year, the program will continue to encourage lenders to convert all cheque payment processes, including registration fees, administration fees and claim payments to convenient electronic payment processes. The more efficient electronic payment process significantly reduces administrative burden and processing fees for lenders.
Starting in 2016–17, the report on the administration of the CSBF Act, pursuant to sections 18 and 20 of that Act, will be incorporated in ISED's Departmental Performance Report. The CSBF Program's website will continue to provide historical statistical data and other information relevant to the administration of the program.
Appendix
Canada Small Business Financing Program—Tables 1 to 3
Note: Supplementary data tables on loans and claims since April 1, 1999 are accessible on the CSBF Program website.
| Fiscal Year | Loans | Revenues | Expenses | Net Revenues Less Expenses ($000) | |||
|---|---|---|---|---|---|---|---|
| Number | Value ($000) | Average Size ($000) | FeesFootnote * ($000) | Number | Value ($000) | ||
| 1999–2000 | 17,741 | 1,352,320.5 | 76.2 | 33,406.6 | 19 | 494.6 | 32,912.0 |
| 2000–01 | 14,442 | 1,159,048.0 | 80.3 | 43,134.5 | 307 | 14,769.0 | 28,365.5 |
| 2001–02 | 11,016 | 899,247.6 | 81.6 | 44,576.2 | 915 | 43,444.3 | 1,131.9 |
| 2002–03 | 11,263 | 951,159.1 | 84.4 | 48,433.2 | 1,409 | 68,791.3 | (20,358.0) |
| 2003–04 | 11,085 | 999,868.3 | 90.2 | 51,553.2 | 1,553 | 71 ,662.7 | (20,109.5) |
| 2004–05 | 11,142 | 1,041,063.0 | 93.4 | 53,820.7 | 1,620 | 76,460.1 | (22,639.4) |
| 2005–06 | 10,790 | 1,087,701.8 | 100.8 | 56,220.8 | 1,598 | 71,679.3 | (15,458.5) |
| 2006–07 | 9,595 | 1,024,535.6 | 106.8 | 55,769.9 | 1,681 | 80,289.4 | (24,519.5) |
| 2007–08 | 8,930 | 987,662.6 | 110.6 | 55,066.8 | 1,835 | 96,341.1 | (41,274.3) |
| 2008–09 | 7,796 | 901,120.2 | 115.6 | 52,895.2 | 1,955 | 101,509.4 | (48,614.2) |
| 2009–10 | 7,534 | 952,858.5 | 126.5 | 52,393.3 | 1,933 | 109,458.9 | (57,065.6) |
| 2010–11 | 7,454 | 1,015,069.8 | 136.2 | 51,732.2 | 1,475 | 76,318.3 | (24,586.1) |
| 2011–12 | 7,141 | 978,259.7 | 137.0 | 53,087.9 | 1,329 | 66,152.5 | (13,064.6) |
| 2012–13 | 6,195 | 899,683.6 | 145.2 | 50,822.1 | 888 | 50,617.3 | 204.9 |
| 2013–14 | 5,667 | 853,717.4 | 150.6 | 50,782.4 | 839 | 56,992.7 | (6,210.3) |
| 2014–15 | 5,178 | 798,236.3 | 154.2 | 49,837.5 | 991 | 66,252.2 | (16,414.7) |
| 2015–16 | 5,044 | 879,943.2 | 174.5 | 50,691.7 | 944 | 61,249.5 | (10,557.7) |
| TotalFootnote ** | 158,013 | 16,781,495.1 | 106.2 | 854,224.3 | 21,291 | 1,112,482.4 | (258,258.2) |
| Province or Territory | Loans | Claims | ||||
|---|---|---|---|---|---|---|
| Number | Value ($000) | Percentage of Total Value | Number | Value ($000) | Percentage of Total Value | |
| Newfoundland and Labrador | 43 | 7,437.2 | 0.8 | – | – | – |
| Prince Edward Island | 22 | 3,291.7 | 0.4 | 4 | 228.4 | 0.4 |
| Nova Scotia | 85 | 15,703.8 | 1.8 | 12 | 897.7 | 1.5 |
| New Brunswick | 188 | 28,363.7 | 3.2 | 21 | 1,006.2 | 1.6 |
| Quebec | 1,382 | 240,934.0 | 27.4 | 350 | 22,984.4 | 37.5 |
| Ontario | 1,752 | 317,124.6 | 36.0 | 418 | 27,666.8 | 45.2 |
| Manitoba | 180 | 24,409.7 | 2.8 | 13 | 706.2 | 1.2 |
| Saskatchewan | 223 | 31,618.1 | 3.6 | 15 | 859.3 | 1.4 |
| Alberta | 690 | 144,788.4 | 16.5 | 53 | 3,654.8 | 6.0 |
| British Columbia | 478 | 66,232.9 | 7.5 | 58 | 3,245.6 | 5.3 |
| Yukon | 1 | 39.1 | 0.0 | – | – | – |
| Northwest Territories | – | – | – | – | – | – |
| Nunavut | – | – | – | – | – | – |
| TotalFootnote * | 5,044 | 879,943.2 | 100.0 | 944 | 61,249.5 | 100.0 |
| Industry Sector | Loans | Claims | ||||
|---|---|---|---|---|---|---|
| Number | Value ($000) | Percentage of Total Value | Number | Value ($000) | Percentage of Total Value | |
| Accommodation and food services | 1,548 | 338,532.9 | 38.5 | 423 | 33,141.7 | 54.1 |
| Administrative and support, waste management and remediation services | 16 | 2,174.0 | 0.2 | 5 | 180.2 | 0.3 |
| Agriculture (support activities), forestry, fishing and hunting | 186 | 26,914.0 | 3.1 | 14 | 352.2 | 0.6 |
| Arts, entertainment and recreation | 167 | 28,400.0 | 3.2 | 28 | 1,438.2 | 2.3 |
| Construction | 203 | 27,956.8 | 3.2 | 25 | 889.4 | 1.5 |
| Educational services | 62 | 10,389.9 | 1.2 | 7 | 459.5 | 0.8 |
| Finance and insurance | 19 | 3,981.7 | 0.5 | 1 | 3.9 | 0.0 |
| Health care and social assistance | 151 | 32,009.0 | 3.6 | 16 | 886.1 | 1.4 |
| Information and cultural industries | 7 | 752.7 | 0.1 | – | – | – |
| Manufacturing | 170 | 28,931.5 | 3.3 | 52 | 2,818.9 | 4.6 |
| Mining, and oil and gas extraction | 34 | 4,951.3 | 0.6 | 4 | 183.8 | 0.3 |
| Other services | 673 | 110,389.0 | 12.5 | 79 | 4,574.8 | 7.5 |
| Personal care services | 178 | 28,451.5 | 3.2 | 60 | 4,519.5 | 7.4 |
| Professional, scientific and technical services | 91 | 12,119.3 | 1.4 | 16 | 519.8 | 0.8 |
| Real estate and rental and leasing | 31 | 8,612.7 | 1.0 | 6 | 216.9 | 0.4 |
| Repair and maintenance services | 187 | 30,261.0 | 3.4 | 16 | 953.8 | 1.6 |
| Retail trade | 578 | 104,073.9 | 11.8 | 152 | 8,074.7 | 13.2 |
| Transportation and warehousing | 664 | 66,394.9 | 7.5 | 25 | 827.5 | 1.4 |
| Utilities | 8 | 1,482.1 | 0.2 | 4 | 346.4 | 0.6 |
| Wholesale | 71 | 13,165.2 | 1.5 | 11 | 862.0 | 1.4 |
| TotalFootnote * | 5,044 | 879,943.2 | 100.0 | 944 | 61,249.5 | 100.0 |