
On this page
- Global Trend for Patented Inventions
- Geographical Clusters of Patent Activity
- IP Concentration among Countries
- Global Patent Landscape
International Importance of IP for Pandemic Mitigation Technologies
This section presents the innovation that has been carried out by institutions worldwide for pandemic mitigation technologies. Using patent activity as a proxy for measuring innovation, this section explores the patent landscape for this field between 1999 and 2018.
Global Trend for Patented Inventions
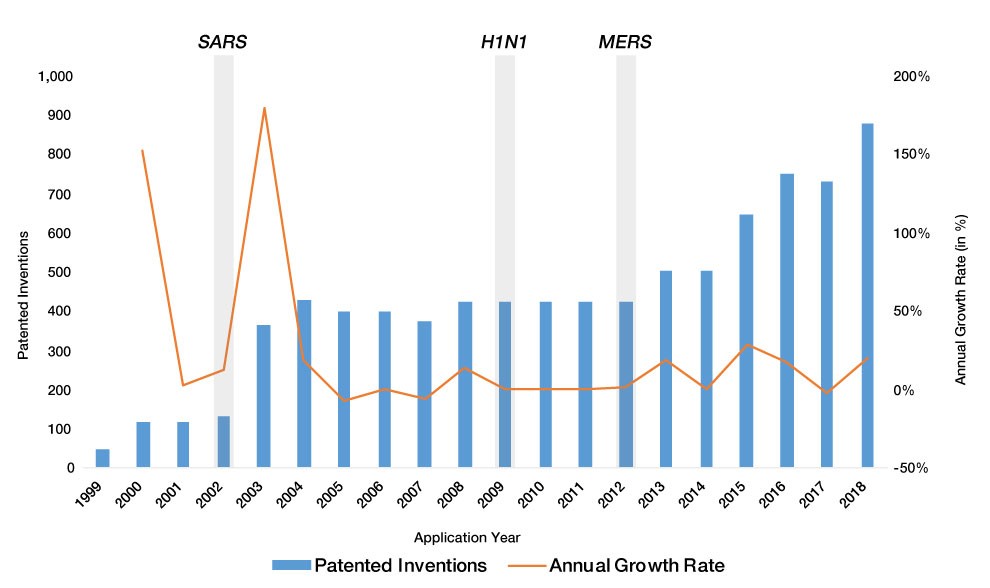
Figure 5 shows the global trend for patented inventions for pandemic mitigation technologies between application years 1999 and 2018. During these two decades, the average annual growth rate of patented inventions was 17%. At the turn of the century, there was a limited number of patented inventions in this field; however, a significant spike in patent activity is observed between 2002 and 2004 following the SARS outbreak. After 2004, the growth for patented inventions remained relatively stable until the onset of the MERS outbreak, after which an annual average growth of 13% is observed between 2012 and 2018.
Figure 5: Global growth of patented inventions for pandemic mitigation technologies between 1999 and 2018
Description of figure 5
| Application Year | Patented Inventions | Annual Growth Rate |
|---|---|---|
| 1999 | 45 | - |
| 2000 | 113 | 151.11% |
| 2001 | 116 | 2.65% |
| 2002 | 130 | 12.07% |
| 2003 | 362 | 178.46% |
| 2004 | 428 | 18.23% |
| 2005 | 397 | -7.24% |
| 2006 | 398 | 0.25% |
| 2007 | 372 | -6.53% |
| 2008 | 420 | 12.90% |
| 2009 | 420 | 0.00% |
| 2010 | 421 | 0.24% |
| 2011 | 419 | -0.48% |
| 2012 | 422 | 0.72% |
| 2013 | 498 | 18.01% |
| 2014 | 499 | 0.20% |
| 2015 | 641 | 28.46% |
| 2016 | 748 | 16.69% |
| 2017 | 729 | -2.54% |
| 2018 | 874 | 19.89% |
Geographical Clusters of Patent Activity
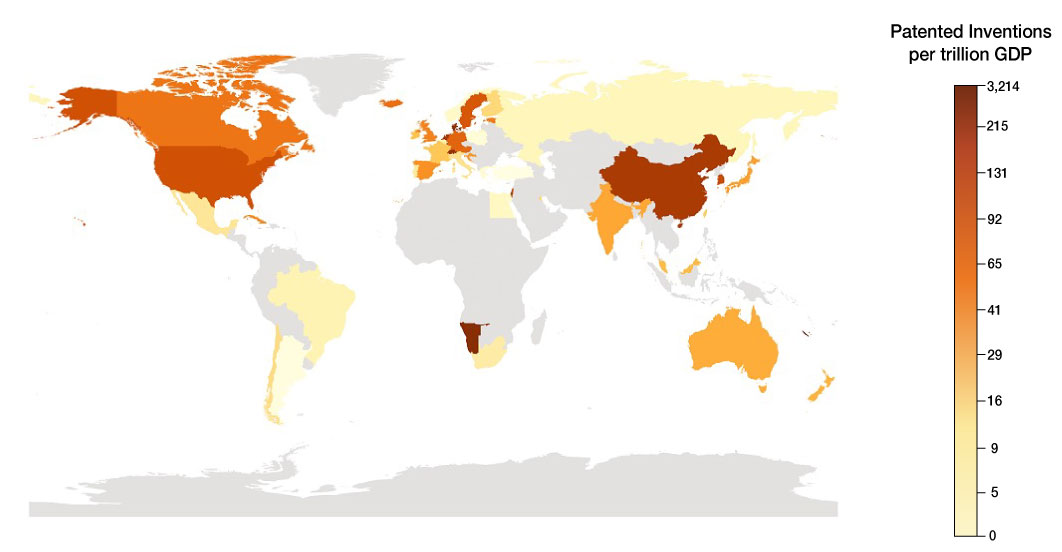
The Figure 6 displays the patenting intensity of each country's institutions for pandemic mitigation technologies. The patented invention volume for each country has been normalized by the country's Gross Domestic Product (GDP) value for 2018 to adjust for the size of the economy.Footnote iv, Endnote 7 After accounting for this, smaller economies like Liechtenstein, Namibia and Denmark emerge as leaders in this field. However, in terms of absolute fractional counts, institutions from the United States of America (USA) and China are clear leaders, since they were cumulatively responsible for more than 50% of the total patented inventions considered for this analysis. Canadian institutions hold the eighth largest patent portfolio in this field.
Figure 6: Global patent activity by institution's country of origin for pandemic mitigation technologies
Description of figure 6
| Country of origin | Patented Inventions per trillion GDP |
|---|---|
| Argentina | 2.507352647 |
| Australia | 32.11852734 |
| Austria | 76.7987506 |
| Belgium | 7.522092361 |
| Brazil | 6.956983039 |
| British Virgin Islands | 3213.242454 |
| Canada | 63.06532406 |
| Cayman Islands | 583.4305718 |
| Chile | 14.08303642 |
| China | 132.4206268 |
| Croatia | 37.82542647 |
| Cuba | 50 |
| Estonia | 58.57468272 |
| Liechtenstein | 241.3515688 |
| Namibia | 213.4986226 |
| New Caledonia | 410.1416853 |
| Singapore | 82.3723229 |
| South Korea | 109.3267449 |
| West Bank | 109.469075 |
| Denmark | 153.3836386 |
| Egypt | 4.782868346 |
| France | 24.48213763 |
| Finland | 14.96563543 |
| Germany | 80.31506944 |
| Greece | 4.586485987 |
| Iceland | 65.68215865 |
| India | 33.74508924 |
| Ireland | 26.1446459 |
| Israel | 129.8383602 |
| Italy | 13.98330305 |
| Japan | 34.80244193 |
| Kuwait | 15.52818983 |
| Luxembourg | 115.1279201 |
| Malaysia | 28.50301948 |
| Mexico | 12.25681573 |
| Netherlands | 144.4741169 |
| New Zealand | 29.26473268 |
| Norway | 4.600335105 |
| Poland | 4.097081211 |
| Portugal | 8.824310321 |
| Russia | 5.429688126 |
| South Africa | 8.688847411 |
| Spain | 44.17366417 |
| Sweden | 90.73888419 |
| Switzerland | 150.2477732 |
| Taiwan | 23.75337213 |
| Turkey | 1.826462361 |
| United Kingdom | 54.50926192 |
| United States | 95.49089738 |
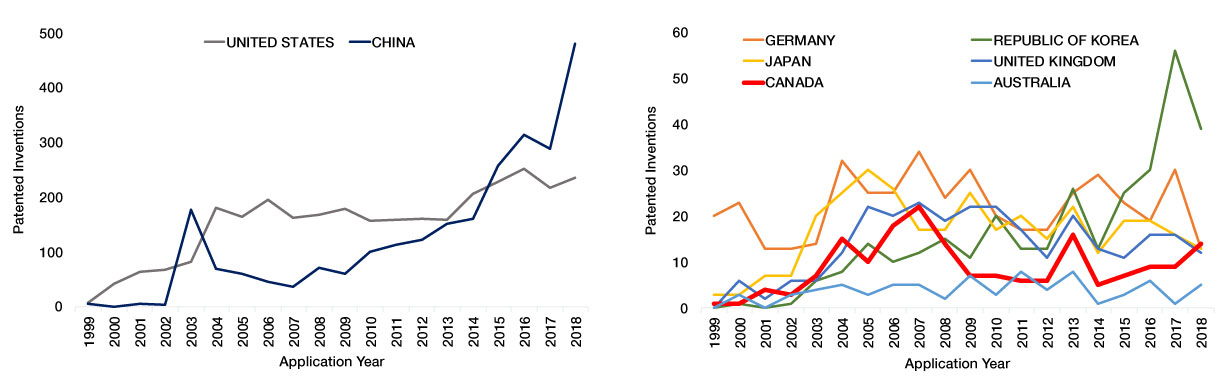
Figure 7 showcases the growth in patented inventions for select countries in this field. Chinese institutions have made considerable headway between 2009 and 2018 and have recorded an average annual growth rate of 26%, which is significantly higher than the 8% average annual growth rate observed by institutions worldwide during this same period.Footnote v In line with the worldwide average annual growth rate, Canadian institutions also experienced an average annual growth rate of 8% over the second half of the 20-year timeframe and it is encouraging to see this growth being almost on par with institutions from leading economies like Germany and Japan.
Figure 7: Global patent filing trend for pandemic mitigation technologies by institution's country of origin between 1999 and 2018
Description of figure 7
| Application Year | United States | China | Germany | Republic of Korea | Japan | United Kingdom | Canada | Australia |
|---|---|---|---|---|---|---|---|---|
| 1999 | 7 | 5 | 20 | - | 3 | - | 1 | - |
| 2000 | 43 | 1 | 23 | 1 | 3 | 6 | 1 | 3 |
| 2001 | 64 | 5 | 13 | - | 7 | 2 | 4 | - |
| 2002 | 68 | 4 | 13 | 1 | 7 | 6 | 3 | 3 |
| 2003 | 83 | 178 | 14 | 6 | 20 | 6 | 7 | 4 |
| 2004 | 182 | 70 | 32 | 8 | 25 | 12 | 15 | 5 |
| 2005 | 165 | 61 | 25 | 14 | 30 | 22 | 10 | 3 |
| 2006 | 195 | 46 | 25 | 10 | 26 | 20 | 18 | 5 |
| 2007 | 163 | 36 | 34 | 12 | 17 | 23 | 22 | 5 |
| 2008 | 168 | 72 | 24 | 15 | 17 | 19 | 14 | 2 |
| 2009 | 179 | 60 | 30 | 11 | 25 | 22 | 7 | 7 |
| 2010 | 158 | 100 | 20 | 20 | 17 | 22 | 7 | 3 |
| 2011 | 160 | 113 | 17 | 13 | 20 | 17 | 6 | 8 |
| 2012 | 161 | 122 | 17 | 13 | 15 | 11 | 6 | 4 |
| 2013 | 160 | 152 | 25 | 26 | 22 | 20 | 16 | 8 |
| 2014 | 207 | 161 | 29 | 13 | 12 | 13 | 5 | 1 |
| 2015 | 228 | 257 | 23 | 25 | 19 | 11 | 7 | 3 |
| 2016 | 253 | 315 | 19 | 30 | 19 | 16 | 9 | 6 |
| 2017 | 218 | 289 | 30 | 56 | 16 | 16 | 9 | 1 |
| 2018 | 236 | 480 | 13 | 39 | 13 | 12 | 14 | 5 |
IP Concentration among Countries
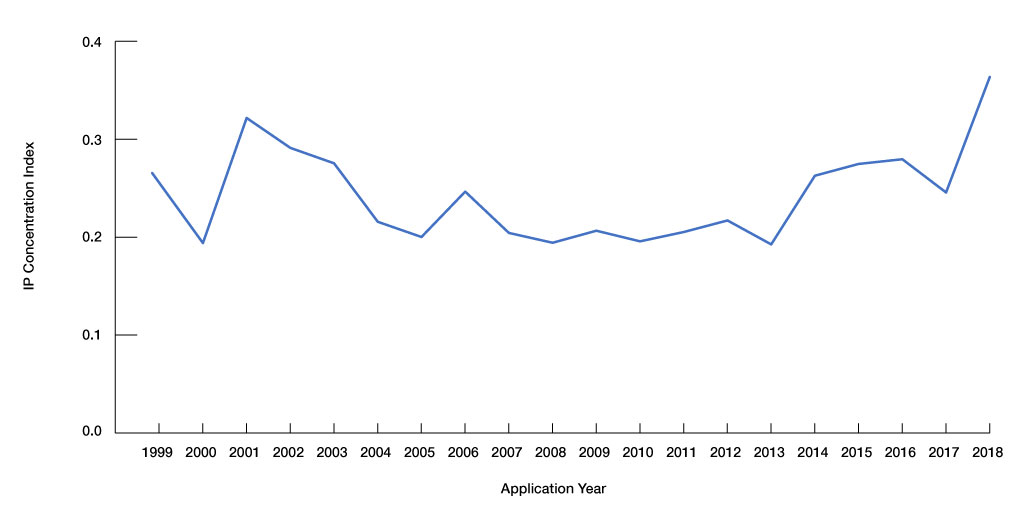
In order to gauge the degree of concentration of patented inventions globally, CIPO has developed a metric called the Intellectual Property Concentration Index (IPCI). This index can be used to determine the competitiveness of an industry or technology field based on the distribution of patented inventions held by all the countries active in that industry or field (additional details in Annex C). Index values closer to 0 indicate a more competitive global environment with no single country dominating, whereas index values closer to 1 would indicate a more concentrated global environment with one country clearly dominating.
Figure 8 shows the change in IPCI value over time for pandemic mitigation technologies for all institutions worldwide. After observing a peak value of 0.32 in 2001, the IPCI gradually stabilizes to a value of around 0.2 between application years 2004 and 2013. After 2013, one can notice an upward trend in the IPCI value over time which eventually attains its peak value of 0.36 in 2018. This uptick in IPCI value indicates an increase in patent activity from institutions originating from a few select countries. Based on the trend observed in Figure 7, this uptick in IPCI value is a result of the surge in patented inventions by Chinese institutions. The remaining countries, including Canada, form a competitive fringe to this dominant position.
Figure 8: Intellectual Property Concentration Index for pandemic mitigation technologies between 1999 and 2018
Description of figure 8
| Application Year | IPCI |
|---|---|
| 1999 | 0.265432 |
| 2000 | 0.194001 |
| 2001 | 0.321704 |
| 2002 | 0.291179 |
| 2003 | 0.275415 |
| 2004 | 0.215706 |
| 2005 | 0.200182 |
| 2006 | 0.246505 |
| 2007 | 0.204311 |
| 2008 | 0.194294 |
| 2009 | 0.206581 |
| 2010 | 0.195737 |
| 2011 | 0.20526 |
| 2012 | 0.217061 |
| 2013 | 0.192628 |
| 2014 | 0.262763 |
| 2015 | 0.274778 |
| 2016 | 0.279578 |
| 2017 | 0.245647 |
| 2018 | 0.363546 |
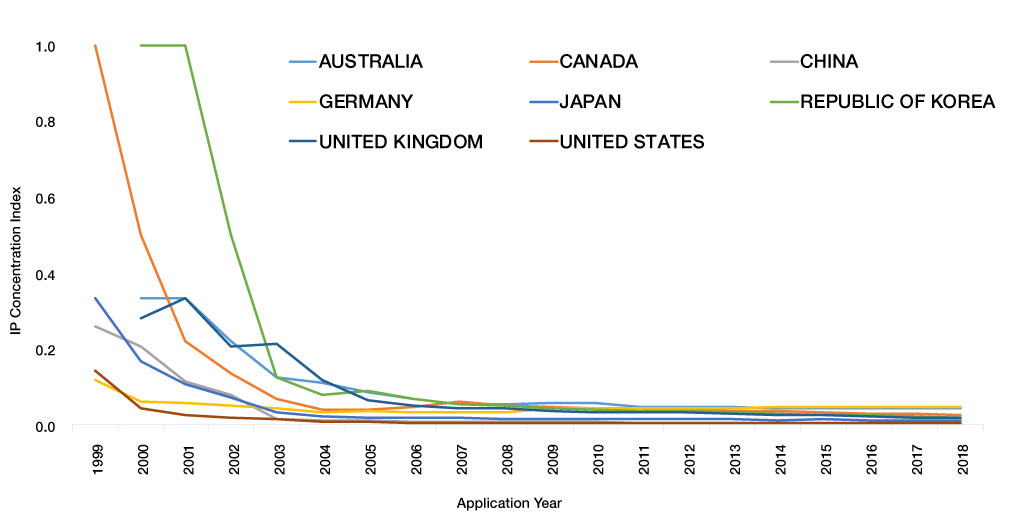
In contrast to presenting the aggregated shift in concentration of patented inventions across all countries as in Figure 8, the IPCI in Figure 9 captures the degree of competitiveness for institutions originating from each respective country for pandemic mitigation technologies. When a new technology typically emerges into the marketplace, there are relatively few institutions engaged in this new field. As a result, these institutions operate in a less competitive environment and their country's IPCI value is therefore expected to be high; that is, closer to 1. As this technology matures over time and becomes recognized globally, the market becomes a more competitive environment as new institutions enter, resulting in the IPCI declining over time. The trends observed in Figure 9 align with these expectations as the IPCI for all countries, including Canada, is observed to be below 0.1.
Figure 9: Intellectual Property Concentration Index for institutions from select countries for pandemic mitigation technologies between 1999 and 2018
Description of figure 9
| Application Year | Australia | Canada | China | Germany | Japan | Republic of Korea | United Kingdom | United States |
|---|---|---|---|---|---|---|---|---|
| 1999 | - | 1.0000 | 0.2593 | 0.1200 | 0.3333 | - | - | 0.1429 |
| 2000 | 0.3333 | 0.5000 | 0.2066 | 0.0603 | 0.1667 | 1.0000 | 0.2800 | 0.0429 |
| 2001 | 0.3333 | 0.2222 | 0.1136 | 0.0577 | 0.1076 | 1.0000 | 0.3333 | 0.0263 |
| 2002 | 0.2222 | 0.1358 | 0.0782 | 0.0496 | 0.0725 | 0.5000 | 0.2066 | 0.0197 |
| 2003 | 0.1247 | 0.0703 | 0.0156 | 0.0449 | 0.0336 | 0.1250 | 0.2133 | 0.0145 |
| 2004 | 0.1097 | 0.0395 | 0.0118 | 0.0322 | 0.0240 | 0.0793 | 0.1176 | 0.0092 |
| 2005 | 0.0848 | 0.0411 | 0.0108 | 0.0365 | 0.0185 | 0.0889 | 0.0640 | 0.0080 |
| 2006 | 0.0680 | 0.0462 | 0.0101 | 0.0336 | 0.0186 | 0.0691 | 0.0523 | 0.0065 |
| 2007 | 0.0547 | 0.0607 | 0.0094 | 0.0336 | 0.0183 | 0.0553 | 0.0449 | 0.0061 |
| 2008 | 0.0548 | 0.0509 | 0.0087 | 0.0321 | 0.0162 | 0.0503 | 0.0427 | 0.0055 |
| 2009 | 0.0576 | 0.0486 | 0.0081 | 0.0427 | 0.0166 | 0.0454 | 0.0364 | 0.0051 |
| 2010 | 0.0569 | 0.0455 | 0.0073 | 0.0432 | 0.0163 | 0.0406 | 0.0340 | 0.0048 |
| 2011 | 0.0484 | 0.0437 | 0.0067 | 0.0432 | 0.0152 | 0.0384 | 0.0346 | 0.0046 |
| 2012 | 0.0463 | 0.0405 | 0.0061 | 0.0424 | 0.0144 | 0.0382 | 0.0322 | 0.0044 |
| 2013 | 0.0469 | 0.0357 | 0.0055 | 0.0454 | 0.0144 | 0.0346 | 0.0298 | 0.0043 |
| 2014 | 0.0455 | 0.0362 | 0.0052 | 0.0485 | 0.0138 | 0.0312 | 0.0267 | 0.0041 |
| 2015 | 0.0443 | 0.0337 | 0.0050 | 0.0472 | 0.0142 | 0.0281 | 0.0247 | 0.0041 |
| 2016 | 0.0453 | 0.0313 | 0.0045 | 0.0486 | 0.0138 | 0.0258 | 0.0223 | 0.0039 |
| 2017 | 0.0446 | 0.0300 | 0.0041 | 0.0474 | 0.0135 | 0.0216 | 0.0206 | 0.0038 |
| 2018 | 0.0427 | 0.0269 | 0.0038 | 0.0476 | 0.0135 | 0.0206 | 0.0196 | 0.0037 |
Global Patent Landscape
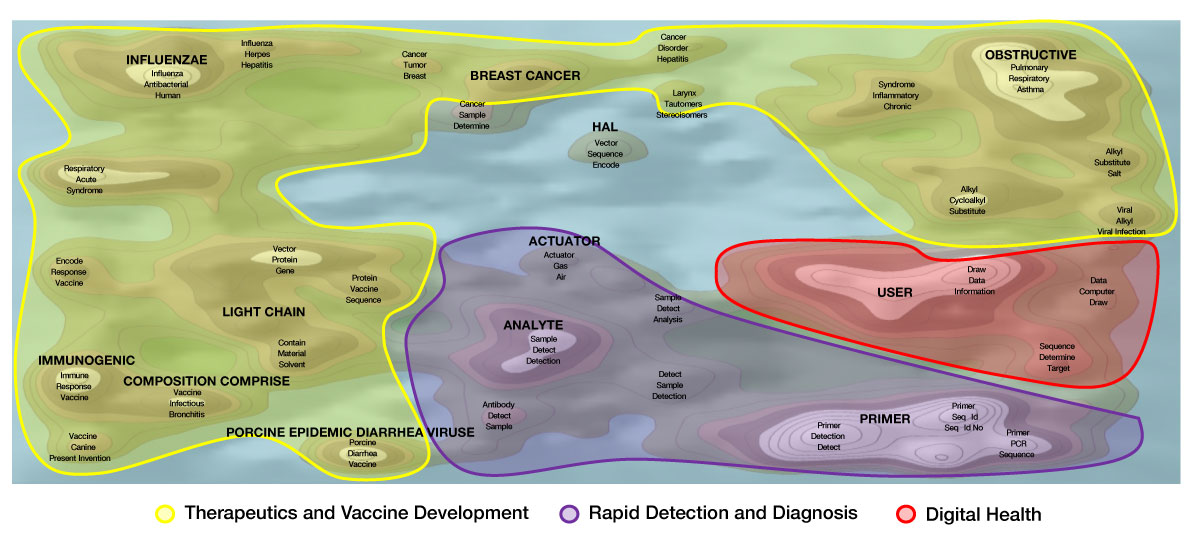
The patent landscape map presented in Figure 10 is helpful in identifying the key areas that experienced high patent activity for pandemic mitigation technologies. This map is generated using an algorithm that relies on word sequences from patent documentation to cluster patented inventions according to shared language. The patented inventions are organized based on common themes and grouped as "contours" on the map to identify areas of high and low patent activity. The white peaks represent the highest concentrations of patented inventions, and each peak is labelled with key terms that tie the common themes together. The contours are further highlighted to represent the research areas they fall under. The distance between word sequences helps to illustrate the relationship between peaks, where shorter distances indicate that the patented inventions they represent share more commonalities relative to those that are further apart. Word sequences located close together may be part of similar systems or technologies, whereas word sequences that are further apart are less likely to be related or share less in common.
Figure 10 highlights the overlap between pandemic mitigation technologies and other foundational technologies that were initiated between 1999 and 2018. Coronavirus induces many symptoms similar to that of other viral respiratory infections, such as influenza and many of the interventions were originally intended for other infections. This explains why inventions that relate to research on the pathophysiological mechanisms of influenza infections, and of other bacteria, are of great value as pandemic mitigation. Similarly, it is expected that gastrointestinal and pulmonary inflammatory conditions appear in Figure 10, as coronavirus is known to cause both respiratory and gastrointestinal symptoms.Endnote 8 Indeed, mechanisms of immune response to these conditions and to cancer are also implicated in the immune response to coronavirus, which explains the overlap with the patented inventions related to light chain of antibody immunoglobulins. Similarly, for the Rapid Detection and Diagnosis research area, the patented inventions related to primers, polymerase chain reactions and antibodies are valuable foundational technologies for the pandemic.
Figure 10: International patent landscape map for pandemic mitigation technologies
Description of figure 10
Figure 10 is a patent landscape map that provides a visual representation of global patent activities in data set in this report. Derwent Innovation's ThemeScape mapping tool was utilized to produce this visualization, using term frequency (keywords from a patents title and abstract) and other algorithms to cluster documents based on shared language. The result is a patent landscape map, a map very much resembling that of a topographic map, where there are sections of turquoise and white. Areas pertaining to Digital Health are highlighted in red, areas pertaining to Rapid Detection and Diagnosis are highlighted in purple and regions pertaining to Therapeutics and Vaccine Development are highlighted in yellow. Sections are comprised of peaks, some of which have bright white peaks, representing the highest concentration of patents and are labelled with key terms that tie common themes together. Turquoise is used to separate terms where there is no commonality between them. The legend provides more details on the top inventors and key words as described in the report.
Broad themes written in all capital letters include:
- Influenzae
- Immunogenic
- Light Chain
- Composition Comprise
- Porcine Epidemic Diarrhea Virus
- Breast Cancer
- Hal
- Actuator
- Analyte
- Obstructive
- Heterocyclic
- User
- Primer
Prominent word sequences in this graph include:
- Influenza Antibacterial Human
- Respiratory Acute Syndrome
- Encode Response Vaccine
- Immune Response Vaccine
- Vaccine Canine Present Invention
- Vaccine Infectious Bronchitis
- Porcine Diarrhea Vaccine
- Contain Material Solvent
- Vector Protein Gene
- Influenza Herpes Hepatitis
- Cancer Tumor Breast
- Protein Vaccine Sequence
- Antibody Detect Sample
- Sample Detect Detection
- Actuator Gas Air
- Cancer Sample Determine
- Vector Sequence Encode
- Cancer Disorder Hepatitis
- Larynx Tautomers Stereoisomers
- Sample Detect Analysis
- Detect Sample Detection
- Syndrome Inflammatory Chronic
- Alkyl Cycloalkyl Substitute
- Draw Data Information
- Primer Detection Detect
- Primer Seq Id Seq Id No
- Primer PCR Sequence
- Sequence Determine Target
- Data Computer Draw
- Pulmonary Respiratory Asthma
- Alkyl Substitute Salt
- Viral Alkyl Viral Infection