
View as PDF (PDF: 13.3 MB; 20 pages)

Female scientist dressed in a lab coat, observing the contents of a transparent beaker (with greenhouse in the background).
Photo credit: University of Ottawa
On this page
- Executive Summary
- Introduction
- Data and Methodology
- The Share of Inventors Who Are Women
- Comparing Women's Participation in Business and Academic PCT Applications
- Women's Participation in PCT Applications by Technology Area
- Technology Area Adjustment and Analysis
- Trends in Women's Participation in PCT Applications
- Comparative Analysis
- Understanding Structural Factors
- Conclusion
- Bibliography
Executive Summary
In 2016, the World Intellectual Property Organization (WIPO) performed an analysis of international patent applications filed under the Patent Cooperation Treaty (PCT) to determine the share of inventors who are women and the share of PCT applications with at least one woman inventor. In this report, the Canadian Intellectual Property Office (CIPO) adds to this analysis by studying PCT applications filed under the PCT by Canadian applicants, and finds that Canada has seen little change in the share of inventors who are women in the last 15 years, while the world share continues to grow.
From 1997 to 2015, women inventors named on PCT applications originating in Canada grew by 377%, while men inventors grew by 285%. Although inventors who are men still outnumber those who are women by a seven-to-one ratio, this is an improvement from the nine-to-one ratio seen in the late 1990s. The share of inventors on Canadian PCT applications who are women in 2015 was 12%, i.e. less than one in eight. This is roughly the same as the share for G7 countries, and below the world share of 15%. An adjustment calculation based on technology areas shows that a small portion of the gap between the Canadian data and the world is explained by differences in technological concentrations. Furthermore, in 2015, 24% of PCT applications originating in Canada had at least one woman inventor, versus 25% in the G7 and 29% in the world overall.
The data presented here is internally consistent and shows a lack of improvement in women's participation in Canada since the early 2000s. This general trend is present in both groups of inventors who work on patented inventions and in the number of inventors overall. Although Canada's performance is similar to other G7 countries, the overall stagnation in women's participation in these countries is noteworthy.
Data from Statistics Canada shows that the share of Canadian women engaged in patenting activity has been persistently lower than the share of jobs held by women in the fields of science, technology, engineering and mathematics (STEM). In other words, women's low participation in PCT applications is not simply a pipeline problem associated with relatively low numbers of women in those fields.
This report contains numerous graphs, including: the share of inventors who are women, over time and by sector; the sector-adjusted share of inventors who are women in Canada; the contribution of each sector to the gap between Canada and the world; the shares of PCT applications with at least one woman inventor, with only women inventors, and with majority women inventors; the share of women inventors in business patenting and in academic patenting; and the number of inventors per patent in Canada.
Introduction

Female scientist observing the contents of a vial.
Photo credit: University of Ottawa
In November 2016, the World Intellectual Property Organization (WIPO) released a special section of its annual report which dealt with women's participation in the PCT filing. The WIPO analysis relied on a comprehensive name dictionary to assign genders to the names of inventors listed on PCT applications filed under the Patent Cooperation Treaty (PCT). It found that the share of PCT applications with at least one woman inventor increased from 17% in 1999 to 29% in 2015. The PCT provides a mechanism for an applicant to seek patent protection in multiple national jurisdictions through the filing of a single PCT application.Footnote 1 This is often convenient for the filer, thereby reducing the costs inherent in the patent application process. One hundred fifty-one (151) countries, including Canada, are Contracting Parties to the PCT. Accordingly, it represents a rich source of data for global analysis. This gender name dictionary methodology is not unprecedented; a similar methodology was applied to patent applications filed with the United States Patent and Trademark Office in 2012 by the National Women's Business Council, which found a similar gap between men and women's participation rates in American domestic patenting activity.Footnote 2
The present report by CIPO continues from the work of WIPO on all PCT applications to focus more closely on the Canadian case. The data here is drawn from PCT applications originating from Canadian applicants. Analysis of patent applications filed by Canadian applicants directly with CIPO, or Canada‑designated national patent applications filed with CIPO under the PCT, while a future goal of our research, is not considered in this report.
The desire to encourage participation by women in the fields of science, technology, engineering and mathematics (STEM) is frequently discussed through the lens of STEM education. This is certainly a vital piece of the puzzle; however, our understanding of gender participation must also consider the opportunities available to women later in their careers. In particular, this study of gender participation in the PCT filing system provides a useful tool to understand the systemic barriers that women may face at later stages in their careers.
This report is structured as follows: The next section presents the data and methodology, including a discussion on the name dictionary that is the underpinning of the WIPO study. We then look at the share of inventors who are women and make comparisons to the G7 and the global trends. Following this we compare women's participation in business and academic PCT applications. We go on to present women's participation in PCT applications by technology area and then do an adjustment to see whether differences in technology sectors can explain the gender gap. The final analysis on the WIPO data looks at different measures of women's participation, including: at least one women inventor, majority women inventors, or only women inventors. The next two sections look at the some of the structural factors, including the participation of women in science, technology, engineering and mathematics (STEM) jobs, and integrates this with the patent analysis. The final section concludes this report.
Data and Methodology
This report uses data obtained from WIPO which has had gender assigned using a name dictionary. Before WIPO performed this data analysis, no data on gender and PCT applications existed. The name dictionary, which has been made publicly available by WIPO, is a compilation of name dictionaries from around the world, including 6.2 million names catalogued over 182 countries.Footnote 3 The name dictionary matches the name of each inventor with a likely gender and is country-dependent; for example, it assigns the name "Jean" as a woman's name in the United States but as a man's name in France. One of the sources is the Alberta government.Footnote 4 Accordingly, the name dictionary does contain some names of indigenous Canadians in Alberta, but may not cover all indigenous Canadian names. Otherwise, the global reach of this name dictionary means that it is appropriate for use in a multicultural society such as Canada.
In Canada, some names may be difficult to assign because they are male in French but female in English, or vice versa. These names, such as "Jean", are coded as ambiguous and are not assigned a gender. Names such as Blair, Boston, Nicky and Ocean are also not assigned a gender in Canada. Unassigned names make up 3% of the sample and are a fairly consistent percentage over time. As such, they are excluded from the analysis. However, many compound names, such as "Jean Pierre", are recognized and assigned a gender.
The dictionary matching process is complex and involves multiple techniques that consider different types of information. Factors considered include: first, middle and full names; country of residency; nationality; and language. As well, specialized techniques are used for Chinese and Korean characters. All of these techniques produce a 97% assignment rate for the Canadian data. We recognize the possibility of errors in gender assignment, but most assignment errors would be non-systematic (i.e. male-to-female as often as the reverse) and consistent over time. This makes trend analysis over the 20 years of the data set a useful exercise. As well, we recognize the problems with a strictly binary conception of gender, but this data set limits us to the analysis of traditionally assigned men and women's names. Despite these limitations, the findings here provide a useful lens to understand gender differences in outcome.
For each PCT application filed under the PCT system, the number of inventors who are given names coded in the name dictionary as men or women are counted, and the total number of women is then divided by the total number of inventors in that year. This may involve some double counting of inventors of either gender if they are listed on multiple PCT applications in that year, but it still provides a useful representation of the trend over time. Even if some of the inventors are counted more than once due to multiple inventions, it is still useful gender representation information because the opportunity to be involved in multiple inventions each year is also valuable. In addition, we use a three‑year average of the measure to smooth the data and eliminate short-term fluctuations. This allows for a clearer picture of the long-run trends, which is what we are interested in. As we can see, the share of women inventors in Canada has declined steadily since 2005.
The result of the matching allows us to compare the growth of women and men inventors on PCT applications originating in Canada. Figure 1 shows that the number of male and female inventors on PCT applications originating in Canada has increased significantly since 1997.
| Year | Female Inventors | Male Inventors |
|---|---|---|
| 1997 | 190 | 1,697 |
| 1998 | 238 | 2,118 |
| 1999 | 302 | 2,436 |
| 2000 | 364 | 2,850 |
| 2001 | 468 | 3,295 |
| 2002 | 560 | 3,901 |
| 2003 | 689 | 4,445 |
| 2004 | 746 | 4,692 |
| 2005 | 772 | 4,726 |
| 2006 | 760 | 4,859 |
| 2007 | 809 | 5,086 |
| 2008 | 888 | 5,710 |
| 2009 | 924 | 5,979 |
| 2010 | 897 | 5,987 |
| 2011 | 858 | 5,859 |
| 2012 | 835 | 5,808 |
| 2013 | 872 | 6,174 |
| 2014 | 889 | 6,433 |
| 2015 | 904 | 6,528 |
While Figure 1 shows the number of inventors by gender, Figure 2 compares the growth rate. By indexing both series to 100 in 1997, we can see the different growth paths of women and men inventors named on PCT applications originating in Canada. While inventors who are men still outnumber those who are women by seven-to-one, this is an improvement from the nine-to-one ratio seen in the late 1990s. Over the sample period, women inventors named on PCT applications originating in Canada grew by 377%, while men inventors grew by 285%. Despite this positive result, Canada is losing ground in most metrics of women's participation in PCT applications when compared to the world and G7.
| Year | Female Inventors | Male Inventors |
|---|---|---|
| 1997 | 100 | 100 |
| 1998 | 126 | 125 |
| 1999 | 159 | 144 |
| 2000 | 192 | 168 |
| 2001 | 247 | 194 |
| 2002 | 295 | 230 |
| 2003 | 363 | 262 |
| 2004 | 393 | 276 |
| 2005 | 407 | 278 |
| 2006 | 401 | 286 |
| 2007 | 427 | 300 |
| 2008 | 468 | 336 |
| 2009 | 487 | 352 |
| 2010 | 473 | 353 |
| 2011 | 452 | 345 |
| 2012 | 440 | 342 |
| 2013 | 460 | 364 |
| 2014 | 469 | 379 |
| 2015 | 477 | 385 |
The Share of Inventors Who Are Women
In Figure 3, we see the changes in the share of inventors who are women over time. This metric counts women, from anywhere, who are inventors listed on PCT applications with a Canadian first applicant. In other words, these are women working for or with Canadian filers. This is a slightly distinct measure from considering inventors of Canadian nationality, but the trends over time are almost identical.
| Year | Canada |
|---|---|
| 1997 | 10.0% |
| 1998 | 10.1% |
| 1999 | 11.0% |
| 2000 | 11.3% |
| 2001 | 12.4% |
| 2002 | 12.5% |
| 2003 | 13.4% |
| 2004 | 13.7% |
| 2005 | 14.0% |
| 2006 | 13.5% |
| 2007 | 13.7% |
| 2008 | 13.5% |
| 2009 | 13.4% |
| 2010 | 13.0% |
| 2011 | 12.8% |
| 2012 | 12.6% |
| 2013 | 12.4% |
| 2014 | 12.1% |
| 2015 | 12.2% |
The marked growth in the share of women inventors is visible at the beginning of the time period, from 1997 to 2005. Since then, the trend has been downward or negative. In Figure 4 we see the shares of women who are inventors for each of the G7 countries (the US, the UK, France, Germany, Italy, Japan and Canada). Canadian women's participation rate is consistently higher than Germany or Japan, but lower than France.
| Year | Canada | France | Germany | Italy | Japan | US | UK |
|---|---|---|---|---|---|---|---|
| 1997 | 10.0% | 13.4% | 5.8% | 12.4% | 7.0% | 10.9% | 8.3% |
| 1998 | 10.1% | 13.7% | 5.8% | 12.5% | 6.9% | 11.2% | 8.7% |
| 1999 | 11.0% | 14.2% | 5.9% | 12.7% | 6.8% | 11.5% | 9.3% |
| 2000 | 11.3% | 13.9% | 6.2% | 12.2% | 6.8% | 12.1% | 10.1% |
| 2001 | 12.4% | 14.5% | 6.6% | 12.0% | 7.0% | 12.6% | 10.6% |
| 2002 | 12.5% | 14.9% | 7.1% | 12.0% | 6.9% | 13.6% | 11.0% |
| 2003 | 13.4% | 15.4% | 7.5% | 12.7% | 6.9% | 14.1% | 11.2% |
| 2004 | 13.7% | 15.5% | 7.7% | 13.0% | 7.0% | 14.3% | 11.7% |
| 2005 | 14.0% | 15.3% | 8.0% | 13.6% | 7.1% | 13.6% | 11.9% |
| 2006 | 13.5% | 15.2% | 8.0% | 13.8% | 7.1% | 13.1% | 12.0% |
| 2007 | 13.7% | 15.2% | 8.0% | 14.2% | 7.1% | 12.8% | 11.8% |
| 2008 | 13.5% | 15.2% | 7.9% | 14.0% | 7.1% | 12.7% | 11.8% |
| 2009 | 13.4% | 15.4% | 8.1% | 13.5% | 7.3% | 12.8% | 11.7% |
| 2010 | 13.0% | 15.7% | 8.6% | 14.0% | 7.4% | 13.1% | 11.8% |
| 2011 | 12.8% | 16.1% | 9.1% | 14.1% | 7.6% | 13.4% | 11.8% |
| 2012 | 12.6% | 16.6% | 9.1% | 14.4% | 7.8% | 13.4% | 12.1% |
| 2013 | 12.4% | 17.2% | 9.2% | 13.9% | 8.0% | 13.5% | 12.2% |
| 2014 | 12.1% | 17.9% | 9.4% | 13.6% | 8.2% | 13.5% | 12.0% |
| 2015 | 12.2% | 17.8% | 9.8% | 13.2% | 8.4% | 13.9% | 12.1% |
In Figure 5, we compare Canada to the G7, to the world as a whole, and to the world without China and South Korea. Excluding those two developing countries from the world average helps us understand the trend more clearly, because they are driving most of the growth. China and South Korea both have a well-above-average rate of women's participation, so their rapid growth in total patent filings over the last 15 years has dramatically boosted the average.
| Year | Canada | G7 | World | World Without China and South Korea |
|---|---|---|---|---|
| 2003 | 13.4% | 11.6% | 11.9% | 11.6% |
| 2004 | 13.7% | 11.7% | 12.1% | 11.7% |
| 2005 | 14.0% | 11.3% | 11.9% | 11.5% |
| 2006 | 13.5% | 10.9% | 11.9% | 11.3% |
| 2007 | 13.7% | 10.8% | 12.0% | 11.2% |
| 2008 | 13.5% | 10.8% | 12.2% | 11.3% |
| 2009 | 13.4% | 10.9% | 12.5% | 11.4% |
| 2010 | 13.0% | 11.1% | 13.0% | 11.6% |
| 2011 | 12.8% | 11.2% | 13.5% | 11.7% |
| 2012 | 12.6% | 11.3% | 13.9% | 11.8% |
| 2013 | 12.4% | 11.3% | 14.1% | 11.8% |
| 2014 | 12.1% | 11.5% | 14.4% | 12.0% |
| 2015 | 12.2% | 11.8% | 14.7% | 12.3% |
To understand why the inclusion of China and South Korea has such a significant impact on the overall global rate of women's participation, examine Figure 6. We see that China and South Korea both have a women's participation rate that is well above the rest of the world. As those two counties have made up an increasingly large fraction of global patenting activity due to their rapid growth over the last decade, they have thus increased the world average.
| Year | World | World Without China and South Korea | China | South Korea |
|---|---|---|---|---|
| 2003 | 11.9% | 11.6% | 20.2% | 22.6% |
| 2004 | 12.1% | 11.7% | 27.8% | 23.2% |
| 2005 | 11.9% | 11.5% | 30.6% | 23.5% |
| 2006 | 11.9% | 11.3% | 29.5% | 23.7% |
| 2007 | 12.0% | 11.2% | 27.8% | 23.7% |
| 2008 | 12.2% | 11.3% | 26.7% | 23.9% |
| 2009 | 12.5% | 11.4% | 26.7% | 24.0% |
| 2010 | 13.0% | 11.6% | 27.7% | 24.8% |
| 2011 | 13.5% | 11.7% | 28.1% | 25.8% |
| 2012 | 13.9% | 11.8% | 28.5% | 27.0% |
| 2013 | 14.1% | 11.8% | 28.3% | 26.8% |
| 2014 | 14.4% | 12.0% | 29.0% | 26.9% |
| 2015 | 14.7% | 12.3% | 29.2% | 26.8% |
The relative comparison is presented more clearly in Figure 7. This shows the share of inventors who are women, minus the share in the world or in the G7. We can see that Canada was well above the G7 average for most of the 2000s, but has declined in relative terms more recently and is now roughly on par with the G7 average, and well below the world average.
| Year | Canada relative to world | Canada relative to G7 |
|---|---|---|
| 2003 | 1.5% | 1.7% |
| 2004 | 1.6% | 2.0% |
| 2005 | 2.1% | 2.8% |
| 2006 | 1.7% | 2.6% |
| 2007 | 1.7% | 2.9% |
| 2008 | 1.3% | 2.7% |
| 2009 | 0.9% | 2.5% |
| 2010 | 0.0% | 1.9% |
| 2011 | -0.7% | 1.6% |
| 2012 | -1.3% | 1.3% |
| 2013 | -1.7% | 1.0% |
| 2014 | -2.2% | 0.6% |
| 2015 | -2.5% | 0.4% |
Comparing Women's Participation in Business and Academic PCT Applications
In Figure 8, we see the share of inventors who are women in PCT applications that are affiliated with companies and the share that are affiliated with academic institutions. Both are compared to the G7. The private sector tends to have a lower rate of women's participation than the academic sector. For business patent applications, the share of women participating in Canadian-origin PCT applications is now lower than it was 13 years ago. Canada had declined from its mid-2000 peak, while the G7 has improved. The share of women participating in PCT applications from Canada's academic sector in 2015 was 19%, lower than it was in the early 2000s. Canada's share is now roughly the same as the G7 share.
Individual inventors who are not formally affiliated with an academic or business institution on their patent application could nonetheless be academic in nature. Some academic institutions have different policies regarding the requirements for signalling affiliation in a patent. As such, these academic shares may not reflect such cases. This paper does not include analysis of individual inventors for that reason, because we are unable to establish whether or not they are truly independent entrepreneurs.
| Year | Canadian Academic Share | G7 Academic Share | Canadian Business Share | G7 Business Share |
|---|---|---|---|---|
| 1997 | 17.6% | 16.1% | 9.1% | 9.1% |
| 1998 | 18.1% | 16.2% | 9.2% | 9.2% |
| 1999 | 19.8% | 17.1% | 9.6% | 9.4% |
| 2000 | 20.2% | 17.4% | 10.1% | 9.8% |
| 2001 | 21.7% | 17.8% | 11.1% | 10.2% |
| 2002 | 23.3% | 17.6% | 11.4% | 10.9% |
| 2003 | 24.4% | 17.7% | 12.3% | 11.3% |
| 2004 | 23.5% | 17.6% | 12.7% | 11.3% |
| 2005 | 22.2% | 18.1% | 13.3% | 10.8% |
| 2006 | 20.4% | 18.0% | 12.9% | 10.4% |
| 2007 | 20.7% | 17.8% | 13.1% | 10.2% |
| 2008 | 21.4% | 17.7% | 12.7% | 10.2% |
| 2009 | 22.0% | 18.1% | 12.5% | 10.3% |
| 2010 | 21.0% | 18.6% | 12.0% | 10.4% |
| 2011 | 20.5% | 18.8% | 11.8% | 10.5% |
| 2012 | 20.9% | 18.9% | 11.3% | 10.6% |
| 2013 | 22.3% | 19.6% | 10.8% | 10.7% |
| 2014 | 21.8% | 19.7% | 10.6% | 10.9% |
| 2015 | 20.8% | 20.1% | 10.8% | 11.2% |
| 2016 | 19.5% | 19.8% | 11.0% | 11.5% |
Women's Participation in PCT Applications by Technology Area
To gain a more specific understanding, we can look at technology areas. In Figure 9, we see the shares of inventors who are women in 2015 and 2016 (the years are combined), broken down by technology area. The chart is organized such that the sectors on top represent those where Canada's share of women inventors is largest. The relatively small number of patent applications in some sectors means that the sample size of some of these sectors is very small. Thus, these results may be volatile year‑to‑year.
Figure 9: Women's Participation in PCT Applications by Technology Area
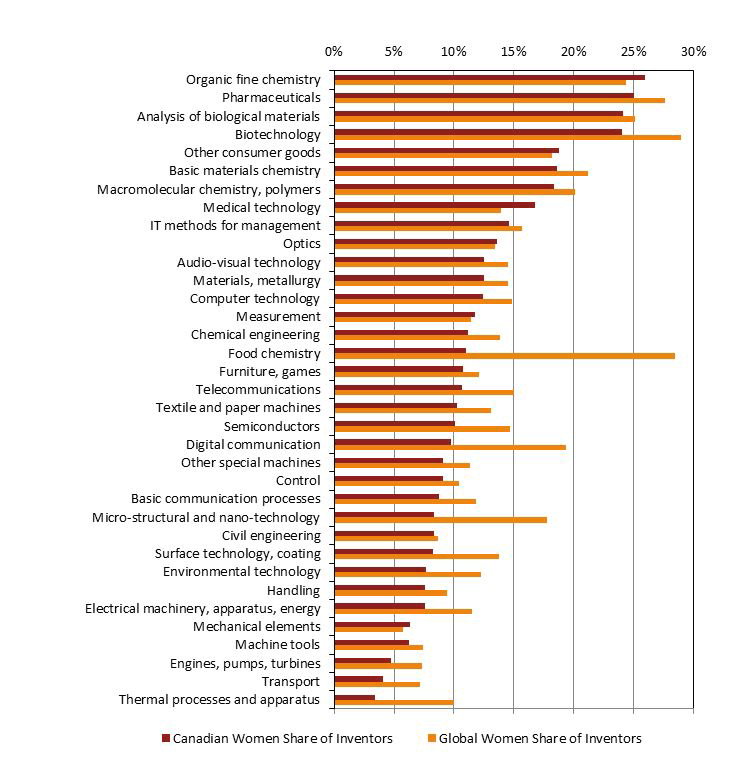
Figure 9 - Text version
| Technology Area | Canadian Women Share of Inventors | Global Women Share of Inventors |
|---|---|---|
| Thermal processes and apparatus | 3.4% | 10.0% |
| Transport | 4.1% | 7.1% |
| Engines, pumps, turbines | 4.8% | 7.3% |
| Machine tools | 6.3% | 7.5% |
| Mechanical elements | 6.3% | 5.8% |
| Electrical machinery, apparatus, energy | 7.6% | 11.5% |
| Handling | 7.6% | 9.4% |
| Environmental technology | 7.6% | 12.2% |
| Surface technology, coating | 8.2% | 13.8% |
| Civil engineering | 8.3% | 8.7% |
| Micro-structural and nano-technology | 8.4% | 17.7% |
| Basic communication processes | 8.8% | 11.8% |
| Control | 9.0% | 10.4% |
| Other special machines | 9.1% | 11.3% |
| Digital communication | 9.8% | 19.3% |
| Semiconductors | 10.1% | 14.7% |
| Textile and paper machines | 10.3% | 13.1% |
| Telecommunications | 10.7% | 15.0% |
| Furniture, games | 10.8% | 12.1% |
| Food chemistry | 11.0% | 28.4% |
| Chemical engineering | 11.1% | 13.8% |
| Measurement | 11.8% | 11.4% |
| Computer technology | 12.5% | 14.9% |
| Materials, metallurgy | 12.5% | 14.5% |
| Audio-visual technology | 12.5% | 14.5% |
| Optics | 13.6% | 13.4% |
| IT methods for management | 14.6% | 15.7% |
| Medical technology | 16.7% | 13.9% |
| Macromolecular chemistry, polymers | 18.3% | 20.1% |
| Basic materials chemistry | 18.6% | 21.2% |
| Other consumer goods | 18.8% | 18.2% |
| Biotechnology | 24.0% | 28.9% |
| Analysis of biological materials | 24.1% | 25.1% |
| Pharmaceuticals | 25.0% | 27.6% |
| Organic fine chemistry | 26.0% | 24.4% |
This chart reveals the difference between absolute and relative rates of participation. For example, biotechnology is one of the best sectors for women's participation in Canada—but compared to the world average, Canada actually lags. Conversely, while a sector like food chemistry has a higher share of women inventors in Canada than does mechanical elements (11.0% vs. 6.3%), women are actually overrepresented in the mechanical elements sector in Canada compared to the rest of the world, while the reverse is true in food chemistry.
Technology Area Adjustment and Analysis

Two female scientists standing in front of microscopes in a laboratory and looking at a computer screen.
Photo credit: University of Ottawa
Overall, the global share of inventors who are women in 2015 and 2016 was 15.4%. The corresponding Canadian share was 12.5%, or less than one in eight. However, Canadian inventors are focused in different sectors and technologies than the global average. To determine the impact of this difference, we performed a technology area adjustment. By calculating the share of inventors working in each of the 35 technology fields, as measured by the PCT classification code, we can understand the differences between the Canadian and global behaviour of inventors. For example, Canada has 13% of its listed inventors being on civil engineering patent applications, as opposed to just 2.6% globally.
We want to find what the Canadian women's participation share would be if Canadian inventors worked in technology areas at the same levels as the global average. By taking the Canadian women's participation shares for each technology area and multiplying them by the world sector weights, and then adding these numbers together, we can produce a technology-profile-adjusted Canadian women inventor share. For 2015 and 2016 combined, this was 12.8%, higher than the unadjusted share of 12.5%. This adjustment closes the gap very slightly, by 0.3%. Given this result, we can conclude that the gap is not primarily due to technology concentration differences. Figure 10 presents the result.
| Share | |
|---|---|
| Canada | 12.5% |
| Canada, Sector-Adjusted | 12.8% |
| World | 15.4% |
Another way of analyzing this issue is to look at the gap in each technology area between the Canadian level of women's participation and the global level. Figure 11 ranks technology areas by the size of this gap, with the areas where Canada has the highest relative level of women's participation at the top. We can see from this graph that women's participation in Canada lags behind the global share in most fields, with some fields lagging by double digits. Canada has a slightly higher share of women's participation in six sectors: medical technology, organic fine chemistry, other consumer goods, mechanical elements, measurement, and optics.
Figure 11: Canadian Share of Women Inventors Relative to World Share

Figure 11 - Text version
| Technology Area | Canada Advantage |
|---|---|
| Food chemistry | -17.4% |
| Digital communication | -9.6% |
| Micro-structural and nano-technology | -9.4% |
| Thermal processes and apparatus | -6.6% |
| Surface technology, coating | -5.5% |
| Biotechnology | -4.9% |
| Environmental technology | -4.6% |
| Semiconductors | -4.5% |
| Telecommunications | -4.3% |
| Electrical machinery, apparatus, energy | -3.9% |
| Transport | -3.1% |
| Basic communication processes | -3.0% |
| Textile and paper machines | -2.8% |
| Chemical engineering | -2.7% |
| Pharmaceuticals | -2.6% |
| Basic materials chemistry | -2.6% |
| Engines, pumps, turbines | -2.6% |
| Computer technology | -2.4% |
| Other special machines | -2.2% |
| Materials, metallurgy | -2.0% |
| Audio-visual technology | -1.9% |
| Handling | -1.8% |
| Macromolecular chemistry, polymers | -1.8% |
| Control | -1.4% |
| Furniture, games | -1.3% |
| Machine tools | -1.2% |
| IT methods for management | -1.1% |
| Analysis of biological materials | -1.0% |
| Civil engineering | -0.4% |
| Optics | 0.2% |
| Measurement | 0.3% |
| Mechanical elements | 0.6% |
| Other consumer goods | 0.6% |
| Organic fine chemistry | 1.6% |
| Medical technology | 2.8% |
Trends in Women's Participation in PCT Applications
The trend in women's participation can be seen when looking at the groups of inventors listed on PCT applications. Figure 12 shows the share of PCT applications that contain at least one woman inventor. This is a slightly distinct measure of women's participation, which considers only if there was participation by women as at least one co-inventor listed on the PCT application. In Canada, this indicator has remained in the same range since 2001. However, the global share passed Canada's in 2011 and continues to grow.
| Year | Canada | World |
|---|---|---|
| 1997 | 17.6% | 17.5% |
| 1998 | 18.1% | 18.0% |
| 1999 | 19.5% | 18.5% |
| 2000 | 20.5% | 19.2% |
| 2001 | 22.9% | 20.0% |
| 2002 | 23.6% | 20.8% |
| 2003 | 24.2% | 21.5% |
| 2004 | 24.2% | 22.0% |
| 2005 | 24.5% | 22.3% |
| 2006 | 24.5% | 22.5% |
| 2007 | 24.9% | 22.7% |
| 2008 | 25.1% | 23.1% |
| 2009 | 25.3% | 23.7% |
| 2010 | 25.3% | 24.8% |
| 2011 | 24.7% | 25.8% |
| 2012 | 24.3% | 26.6% |
| 2013 | 24.0% | 27.1% |
| 2014 | 23.8% | 27.7% |
| 2015 | 24.1% | 28.3% |
| 2016 | 24.4% | 29.1% |
Figure 13 compares the seven countries in the G7. We can see that Canada is third overall, and that most of the growth in the G7 total share of women's participation is being driven by France and the United States.
| Year | Canada | France | Germany | Italy | Japan | US | UK |
|---|---|---|---|---|---|---|---|
| 1997 | 17.6% | 21.9% | 12.1% | 16.8% | 18.4% | 20.5% | 14.4% |
| 1998 | 18.1% | 22.5% | 12.0% | 16.3% | 18.1% | 21.3% | 15.7% |
| 1999 | 19.5% | 23.7% | 12.2% | 16.5% | 17.6% | 21.9% | 16.5% |
| 2000 | 20.5% | 23.7% | 12.9% | 15.9% | 17.2% | 22.8% | 17.6% |
| 2001 | 22.9% | 24.9% | 13.8% | 16.1% | 17.2% | 23.6% | 18.1% |
| 2002 | 23.6% | 25.2% | 14.9% | 16.4% | 16.9% | 24.6% | 18.6% |
| 2003 | 24.2% | 25.8% | 15.6% | 17.7% | 16.9% | 25.2% | 18.9% |
| 2004 | 24.2% | 26.0% | 16.1% | 18.1% | 16.6% | 25.6% | 19.6% |
| 2005 | 24.5% | 26.0% | 16.5% | 18.6% | 16.7% | 25.6% | 20.2% |
| 2006 | 24.5% | 26.2% | 16.3% | 18.9% | 16.4% | 25.6% | 20.2% |
| 2007 | 24.9% | 26.3% | 16.3% | 19.0% | 16.0% | 25.5% | 19.7% |
| 2008 | 25.1% | 26.8% | 16.0% | 18.6% | 15.8% | 25.4% | 19.6% |
| 2009 | 25.3% | 27.2% | 16.5% | 17.9% | 16.0% | 25.9% | 19.5% |
| 2010 | 25.3% | 27.8% | 17.4% | 18.6% | 16.6% | 26.7% | 19.9% |
| 2011 | 24.7% | 28.1% | 18.2% | 18.9% | 17.2% | 27.5% | 19.9% |
| 2012 | 24.3% | 29.0% | 18.4% | 19.5% | 17.7% | 28.0% | 20.5% |
| 2013 | 24.0% | 30.0% | 18.5% | 19.0% | 18.0% | 28.3% | 20.8% |
| 2014 | 23.8% | 31.3% | 18.7% | 18.9% | 18.4% | 28.5% | 20.6% |
| 2015 | 24.1% | 31.5% | 19.2% | 18.4% | 18.8% | 29.3% | 20.9% |
In Figure 14, we compare Canada's share of PCT applications with at least one woman inventor to the shares of the G7, the world, and an adjusted world average that excludes China and South Korea. Although Canada led all of these averages as recently as 2010, our recent lack of improvement is contrasted with significant improvement for both the world and G7 averages.
| Year | Canada | World | World Without China and South Korea | G7 |
|---|---|---|---|---|
| 2003 | 24.2% | 21.5% | 21.1% | 21.7% |
| 2004 | 24.2% | 22.0% | 21.4% | 21.9% |
| 2005 | 24.5% | 22.3% | 21.5% | 21.8% |
| 2006 | 24.5% | 22.5% | 21.5% | 21.6% |
| 2007 | 24.9% | 22.7% | 21.5% | 21.5% |
| 2008 | 25.1% | 23.1% | 21.6% | 21.4% |
| 2009 | 25.3% | 23.7% | 21.9% | 21.6% |
| 2010 | 25.3% | 24.8% | 22.5% | 22.2% |
| 2011 | 24.7% | 25.8% | 22.9% | 22.7% |
| 2012 | 24.3% | 26.6% | 23.1% | 22.9% |
| 2013 | 24.0% | 27.1% | 23.4% | 23.1% |
| 2014 | 23.8% | 27.7% | 23.8% | 23.5% |
| 2015 | 24.1% | 28.3% | 24.3% | 24.2% |
One factor in the increase in the share of PCT applications originating in Canada with at least one woman inventor is the increase in the average number of inventors per application in Canada over that time period. Research in the modern era is increasingly collaborative, as indicated in Figure 15. This effect may be even more pronounced in high-technology sectors. With more inventors listed on an average PCT application, it is more likely that one of them would be a woman. The increasing trend in inventors per PCT application levels off in 2002, around the same time that the shares of applications with at least one woman (Figure 15) levels off. Limited statistical analysis by CIPO suggests a possible contribution, but further study is needed.Footnote 5
| Average Number of Inventors per PCT Application | |
|---|---|
| 1995 | 2.17 |
| 1996 | 2.33 |
| 1997 | 2.26 |
| 1998 | 2.32 |
| 1999 | 2.38 |
| 2000 | 2.44 |
| 2001 | 2.55 |
| 2002 | 2.61 |
| 2003 | 2.67 |
| 2004 | 2.68 |
| 2005 | 2.63 |
| 2006 | 2.65 |
| 2007 | 2.66 |
| 2008 | 2.63 |
| 2009 | 2.66 |
| 2010 | 2.66 |
| 2011 | 2.68 |
| 2012 | 2.64 |
| 2013 | 2.74 |
| 2014 | 2.69 |
| 2015 | 2.67 |
| 2016 | 2.72 |
Another comparison between Canada and the G7 average is seen in Figure 16, which more specifically examines the share of PCT applications with a majority of women (here, we include cases with the same number of men and women inventors). Canada exceeds the G7 average on this measure.
| Year | Canada | G7 |
|---|---|---|
| 1997 | 7.8% | 7.9% |
| 1998 | 8.3% | 8.1% |
| 1999 | 9.4% | 8.3% |
| 2000 | 9.7% | 8.5% |
| 2001 | 10.6% | 8.8% |
| 2002 | 10.5% | 9.1% |
| 2003 | 10.9% | 9.2% |
| 2004 | 11.0% | 9.2% |
| 2005 | 11.5% | 9.0% |
| 2006 | 11.2% | 8.9% |
| 2007 | 11.7% | 8.9% |
| 2008 | 11.8% | 8.9% |
| 2009 | 12.1% | 9.0% |
| 2010 | 11.6% | 9.1% |
| 2011 | 11.2% | 9.2% |
| 2012 | 10.8% | 9.2% |
| 2013 | 10.5% | 9.2% |
| 2014 | 10.5% | 9.4% |
| 2015 | 10.6% | 9.7% |
In Figure 17, we consider the share of PCT applications with only women listed as inventors. Canada consistently exceeds the G7 on this metric. Canada more than doubles its share of women-only PCT applications between 1995 and 2007, but then stagnates.
| Year | Canada | G7 |
|---|---|---|
| 1997 | 2.3% | 2.3% |
| 1998 | 2.3% | 2.3% |
| 1999 | 2.6% | 2.3% |
| 2000 | 2.5% | 2.3% |
| 2001 | 3.0% | 2.4% |
| 2002 | 2.9% | 2.6% |
| 2003 | 3.0% | 2.6% |
| 2004 | 3.0% | 2.5% |
| 2005 | 3.1% | 2.4% |
| 2006 | 3.2% | 2.4% |
| 2007 | 3.5% | 2.5% |
| 2008 | 3.5% | 2.5% |
| 2009 | 3.5% | 2.5% |
| 2010 | 3.0% | 2.5% |
| 2011 | 2.9% | 2.5% |
| 2012 | 3.0% | 2.5% |
| 2013 | 3.3% | 2.5% |
| 2014 | 3.3% | 2.6% |
| 2015 | 3.3% | 2.6% |
The three different measures are summarized in Figure 18. All of these metrics are consistent in the message they deliver about the participation of women in patenting activity in Canada: improvement up until about 2005, and little or no improvement since then.
| Year | At Least One Woman | Majority Women | Women Only |
|---|---|---|---|
| 1997 | 17.6% | 7.8% | 2.3% |
| 1998 | 18.1% | 8.3% | 2.3% |
| 1999 | 19.5% | 9.4% | 2.6% |
| 2000 | 20.5% | 9.7% | 2.5% |
| 2001 | 22.9% | 10.6% | 3.0% |
| 2002 | 23.6% | 10.5% | 2.9% |
| 2003 | 24.2% | 10.9% | 3.0% |
| 2004 | 24.2% | 11.0% | 3.0% |
| 2005 | 24.5% | 11.5% | 3.1% |
| 2006 | 24.5% | 11.2% | 3.2% |
| 2007 | 24.9% | 11.7% | 3.5% |
| 2008 | 25.1% | 11.8% | 3.5% |
| 2009 | 25.3% | 12.1% | 3.5% |
| 2010 | 25.3% | 11.6% | 3.0% |
| 2011 | 24.7% | 11.2% | 2.9% |
| 2012 | 24.3% | 10.8% | 3.0% |
| 2013 | 24.0% | 10.5% | 3.3% |
| 2014 | 23.8% | 10.5% | 3.3% |
| 2015 | 24.1% | 10.6% | 3.3% |
| 2016 | 24.4% | 10.8% | 3.2% |
Comparative Analysis
We can compare the trend lines in women's participation in the PCT filing system to women's STEM participation. The share of women aged 25 to 64 in the Canadian workforce in scientific occupations requiring a university degree rose from 18.1% in 1991 to 22.2% in 2001 and 22.7% in 2011. In 2001, the share of women inventors was 13.0%, and in 2011, it was 12.3%. This is well below women's share of the scientific workforce in Canada.Footnote 6 Table 1 shows the most recently available data on women in STEM fields in Canada. The data suggests that underrepresentation is not just a pipeline problem and is not isolated to particular sectors, but is also the result of factors that impact the careers of women after they enter those fields.
| 1991 | 2001 | 2011 | |
|---|---|---|---|
| All scientific occupations | 18.1 | 22.2 | 22.7 |
| Physical sciences | 18.1 | 27.4 | 31.0 |
| Life sciences | 23.2 | 32.7 | 42.5 |
| Civil, mechanical, electrical and chemical engineering | 5.5 | 9.1 | 13.0 |
| Other engineering | 8.0 | 12.8 | 14.1 |
| Architecture, urban planning and land surveying | 16.9 | 20.3 | 28.0 |
| Mathematics, statistics and actuarial science | 38.4 | 40.6 | 49.6 |
| Computer science | 29.7 | 28.5 | 24.7 |
Source: Statistics CanadaFootnote 7
Possible causes for the 2001-era change in the trend would include a cohort effect, with the changes in women's STEM participation of the relevant generation levelling off. This seems unlikely, as STEM participation continued to grow after 2001. It may be the case that women are entering these fields and progressing in them, creating the appearance of momentum, but that the underlying trends are stalled. Another possibility is a changing industry mix, with the Canadian economy becoming increasingly composed of sectors that are dominated by men.
The findings in this report are consistent with other data on IP use by Canadian small businesses. In 2011, the Small Business Branch of Industry Canada (now Innovation, Science and Economic Development Canada) conducted a survey of small and medium-sized enterprises (SMEs) in Canada. The survey examined many questions, including the level of ownership by women and the use of intellectual property (IP), including patents.
Comparing firms that were 100% male-owned to those that were 100% female-owned provides a useful way to consider gender differences in the use of patents and IP. Wholly male-owned firms were nine times more likely to hold patents (1.9% vs. 0.2%) and more likely to hold at least one type of intellectual property (15.5% vs. 11.1%). However, if we compare SMEs that have majority male and majority female ownership (and excluding cases of only male and only female ownership, as those firms may have disproportionately smaller numbers of employees), we see similar levels of patent use (2.4% vs. 2.5%).
Furthermore, the 2014 SME survey found that only 10.9% of firms that hold IP are 100% female-owned, compared to 14.3% of firms that hold no IP being 100% female-owned. This suggests that female-owned firms are disproportionately among those with no IP. Given the usefulness of IP in facilitating financing and growth for SMEs, understanding the differences in women's participation in patenting contributes to our understanding of patterns in entrepreneurship.
Understanding Structural Factors

Female scientist, bent over and observing samples in a Petri dish through the lens of a microscope.
Photo credit: University of Ottawa
There are many different theories about divergent outcomes in the career paths of men and women, some of which may be applicable to the use of the PCT filings system by women. The WIPO working paper Identifying the gender of PCT inventors (2016)Footnote 8 provides a review of key studies on gender differences in patenting and scientific publications. Opportunities to participate in collaborative research teams are extremely important to the careers of scientists and engineers. Decisions about whom to include in research teams are affected by preconceived notions or stereotypes regarding gender, as well as a gap in the sponsoring and mentoring rates between men and women (lower for women). They may also be affected by the differing rates of self-nomination and self-promotion between men and women, and a greater willingness by men to request that their names be added as co‑inventors on patent applications.
Furthermore, women may face other forms of gender discrimination. Barriers that make shifting between family and research roles difficult mean that women are incapable of or excluded from engaging in longer-term commitments that can lead to inventions for which PCT applications are likely to be filed.
Many patenting opportunities and research projects may be filled by an informal network rather than formal interviews or competitions. These self-perpetuating social hierarchies can entrench gender discrimination practices. Women may simply be excluded, not due to lack of education or merit, but due to the artefacts of established networks. It should also be considered that business and academia have different organizational structures. It is possible that businesses give less consideration to the goal of gender diversity in research teams, so that women make up a higher share of academic research positions than business research positions. Further research would be required to verify this.
Canada is the most educated country in the world, as measured by the share of adults with a tertiary qualification.Footnote 9 However, this education is heavily weighted in vocational and college-based attainment, rather than university degrees; Canada tied for 7th in the world in 2014 for share of the population with a bachelor's or more advanced degree.Footnote 10 It is possible that Canada's educational advantages are not channelled into the higher education paths that make high-level research more likely. However, postsecondary enrollment data shows that in 2014–15, enrollment for women was 57% at both the bachelor's and master's level, and 48% at the PhD level.Footnote 11 Despite this, the results identified in this report strongly suggest that the gender gap in PCT application is not simply a pipeline problem, but something more structural and systemic.
Conclusion
The present report contributes to our understanding of the progress made by Canadian women in STEM fields. Women's participation is a vital metric for a 21st century economy. In a competitive global marketplace, Canada cannot afford to deny opportunities to talented people of both genders. Systemic barriers to invention, creation and innovation by women make our economy less effective and less equitable.
Gender participation in STEM fields is an extremely important goal, but a more holistic measure of the field is necessary. Increasing the share of women graduating with STEM degrees is very helpful but does not necessarily reduce the barriers faced by women already working in those fields.
Furthermore, as the analysis here has shown, Canada's share of participation by women in PCT applications cannot be explained simply by pointing to the low share of women in STEM jobs, as the inventor share is below that share. And it cannot be explained by technological concentrations differences, as that explains less than 10% of the overall gap.
Nonetheless, there are bright points. Studying fields and time periods in which progress can be made illuminates the way forward. In particular, Canada can work to understand the differences in gender participation between technology areas and work with businesses and other levels of government to understand which problems are reducing our share of women inventors.
Future work could include the use of the gender name dictionary in other areas of intellectual property (IP), such as IP agents and CIPO's domestic patent database, as well as trademarks and industrial designs. WIPO is considering additional gender-based analysis work related to the Madrid Agreement Concerning the International Registration of Marks and the Hague Agreement Concerning the International Registration of Industrial Designs, which govern international filing systems analogous to the PCT, and which would provide additional areas to analyze women's participation rates in seeking IP protection internationally.
Bibliography
- http://www.oecd.org/canada/eag2014ca.htm
- http://www.ipwatchdog.com/2016/08/01/patent-gender-gap/id=71537/
- WIPO Economic Research Working Paper No. 33, Identifying the gender of PCT inventors
- OECD Education at a Glance Report 2016
- http://www.statcan.gc.ca/pub/75-006-x/2016001/article/14643-eng.htm