
This publication is available online at https://www.ic.gc.ca/eic/site/106.nsf/eng/h_00044.html.
To obtain a copy of this publication, or to receive it in an alternate format (Braille, large print, etc.), please fill out
the Publication Request Form at www.ic.gc.ca/Publication-Request or contact:
Web Services Centre
Innovation, Science and Economic Development Canada
C.D. Howe Building
235 Queen Street
Ottawa, ON K1A 0H5
Canada
Telephone (toll-free in Canada): 1-800-328-6189
Telephone (international): 613-954-5031
TTY (for hearing impaired): 1-866-694-8389
Business hours: 8:30 a.m. to 5:00 p.m. (Eastern Time)
Email: ISED@canada.ca
Permission to Reproduce
Except as otherwise specifically noted, the information in this publication may be reproduced, in part or in whole and by any means, without charge or further permission from the Department of Industry, provided that due diligence is exercised in ensuring the accuracy of the information reproduced; that the Department of Industry is identified as the source institution; and that the reproduction is not represented as an official version of the information reproduced or as having been made in affiliation with, or with the endorsement of, the Department of Industry.
For permission to reproduce the information in this publication for commercial purposes, please fill out the Application for Crown Copyright Clearance at www.ic.gc.ca/copyright-request or contact the Web Services Centre mentioned above.
© Her Majesty the Queen in Right of Canada, as represented by the Minister of Industry, 2019.
Aussi offert en français sous le titre Profil des PME : Financement et croissance des coopératives au Canada, 2017.
Written by: Adrian Egbers, Lucas Rivet-Crothers and Lyming Huang
PDF version
Summary
This report summarizes findings from the 2017 Survey on Financing and Growth of Small and Medium-sized Enterprises to offer a snapshot of the financing and growth activities of co-operatives corporationsFootnote 1 in Canada.
In Canada, there is a well established co-operativeFootnote 2 business sector, yet there has been little data to help understand the financing, growth, procurement, innovation and exports of co-operatives, as well as the obstacles they face. The 2017 Survey on Financing and Growth of Small and Medium-sized Enterprises is an effort by Innovation, Science and Economic Development Canada to provide more concrete data and analysis on co-operatives, and this profile highlights key data points to better understand how they operate in and contribute to the Canadian economy.Footnote 3
As outlined in this profile, the survey data returned some interesting financing and growth trends of the co-operative sector in Canada. For instance, the co-operatives that responded to the survey demonstrated this business sector seeks more external financing than SMEs and generally have higher financing approval rates. Debt financing is the most prevalent form of capital that co-operatives are seeking, mostly in the form of term loans used for working capital.
Co-operatives have high growth projections, including intentions to expand to new markets, over the next three years and are more likely than SMEs to develop a new innovation. Co-operatives also have diverse ownership, with a strong percentage of the businesses owned by women and Indigenous Peoples, and are very mature with an average business age of 43.7 years.
The following sections of this profile provides more details of how co-operatives are accessing financing, growing and innovating across Canada.
Financing
More co-operatives request external financing than SMEs

In 2017, 64.4% of co-operatives that received debt financing received it from credit unions and caisses populaires, 27.3% from domestic chartered banks, and 20.2% from a government institution.Footnote 4 By comparison, 69.9% of the SMEs that made a request for external financing received financing from domestic chartered banks, 8.7% from government, and 23.6% from credit unions.

Both co-operatives and SMEs primarily rely on debt financing and trade credit

Figure 1: Financing type
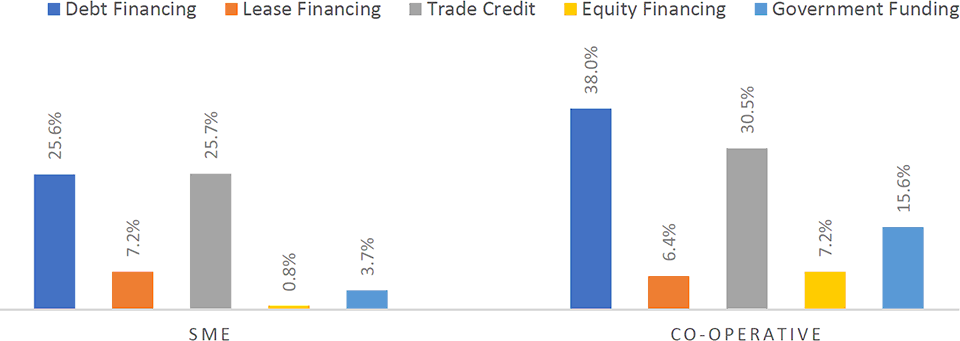
In 2017, co-operatives secured over $262 million in debt financing. Co-operatives were getting the largest amount of debt financing from term loans ($118.6 million), followed by lines of credit ($87.7 million). The majority (55.8%) of co-operatives' intended use of this debt financing was for working capital.
Growth and Innovation
Co-operatives expect to grow and expand sales


Figure 2: Intention to expand by destination

Co-operatives are drivers in innovation

Co-operatives are also more likely to adopt a new technology than traditional SMEs. Fifty-three percent of co-operatives adopted at least one new technology over the last three years compared to 46.3% of SMEs. Data analytics (29.3%) and cloud computing (25.4%) were the technologies that co-operatives were most likely to adopt.
Co-operatives face some obstacles to growth

In contrast, over 40% of co-operatives indicated that shortage of labour (46.0%), maintaining cash flow (40.8%), and the corporate tax rate (48.1%) were not obstacles to growth; 50.6% indicated that government regulations were not an obstacle to growth; and, 63.3% indicated that obtaining financing was not an obstacle to growth.
Business Characteristics
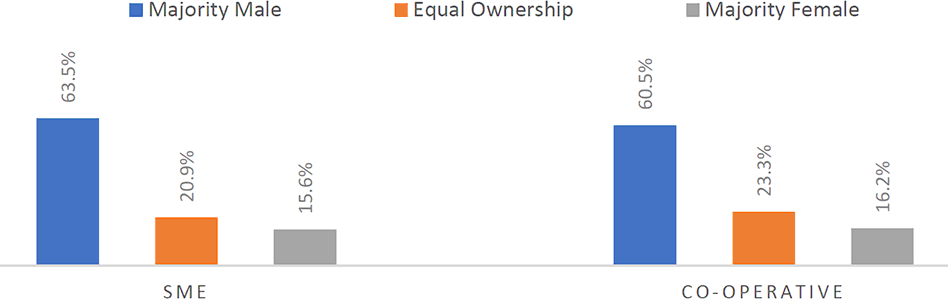
Co-operatives are diverse businesses with strong female, aboriginal, and francophone presence

Figure 3: Ownership base

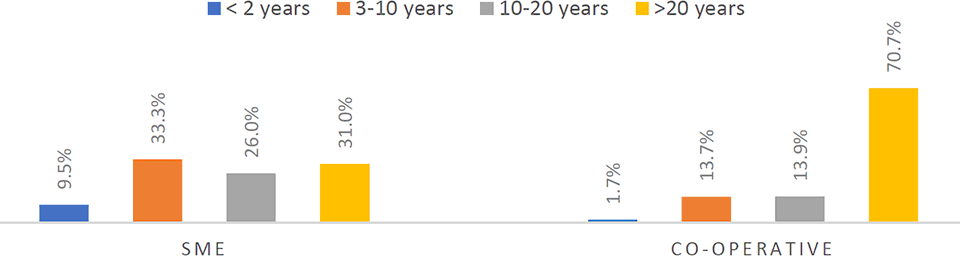
Co-operatives tend to be more mature businesses, but fewer are created

Co-operatives may well remain anchored in the Canadian landscape as 91% of the co-operatives surveyed indicated they had no intention to sell, transfer, or close their business in the next five years, as opposed to 70.7% of SMEs that have no intention to sell, transfer or close.
However, the survey also shows fewer co-operatives were created than SMEs. As little as 1.7% of the co-operatives surveyed had been in business for under 2 years, compared to 9.5% for SMEs. In addition, only 26.6% of co-operatives were between 3 and 20 years old, when nearly 60.0% of all SMEs were in that age tranche.
Figure 4: Business Age
Data & Methodology
The data in this profile is collected from the 2017 Survey on the Financing and Growth of Small and Medium-sized Enterprises. The survey focused on SMEs that generated over $30,000 in annual gross revenue and that employed between 1 and 499 employees and a special sample frame of co-operatives were included. The total sample frame was 617 co-operatives, of which 399 responded to the questionnaire, resulting in a 78% response rate compared to a 59% response rate for all SMEs. For more information on the survey questionnaire and methodology, please click here.
A co-operative must be incorporated under specific provincial, territorial or federal co-operative corporate Acts. Co-operatives have many similarities and differences to regular corporations. In order to better understand these differences, please visit the how is a co-operative different from other business forms as well as the Information Guide on Co-operatives.
Please note, co-operatives were also included in the 2014 Survey on the Financing and Growth of Small and Medium-Sized Enterprises. You can see a see a complete 2014 profile here.