


Table Of Contents
- The Report Context
- Economic Impact
- Regional Industrial Strengths
- Obligation Progress Report
- Industrial Activity Commitments
- Scaling-Up Small- and Medium-Sized Businesses (SMBs)
- Academic & Research Organisations R&D and Skills
- Gender and Diversity Plans
- Key Findings
- Annex A – ITB Policy Objectives and Related Metrics
- Annex B – Economic Impact Methodology Principles
- Annex C – ITB Portfolio
- Annex D – Breakdown of ITB Portfolio and its Identified Industrial Activities by Type of Contract
- Annex E – ITB Commitments Related to Key Industrial Capabilities (KICs)
- Data Sources
The Report Context
The Industrial and Technological Benefits (ITB) Policy contractually requires companies awarded defence and security procurement contracts to undertake industrial activity in Canada equal to the value of the contracts they have won.
The ITB PolicyFootnote1:
- Supports long-term growth and sustainability of Canada’s defence industry
- Supports the growth of prime contractors and suppliers in Canada, including small- and medium-sized businesses (SMBs)Footnote 2 in all regions of the country
- Enhances innovation through research and development (R&D) in Canada
- Increases the export potential and international competitiveness of Canadian-based firms
- Fills skills and training gaps within the Canadian economy to support a more innovative Canada
Innovation, Science and Economic Development Canada ( ISED ) publishes two reports each year in an effort to be transparent about the results and status of the ITB Policy
Economic Impact
The ITB Policy is estimated to contribute over $5.0B to GDP and over 40,400 jobs annually in CanadaFootnote3
Figure 1: GDP Economic Impact

A donut chart showing the five-year annual average GDP impact of the ITB Policy, broken down by ITB recipients, Canadian suppliers to ITB recipients, and consumer spending by associated employees.
Figure 2: Employment Economic Impact
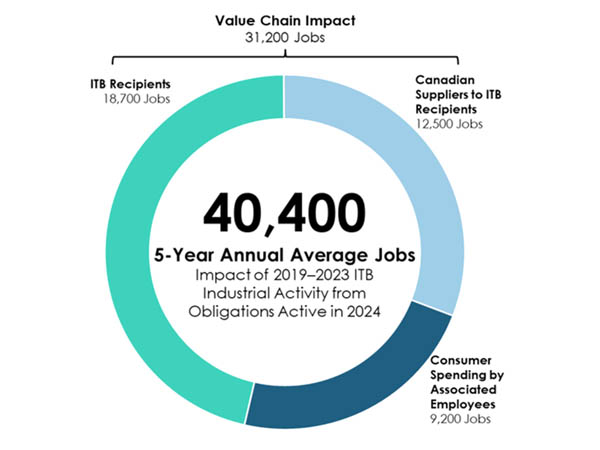
A donut chart showing the five-year annual average employment impact of the ITB Policy, broken down by ITB recipients, Canadian suppliers to ITB recipients, and consumer spending by associated employees.
Regional Industrial Strengths
ITB industrial activityFootnote4 aligns closely with regional industrial strengths
Figure 3: BreakdownFootnote5 of ITB Business Activity in Canada by IndustryFootnote6

Five charts showing the breakdown of ITB industrial activity in Canada by industry. One donut chart shows the national perspective, and four bar charts demonstrate the regional perspectives: Western and Northern Canada, Ontario, Quebec, and Atlantic Canada. The charts are segmented by the following industries: aerospace, marine, information technology (IT), land, space, and other industries.
Obligation Progress Report
Close to $84B in economic obligations resulting from 117 contracts active in 2024Footnote7
Figure 4: Economic Activity from ITB Obligations

A bar chart showing the growth of the ITB portfolio's economic activity from ITB obligations active in 2020 to 2024.
- 95% increase in economic obligations resulting from active contracts in the past 5 years
ITB obligationsFootnote9 have an average achievement period of over 15 years with close to 90% of industrial activities being identified within the first 5 years
Figure 5: Economic Activity from ITB Obligations

Two charts showing the economic activity from ITB obligations. A donut chart showing the economic activity from ITB obligations, broken down by completed, in progress, and to be identified. A bar chart showing ITB obligations' share of to be identified values by contract timeline: initial 5 years, years 1 to 5 and after 5 years.
Industrial Activities Commitments
The ITB Policy stimulates industrial activities across the broader Canadian defence and security ecosystem
ITB Industrial Activities Across the Broader Canadian Defence and Security Ecosystem

Close to 50% of the value of ITB obligations is committed to domestic production directly on defence and security procurementsFootnote 11
- Over 95% of indirect ITB activity supports the broader Canadian defence and security ecosystem which includes aerospace, land, IT, marine and space industrial activities

Close to $11.6B in Canadian supplier development commitments

Close to $6.2B in R&D commitments

International export strategies on 24 procurements

More than $300M in skills development and training commitments
Scaling-Up Small- and Medium-Sized Businesses (SMBs)
More than 710 Canadian organisations, of which over 60% are SMBs, are recipients of activities from ITB obligations active in 2024
Figure 6: Breakdown of ITB Recipients by TypeFootnote 12 and SMB ActivityFootnote 13 Volume by TypeFootnote 14

Two charts showing the breakdown of ITB recipients and SMB activity. A bar chart shows the breakdown of ITB recipients by type, segmented by large firms, academic and research organisations, and small and medium businesses (SMBs). A donut chart shows the breakdown of SMB activity volume by type, segmented by direct work on procurement, global supply chain participation, investment, collaborative innovation, and skills development and training.
- The vast majority of ITB SMB activity is focused on scaling up through supplier development via direct work on procurement and global supply chain participation
Academic & Research Organisations R&D and Skills
More than 55 Canadian academic and research organisations are recipients of activities from ITB obligations active in 2024
Examples of Academic and Research Organisation Activities

A table showing examples of academic and research organisation activities, broken down by skills development and technology areas.
Gender and Diversity Plans
There are 46 ITB obligations active in 2024 with Gender and Diversity plans
- Introduced in May 2018 as a mandatory component in the ITB Value Proposition, the Gender and Diversity Plan requires bidders to describe, at the prime contractor level, their approach to achieving gender balance and increasing diversity within their Canadian corporate structures and broader supply chains in Canada
The Gender and Diversity Plan may include, but is not limited to, the following:
- The bidder’s public approach to promoting diversity, inclusion and equality
- The bidder’s corporate anti-discrimination policies
- Training available to educate the bidder’s workforce on diversity and inclusion
- Available statistics on the proportion of designated groups employed at all levels of the bidder’s firm in Canada
- How diversity and inclusion is factored into the bidder’s supplier selection methods in Canada
- Other corporate activities that seek to increase or support diversity in Canada
Key Findings
In conclusion, the ITB Policy:
- Contributes over $5.0B to GDP and over 40,400 jobs annually in Canada
- Is market-driven and aligns closely with regional industrial strengths
- Realized a 95% increase in economic obligations from active contracts in the past 5 years
- ITB obligations have an average achievement period of over 15 years with close to 90% of industrial activities being identified within the first 5 years
- Stimulates industrial activities across the broader Canadian defence and security ecosystem, in supplier development, in R&D, in exports, and in skills development and training
- Close 50% of the value of ITB obligations is committed to domestic production directly on defence and security procurements
- Benefits over 710 Canadian organisations, including close to 440 SMBs and over 55 Canadian academic and research organisations
- Promotes gender equality, diversity, and inclusion in Canada’s defence industry
Annex A - ITB Policy Objectives And Related Metrics
| ITB Policy Objective | Related Metric | Reference Slide |
|---|---|---|
| Supports the long-term growth and sustainability of Canada’s defence industry |
|
Slide 8 |
| Supports the growth of prime contractors and suppliers in Canada, including SMBs in all regions of the country |
|
Slide 5 / Slide 9 |
| Enhances innovation through R&D in Canada | Volume (in dollars) of R&D commitments from defence and security procurementsFootnote 17 to which the ITB Policy applies | Slide 8 |
| Increases the export potential and international competitiveness of Canadian-based firms | Number of defence and security procurementsFootnote 18 with International Export Strategies | Slide 8 |
| Fills skills and training gaps within the Canadian economy to support a more innovative Canada | Volume (in dollars) of Skills Development and Training commitments from defence and security procurementsFootnote 19 to which the ITB Policy applies | Slide 8 |
Annex B - Economic Impact Methodology Principles
- ISED’s methodology is informed by subject matter experts from the Organisation for Economic Co-Operation and Development (OECD) and Statistics Canada.
- Foundation data is based on ITB credits and commitments of ITB obligations active in 2024, over the 2019–2035 period, as specified on each slide.
- All analyses are based on 2019–2023 credits and 2024–2035 commitments of ITB obligations active in 2024.
- Annual average economic impact analysis is based on ITB transactions credited over the 2019–2023 period, with adjustments reflecting the ITB Policy’s credit multipliers and intangible industrial activities. This five-year period reflects the timeframe required to better capture industrial activity under the ITB Policy, notably Banking Transactions that are mostly credited prior to contract award.
- ISED’s model measures Canada’s economic structure through Statistics Canada’s 2021 Input-Output (I/O) economic impact multipliers.
- I/O multipliers have been adjusted to reflect the ITB Canadian content requirement (only Canadian Content Value is counted under ITB).
- Total economic impact of the ITB Policy includes the activities that occur within ITB recipients (direct economic impact from enterprises that benefit from the ITB Policy), their Canadian suppliers (indirect economic activity from ITB recipients’ value chain partners), as well as consumer spending by associated employees (induced economic activity) across the Canadian economy.
- GDP impact is reported on an annual average basis.
- Jobs impact is reported on an annual average basis and is measured in terms of full-time equivalent (FTE) employment.
- Jobs cannot be additive as they are maintained for an extended period after creation.
- Economic impact estimates are reported at the national level and cannot be broken down at the regional level.
- Inflation adjustment:
- Statistics Canada’s I/O multipliers are in 2021 dollars; accordingly, all dollars are adjusted to 2021 using ISED estimates, derived from Statistics Canada’s Gross Domestic Product (GDP) Price Index.
- All totals are in Canadian dollars. Foreign currency amounts were converted to Canadian dollars using the Bank of Canada’s annual exchange rate for 2024.
Annex C – ITB Portfolio
Breakdown of ITB PortfolioFootnote 20
(from ITB Obligations Active in 2024)
| Obligation | Completed | In Progress | To be Identified | |
|---|---|---|---|---|
| ITB Obligations Active in 2024 | $83.8B | $40.1B | $20.3B | $23.4B |
Average ITB Achievement Period by Type of Contract
(from ITB Obligations Active in 2024)
| All Obligations | Acquisition Obligations | ISS: Platform Sustainment Obligations | ISS: Simulation & Training Obligations | |
|---|---|---|---|---|
| Average ITB Achievement Period | 16 | 15 | 16 | 25 |
Annex D – Breakdown of ITB Portfolio and its Identified Industrial Activities by Type of Contract
Breakdown of ITB PortfolioFootnote 21 by Type of Contract
(Shown as Percent of Total Obligation Amount)
| Type of Contract | Obligation | Completed | In Progress | To be Identified |
|---|---|---|---|---|
| Acquisition | 100% | 49% | 23% | 28% |
| ISS: Platform Sustainment | 100% | 64% | 13% | 23% |
| ISS: Simulation & Training | 100% | 6% | 54% | 40% |
| All | 100% | 48% | 24% | 28% |
Breakdown of ITB Portfolio To be Identified Industrial Activities by Type of Contract
(Shown as Percent of Total Obligation Amount)
| Type of Contract | All Active ITB Obligations | Initial Year | Years 1-5 | After 5 Years |
|---|---|---|---|---|
| Acquisition | 28% | 53% | 41% | 11% |
| ISS: Platform Sustainment | 23% | 84% | 37% | 13% |
| ISS: Simulation & Training | 40% | 44% | 0% | 4% |
| All | 28% | 53% | 40% | 12% |
Annex E – ITB Commitments Related to Key Industrial Capabilities (KICs)
| Value Proposition Pillar | Number of Commitments Related to KICs |
|---|---|
| Direct Work on ProcurementFootnote 22 | 62 |
| Canadian Supplier Development | 25 |
| Research and Development in Canada | 37 |
| Skills Development & Training | 22 |
Data Sources
- Economic Impact
- ISED economic model estimates based on ITB administrative data (2019–2023 credits from ITB obligations active in 2024) and Statistics Canada’s 2021 Input-Output multipliers, 2025
- Regional Industrial Strengths
- ITB administrative data (2019–2023 credits and 2024–2035 commitments from ITB obligations active in 2024), 2025
- Obligation Progress Report
- ITB administrative data (ITB obligations active in 2024), 2025
- Industrial Activity Commitments
- ITB administrative data (ITB obligations awarded after 2014 and active in 2024), 2025.
- Scaling -Up Small- and Medium-Sized Businesses (SMBs)
- See 2(a)
- Academic & Research Organisations R&D and Skills
- See 2(a)
- Gender and Diversity Plans
- See 3(a)
- Annex C – ITB Portfolio
- See 3(a)
- Annex D – Breakdown of ITB Portfolio and its Identified Industrial Activities by Type of Contract
- See 3(a)
- Annex E – ITB Commitments Related to KICs
- See 4(a)