
Open data version (Excel)
The OSB is part of Innovation, Science and Economic Development Canada. We carry out our regulatory, administrative, and supervisory duties at arm's length from the Government of Canada.
The OSB is responsible for administration of the Bankruptcy and Insolvency Act (BIA), as well as certain duties under the Companies' Creditors Arrangement Act (CCAA). We license and regulate the insolvency profession, ensure an efficient and effective regulatory framework, supervise stakeholder compliance with the insolvency process, and maintain public records and statistics.
As part of the government’s commitment to openness, accountability, and public engagement, the OSB has developed the Canadian Consumer Debtor Profile report, which contains consumer insolvency statistics. Please note that all percentages are rounded to the nearest whole percent.
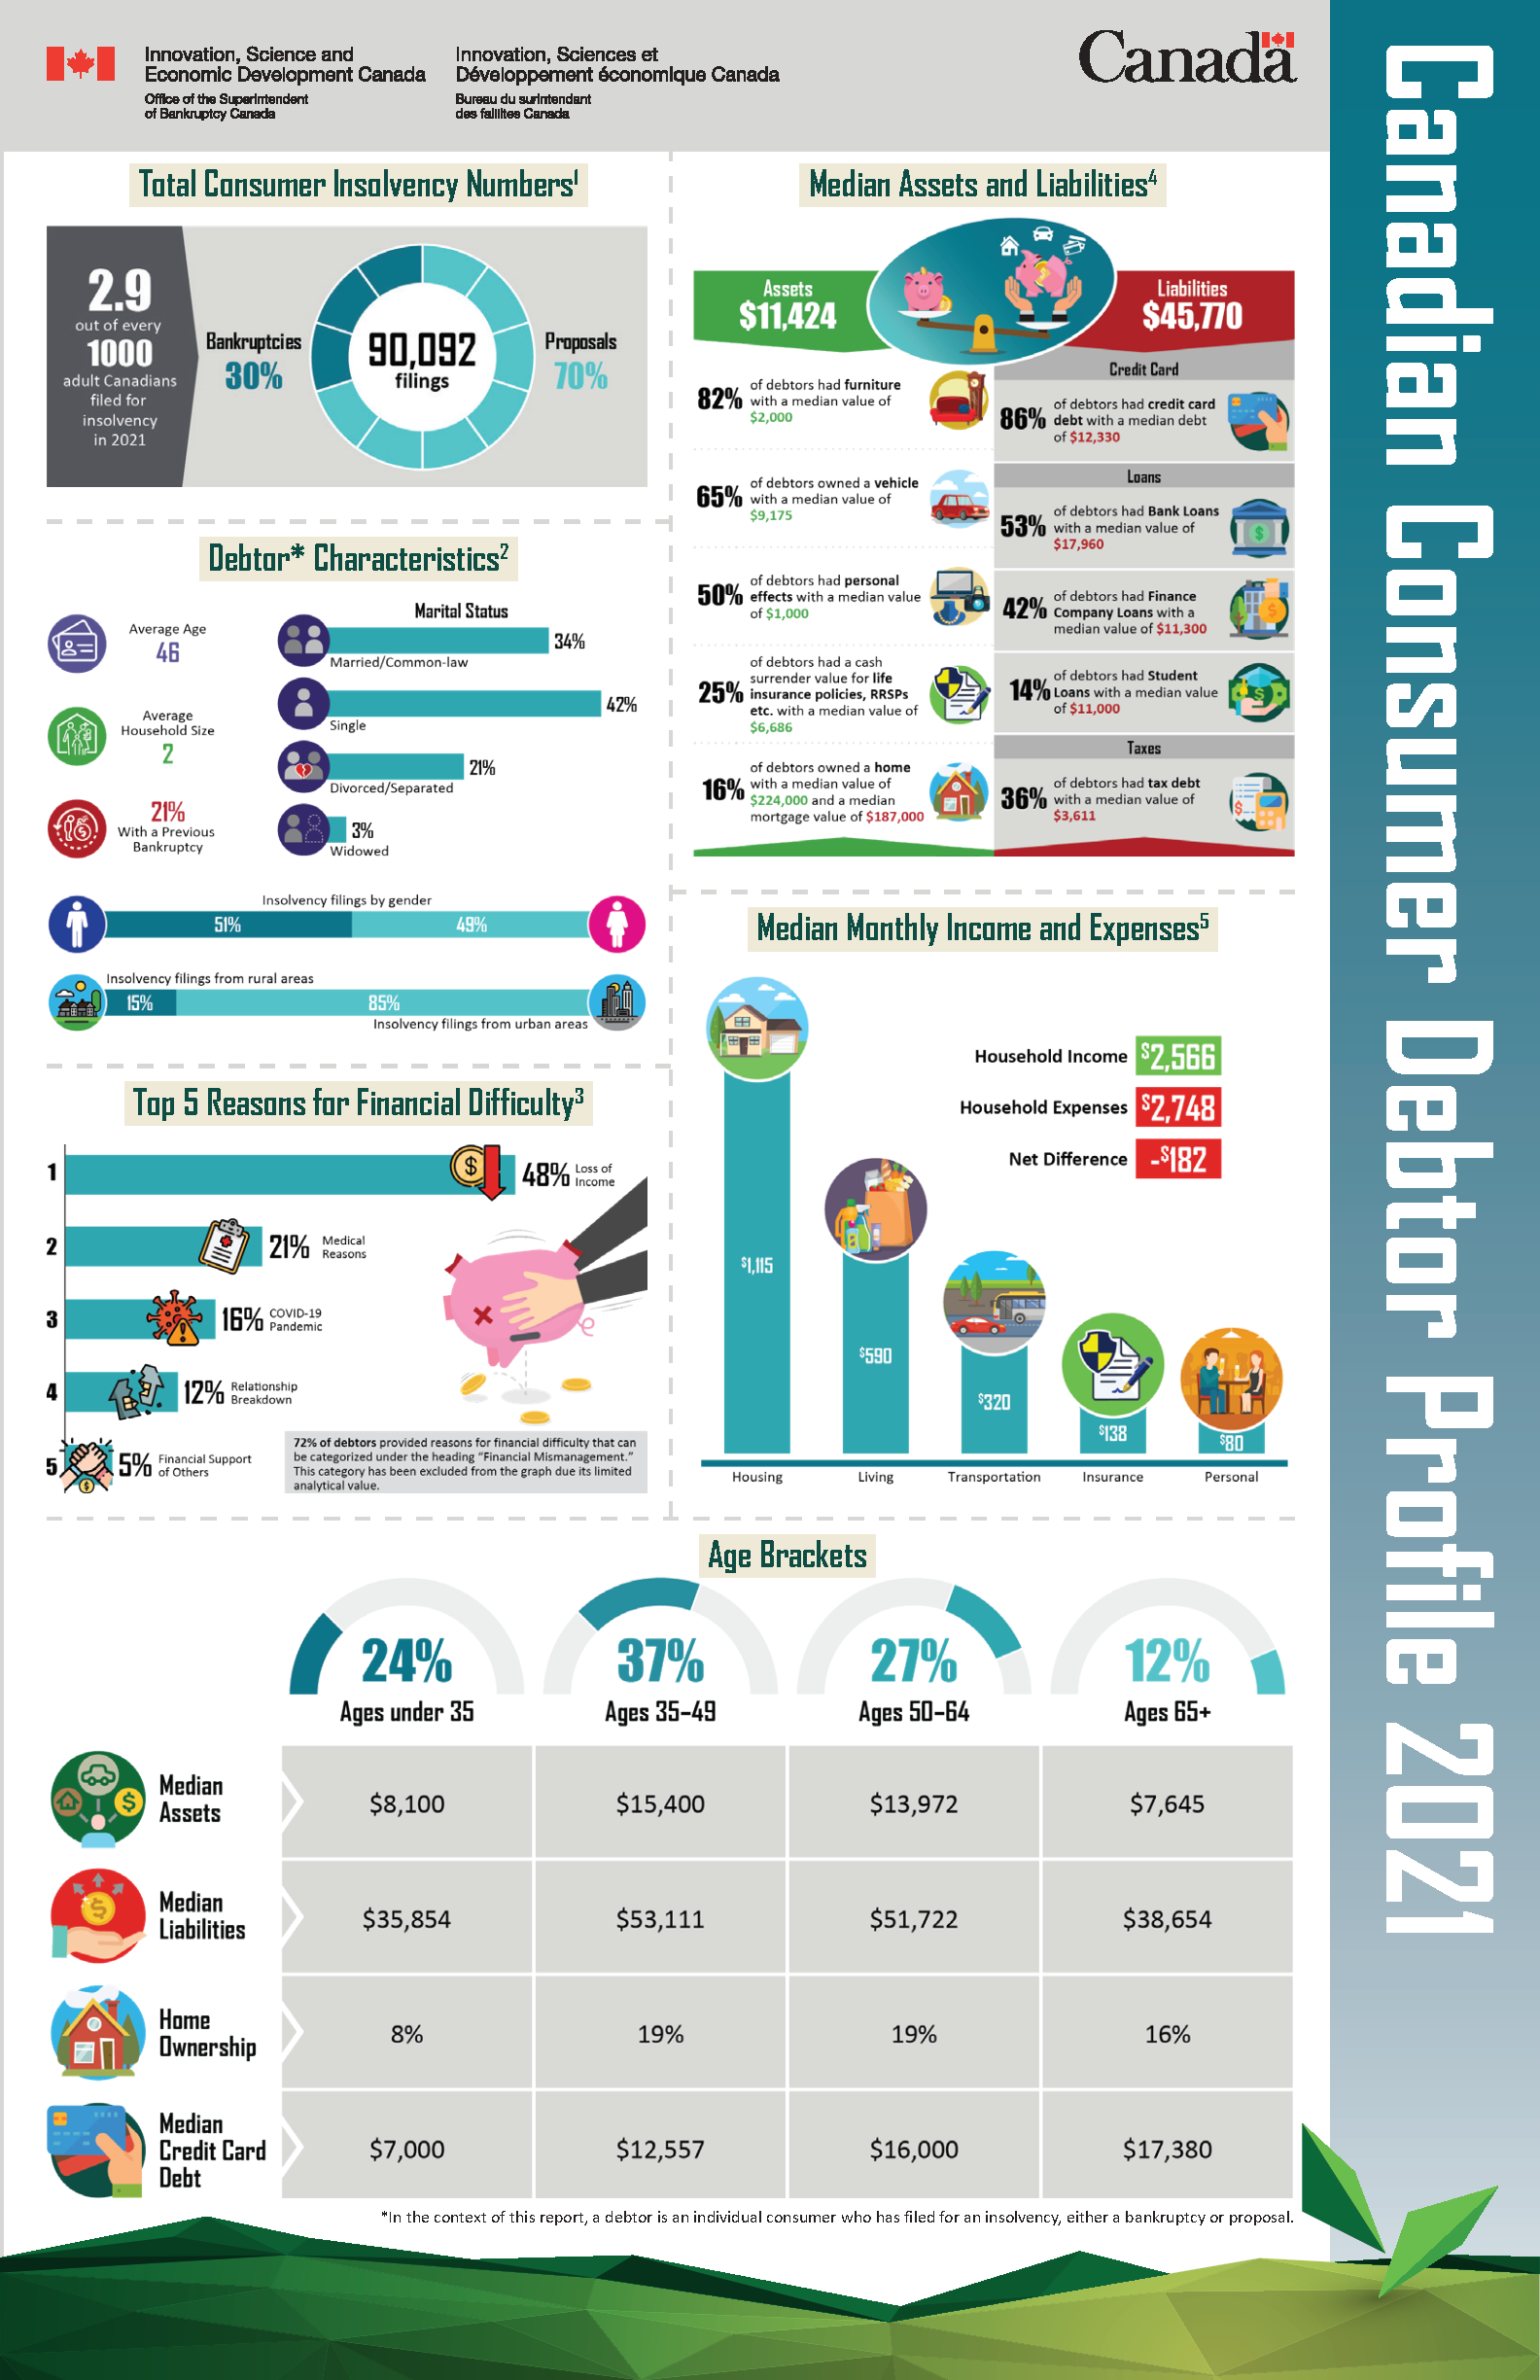
In 2021, there were 90,092 consumer insolvency filings, down from 137,178 in 2019. Proposals made up 70% of total consumer insolvencies and 30% were bankruptcies. In comparison, 60% of insolvencies were proposals and 40% were bankruptcies in 2019. Out of every thousand adult Canadians, 2.9 filed for insolvency, the lowest rate since 1994.
Canadian Consumer Debtor Profile 2021 infographic
Canadian Consumer Debtor Profile 2021 infographic (PDF version, 443 KB)
Debtor characteristics
In the context of this report, a debtor is an individual consumer who has filed for an insolvency, either a bankruptcy or proposal. The ratio between Male and Female debtors in 2019 was 53% to 47%. In 2021 it changed to 51% to 49%, closer to the ratio in the general population of approximately 50-50.Footnote1 The marital status of debtors was divided into four categories:
- Married/Common law - 34%
- Single - 42%
- Divorced/Separated - 21%
- Widowed - 3%
In contrast, the marital status for the general population was 59% married or common law, 26% single, 9% divorced or separated and 6% widowed.Footnote2 The average debtor was 46 years old with a household size of 2 people. In 2021, 21% of debtors had previously filed for bankruptcy; of these repeat debtors, 86% had filed only one previous bankruptcy. Only 15% of debtors lived in rural areas while 85% lived in urban areas, which is similar to the distribution of the general population.Footnote3
Income and expenses
In 2021, debtors’ median monthly household income was $2,566, while median household expenses were $2,748, leading to a monthly net deficit of $182. In comparison to the latest Statistics Canada data available, as of 2019, the median monthly household income for the general population was $5,933.Footnote4 The median monthly debtor expenses for common categories are as follows: Housing - $1,115, Living - $590, Transportation - $320, Insurance $138, Personal - $80.
Assets and liabilities
The median total assets for debtors in 2021 were $11,424 and the median total liabilities were $45,770, for a net difference of $34,346. In contrast to the latest Statistics Canada data available, as of 2019, the median household assets for the general population were $477,000 and the median debts were $79,000, for a median net worth of $329,900.Footnote5
Only 16% of debtors owned a home, down from 21% in 2019. These homes had a median value of $224,000 and a median mortgage value of $187,000. Among debtors, 65% owned a vehicle with a median value of $9,175. The most frequent liability category was credit card debt. Among debtors, 86% had credit card debt with a median debt of $12,330. Loans were another frequent liability and are divided into four categories: bank loans, finance company loans, student loans, and loans from individuals. Of these, bank loans were the most frequent, with 53% of debtors having bank loans with a median debt of $17,960. The second most frequent were finance company loans, with 42% of debtors and a median debt of $11,300. Third were student loans, with 14% of debtors and a median debt of $11,000. The least frequent were loans from individuals, with just 3% of debtors and a median debt of $1,854. Another frequently identified liability was taxes, with 36% of debtors owing taxes with a median debt of $3,611.
Reasons for financial difficulty
The top five debtoridentified reasons for financial difficulty in 2021 were: Loss of Income – 48%, Medical Reasons – 21%, COVID-19 Pandemic – 16%, Relationship Breakdown – 12%, and Financial Support of Others – 5%.
- Loss of Income: 48%
- Medical Reasons: 21%
- COVID-19 Pandemic: 16%
- Relationship Breakdown: 12%
- Financial Support of Others: 5%
Loss of income was cited as a reason for financial difficulty 11% more than in 2019. In 2020, the OSB identified the COVID-19 Pandemic as a new reason for financial difficulty as reported by debtors.Footnote6
Age brackets
The debtor population has notably different characteristics when stratified into age brackets. For this report, we divided the population into four age brackets and compared them on the following characteristics:
<35 | 35-49 | 50-64 | 65+ | |
|---|---|---|---|---|
Median Assets | $8,100 | $15,400 | $13,972 | $7,645 |
Median Liabilities | $35,854 | $53,111 | $51,722 | $38,654 |
Median Credit Card Debt | $7,000 | $12,557 | $16,000 | $17,380 |
Home Ownership | 8% | 19% | 19% | 16% |
Appendix
Methodology
The data in this report was obtained from statutory forms submitted to the Office of the Superintendent of Bankruptcy (OSB), which are stored in the OSB’s dynamic transactional database. Except for the first section on Total Consumer Insolvency Numbers, this report includes only primary estates filed in 2021 with 50% or more of their debts classified as consumers. Additionally, a valid Form 65, Monthly Income and Expense Statement of the Bankrupt/Debtor and the Family Unit and Information (or Amended Information) Concerning the Financial Situation of the Individual Bankrupt and Form 79, Statement of Affairs (Non-Business Bankruptcy/Proposal) on file was required.
Notes
- Total Consumer Insolvency Numbers
Insolvency Definitions- Insolvency: The inability of a debtor to pay off debt as it becomes due.
- Bankruptcy: Governed by the Bankruptcy and Insolvency Act, bankruptcy is a formal process whereby debtors who cannot meet their obligations sign over all of their assets—except those exempt by law—to a Licensed Insolvency Trustee (LIT). The LIT’s role includes selling off those assets to satisfy outstanding debts. Once debtors are formally declared bankrupt, lawsuits by creditors are stayed and garnishments against debtors’ salaries stop.
- Proposal: A formal offer by a debtor under the Bankruptcy and Insolvency Act to creditors to settle debts under conditions other than the original terms.
- Debtor Characteristics
- Cases of debtors with a previous bankruptcy are defined as insolvencies in which the debtor had previously filed for one or more bankruptcies.
- Urban/Rural: Debtors are identified as urban or rural based on their postal code. Rural postal codes are identified by a zero in the second position of the forward sortation area (the first three digits of the postal code). New Brunswick does not have this standard rural postal code identification system and is excluded from the comparison.
- Reasons for Financial Difficulty
The reasons for financial difficulties categories identified in this report are based on an analysis of the text responses provided by the debtor to the OSB on the Form 79, Statement of Affairs. Our analysis uses a combination of business rules and business intelligence tools to separate the information into 14 categories selected by the OSB. A debtor can cite more than one reason for insolvency. Therefore, multiple reasons may be declared for each debtor. In 2021, 72% of debtors provided reasons for financial difficulty that can be categorized under the heading “Financial Mismanagement”. This category has been excluded due to its limited analytical value. It is, however, included in the appendix tables. Additionally, 1,987 debtors are excluded from this section because the reason they listed could not be categorized.
Categories- Loss of income: Reduction of revenue, from work or other sources, over a given period of time. Unemployment, job loss, seasonal work, recessionrelated income loss (stocks, etc.), difficulty finding work, pay cut, sporadic employment (including part-time work) and reduction in household income cause a loss of income. Loss of income may be one factor that causes insolvency.
- Medical reasons: The treatment or prevention of an illness or injury, experienced by the debtor or a family member, that prevents the debtor from working to his/her full capacity. Medical reasons may be one factor that causes insolvency.
- COVID-19 Pandemic: Illness, loss of work or other hardship caused by the COVID-19 Pandemic may be one factor that causes insolvency.
- Relationship breakdown: The failure of a marriage, common-law relationship or the existence of marital problems. Relationship breakdown can cause an increase in expenses or a reduction of household income and may be one factor that causes insolvency.
- Financial Support of Others: Money given by the debtor to help family members, friends or a spouse. Financial support can take many forms, such as regular money transfers, the co-signing of loans, child and spousal support payments. Financial support of others can make the debtor financially strained, and may be one factor that causes insolvency.
- Assets and Liabilities
- Assets: What a person owns that can be sold or used to pay a debt.
- Liabilities: An amount owing by one person (a debtor) to another (a creditor), payable in money, goods or services.
- Income and Expenses
- Family income refers to the net income of the debtor’s household. This includes singleperson households.
- Family expenses are the expenses for the debtor’s entire household. This includes singleperson households.
- Expense definitions
- Housing expenses: Rent/Mortgage/Hypothec, Property taxes, Condo fees, Heating/gas/oil, Telephone, Cable, Hydro, Water, Furniture, and Other
- Living expenses: Food/Grocery, Laundry/Dry cleaning, Grooming/Toiletries, Clothing, and Other
- Transportation expenses: Car lease or payments, Repair/Maintenance/Gas, Public transportation, and Other
- Insurance expenses: Vehicle, House, Furniture/Contents, Life insurance, and Other
- Personal expenses: Smoking, Alcohol, Dining/Lunches/Restaurants, Entertainment/Sports, Gifts/Charitable donations, Allowances, and Other
- The payment category was omitted from the report because the main expenses in this category are not expenses that the debtor experiences outside of insolvency; they are payments to the LIT for expenses related to the insolvency process.