
1. Introduction
This Quarterly Financial Report (QFR) has been prepared by management as required by section 65.1 of the Financial Administration Act, in the form and manner prescribed by the Treasury Board. This document should be read in conjunction with the Main Estimates and Supplementary Estimates for fiscal year 2019–20.
1.1 Our organization
Innovation, Science and Economic Development Canada (ISED) works with Canadians in all areas of the economy and in all parts of the country to improve conditions for investment, enhance Canada's innovation performance, increase Canada's share of global trade and build a fair, efficient and competitive marketplace.
ISED helps Canadian businesses grow, innovate and expand so they can create good-quality jobs and wealth for Canadians. It also supports science research and the integration of scientific considerations into investment and policy choices. The Department helps small businesses grow through trade and innovation and promotes increased tourism in Canada. The Department also works to position Canada as a global centre for innovation where investments support clean and inclusive growth, the middle class prospers through more job opportunities and companies become global leaders.
ISED's efforts focus on improving conditions for investment, supporting science, helping small and medium-sized businesses grow, building capacity for clean and sustainable technologies and processes, increasing Canada's share of global trade, promoting tourism, and building an efficient and competitive marketplace.
A summary description of Innovation, Science and Economic Development Canada's core responsibilities can be found in Part II of the Estimates.
1.2 Basis of presentation
The authority of Parliament is required before moneys can be spent by the government. Approvals are given in the form of annually approved limits through appropriation acts or through legislation for specific purposes. This report has been prepared using a special purpose financial reporting framework designed to meet financial information needs with respect to the use of spending authorities.
As part of the departmental performance reporting process, ISED prepares its annual departmental financial statements on a full accrual basis in accordance with Treasury Board accounting policies, which are based on Canadian Generally Accepted Accounting Principles for the public sector. The spending authorities are voted by Parliament on an expenditure basis. Therefore, management has prepared this report using an expenditure basis of accounting.
The accompanying Statement of Authorities includes ISED's spending authorities granted by Parliament, which includes the 2019–20 Main and Supplementary Estimates as well as any adjustments, warrants and transfers.
This report has not been subject to an external audit or review. However, it has been reviewed by ISED's Departmental Audit Committee (DAC) in accordance with Treasury Board guidance. No material misstatements or omissions have been identified.
In the event that Parliament is dissolved for the purposes of a general election, section 30 of the Financial Administration Act authorizes the Governor General, under certain conditions, to issue a special warrant authorizing the Government to withdraw funds from the Consolidated Revenue Fund. A special warrant is considered an appropriation for the fiscal year in which it is issued.
1.3. General Descriptions
The following descriptions are referred to throughout the report:
- Authority: Approvals from Parliament to spend up to a specific amount.
- Operating (Vote 1): Amount approved for the fiscal year for the Department to spend on salary and operating expenditures.
- Capital (Vote 5): Amount approved for the fiscal year for the Department to spend on capital purchases or for the construction of assets.
- Grants and Contributions (Vote 10 and Statutory):
- Vote 10: Amount approved for the fiscal year for the Department to provide Grants and Contribution (G&C) funding to prospective recipients.
- Statutory: Amount approved through an existing Act of Parliament where additional annual approvals are not required by the Department to access G&C funding for recipients.
- Operating and Capital Carry Forward: Eligible funds lapsed in the previous fiscal year brought forward to the following year.
- Employee Benefit Plan (EBP): The department's contribution to public service employee benefit plans.
- Vote Netted Revenue (VNR): Authority to apply revenues earned by the organization to cover costs incurred for specific activities by that organization.
- Standard Object (SO): Classification or coding of transactions to permit the reporting of information about the nature of transactions in the Estimates and Public Accounts (i.e. personnel, professional and special services, and transfer payments).
2. Highlights of fiscal quarter and fiscal year-to-date (YTD) results
At the end of Q3, the variances in authorities available for use in 2019–20 versus 2018–19, result from a combination of increases in the department's Operating votes to accommodate new programming and from decreases in Grants and Contribution votes related to the winding down of the Post-Secondary Institutions Strategic Investment Fund (PSI-SIF). Higher planned net expenditures in the Canadian Intellectual Property Office's (CIPO) Revolving Fund also contributed to the differences.
Variances in authorities used are largely due to increased activities of new programs' and timing differences with regard to payments between periods.
2.1 Authorities available for use and planned expenditures
ISED's total authorities available for use of $3.0 billion at the end of the third quarter in 2019–20, amounts to a $149.4 million decrease over the same period in 2018–19. This is illustrated in Graph 1 below, in the Statement of Authorities and in Table 1: Departmental Budgetary Expenditures by Standard Object.
Graph 1: Comparison of Total Net Budgetary Authorities Available for Use as of December 31, 2019 and December 31, 2018
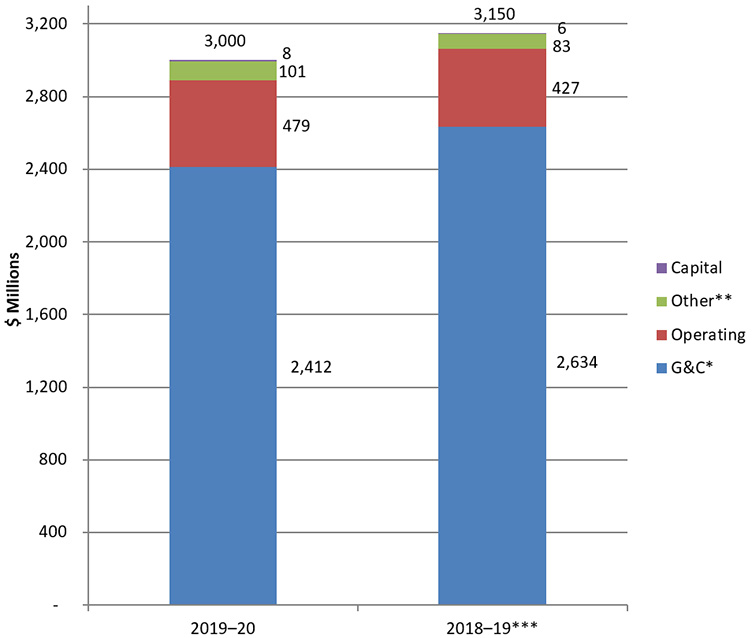
**Includes Canadian Intellectual Property Office (CIPO) Revolving Fund
***Amounts adjusted from prior year publication to include frozen funding
The overall change in authorities includes:
- Grants and Contributions (Vote 10 and Statutory): $221.8 million
- Net Operating Expenditures (Vote 1): $52.0 million
- Capital Expenditures (Vote 5): $1.9 million
- Other: $18.6 million
- CIPO Revolving Fund: $15.9 million
- Employee Benefit Plan (EBP): $2.8 million
- Other: $0.1 million
Variances for each appropriation are explained in detail throughout this document.
2.1.1 Highlights of Changes in Authorities Available for Use (2019–20 compared to 2018–19)
The following tables highlight the larger changes in authorities available for use, as reported in the Statement of Authorities:
| Grants and Contributions (Vote 10 and Statutory) | Increase/ (Decrease) in millions of dollars | |
|---|---|---|
| Vote 10 Authority | ||
| New Funding from Budget 2019 | ||
| CanCode 2.0 | $ 28.9 | |
| Connect to Innovate | 21.0 | |
| Funding increases based on cash flow requirements of existing programs | ||
| Strategic Innovation Fund | 208.3 | |
| Digital Research Infrastructure | 48.7 | |
| Intellectual Property Strategy | 30.3 | |
| Canada Foundation for Innovation | 26.6 | |
| Sustainable Technology Development Fund | 17.3 | |
| Genome | 12.0 | |
| Funding decreases based on cash flow requirements of existing programs | ||
| Post-Secondary Institutions Strategic Investment Fund | (386.4) | |
| Strategic Aerospace and Defence Initiative | (117.3) | |
| Innovation Superclusters Initiative | (60.4) | |
| CanCode | (30.2) | |
| Connecting Canadians Program | (23.9) | |
| Other minor items, net | 11.9 | |
| TOTAL CHANGE IN Vote 10 Authority | $ (213.2) | |
| Statutory Authorities | ||
| Programs for which funding has increased | ||
| Canadian Institute for Advanced Research (CIFAR) - Pan Canadian Artificial Intelligence | $ 7.5 | |
| Programs for which funding has decreased | ||
| Genome — Contributions | (13.3) | |
| Canada Small Business Financing Act | (2.8) | |
| TOTAL CHANGE IN Statutory Authorities | $ (8.6) | |
| TOTAL CHANGE IN Grants & Contributions Authorities (Vote 10 and Statutory) | $ (221.8) | |
| Net Operating Expenditures Authority (Vote 1) | Increase/ (Decrease) in millions of dollars | |
|---|---|---|
| New Funding from Budget 2019 | ||
| Various programs including Preparing for a New Generation of Wireless Tech (5G), CanCode 2.0, Connect to Innovate, etc. | $ 8.3 | |
| New Funding from Budget 2018 | ||
| Various programs including Cyber Certification, New Intellectual Property Strategy, Increasing Diversity in Science, etc. | 8.3 | |
| New Funding from the Fall Economic Statement | ||
| Strategic Innovation Fund | 3.4 | |
| Transfers from/to Other Government Departments (OGD) | ||
| PSPC — Build in Canada Innovation Program (BCIP) | 39.4 | |
| Treasury Board transfer for compensation adjustments (collective agreements) | 9.0 | |
| Operating budget carry-forward authority | (7.3) | |
| Planned operating requirement changes for various programs | (9.1) | |
| TOTAL CHANGE IN Net Operating Expenditures Authority (Vote 1) | $ 52.0 | |
| Capital Expenditures Authority (Vote 5) | Increase/ (Decrease) in millions of dollars |
|---|---|
| New Intellectual Property Strategy | $ 0.7 |
| Preparing for a New Generation of Wireless Tech (5G) | 0.7 |
| Capital Budget Carry-Forward Authority | 0.9 |
| Other minor items, net | (0.4) |
| TOTAL CHANGE IN Capital Expenditures Authority (Vote 5) | $ 1.9 |
| Other Authorities | Increase/ (Decrease) in millions of dollars |
|---|---|
| Increase in planned Employee Benefit costs is due to an increase to the prescribed EBP rate (starting from 2019-20, the comprehensive rate has changed from 20% to 27%) used to estimate the employee benefit plan costs as well as funding received for various Budget 2018 and Budget 2019 initiatives. | $ 2.8 |
| Increase in planned expenditures due to investments to modernize CIPO's IT infrastructure and to develop a suite of business services to meet client needs. | 15.9 |
| Other minor items, net | (0.1) |
| TOTAL CHANGE IN Other Authorities | $ 18.6 |
2.1.2 Highlights of Changes in Planned Expenditures (2019–20 compared to 2018–19)
Table 1: Departmental Budgetary Expenditures by Standard Object displays initial planned expenditures. These plans are subject to change during the fiscal year. The annual variances in planned expenditures are primarily due to the following:
| Spending Category | Explanation of significant changes (2019–20 compared to 2018–19) | Planned Increase/ (Decrease) in millions of dollars |
|---|---|---|
| Standard Object | ||
| Personnel | The increase is primarily related to new funding received for collective agreements; funding from Budget 2018 and Budget 2019 to support new programs; transfers from OGDs; and the operating budget carry forward that is now allocated to the individual standard objects including Personnel. | $ 40.5 |
| Professional Services | The increase is primarily related to development costs for IT taking place within CIPO as well as OGD transfers from PSPC for the Build in Canada Innovation Program (BCIP). | 27.0 |
| Transfer Payments | Significant changes have been explained in Section 2.1.1. | (221.8) |
| Changes in Revenues netted against Program Expenditures | ||
| Revenues netted against expenditures: | Higher planned revenues align with the anticipated costs of delivering services by Revenue Generating Organizations (RGOs) of the department. | (1.4) |
| Other minor items, net | 6.3 | |
| TOTAL CHANGE IN Planned Expenditures | $(149.4) | |
2.2 Authorities used and actual expenditures
Authorities used and actual expenditures for the third quarter of 2019–20 have increased by $36.9 million ($198.4 million in year-to-date spending) when compared to the same period last year (see Graph 2 below, the Statement of Authorities and Table 1: Departmental budgetary expenditures by Standard Object). The differences occur primarily in Grants and Contributions (Vote 10 and Statutory) and are largely attributable to increased program activity (such as the Strategic Innovation Fund), timing differences and increased cash flow requirements.
Graph 2: Comparison of Net Third Quarter and Year to date Authorities used and expended as at December 31, 2019 and December 31, 2018
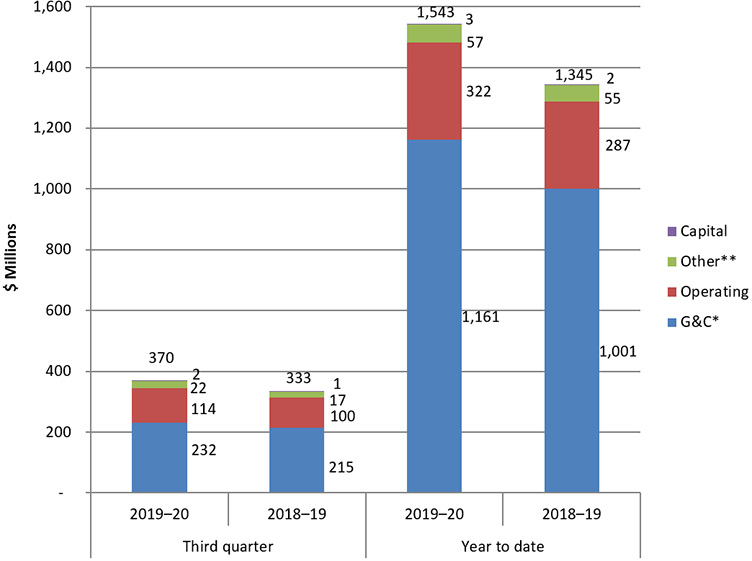
* Includes Vote 10 and Statutory Grants and Contributions expenditures
** Includes CIPO Revolving Fund
By category, the authorities used and expended in the third quarter and year-to-date compared to the same periods last year have changed as follows:
- Grants and Contributions (Vote 10 and Statutory):
- Quarterly — $16.9 million
- Year-to-date — $160.2 million
- Net Operating Expenditures (Vote 1):
- Quarterly — $14.0 million
- Year-to-date — $34.8 million
- Capital Expenditures (Vote 5):
- Quarterly — $1.2 million
- Year-to-date — $1.1 million
- Other:
- CIPO Revolving Fund:
- Quarterly — $4.1 million
- Year-to-date — $0.3 million
- EBP:
- Quarterly — $0.6 million
- Year-to-date — $1.9 million
- CIPO Revolving Fund:
Section 2.2.1 provides a detailed breakdown of the changes in authorities used for year-to-date and the third quarter.
2.2.1 Highlights of Changes in Authorities used for the Year-to-date and Third Quarter
The following tables highlight, by authority, the larger changes in authorities used, as reported in the Statement of Authorities:
| Grants and Contributions Authorities Used (Vote 10 and Statutory) | Increase/ (Decrease) in millions of dollars | ||
|---|---|---|---|
| Q3 | YTD | ||
| Higher approved spending requirements submitted by recipients / new agreements | |||
| Strategic Innovation Fund | $ 66.6 | $ 84.6 | |
| Canada Foundation for Innovation | 0.0 | 28.6 | |
| Innovation Superclusters Initiative | 7.1 | 19.2 | |
| Digital Research Infrastructure | 2.3 | 16.4 | |
| CANARIE | 0.0 | 15.6 | |
| Mitacs | 0.0 | 9.5 | |
| Timing variances between periods (payments are made in different quarters between fiscal years) / increased cash flow requirements, overall | |||
| Sustainable Development Technology Fund | $ (15.4) | $ 78.4 | |
| Timing variances between periods (payments are made in different quarters between fiscal years) | |||
| Canadian Institute for Advanced Research (CIFAR) | (26.5) | (1.9) | |
| Lower spending due to decreased funding; programs winding down | |||
| Strategic Aerospace and Defence Initiative | (12.3) | (48.8) | |
| Post-Secondary Institutions Strategic Investment Fund | (7.8) | (45.6) | |
| Other minor items, net | 2.9 | 4.2 | |
| Total Change in Grants and Contributions Authorities Used (Vote 10 and Statutory) | $ 16.9 | $ 160.2 | |
| Net Operating Expenditures Authorities Used (Vote 1) | Increase/ (Decrease) in millions of dollars | |
|---|---|---|
| Q3 | YTD | |
| Operating expenditures: The increase is primarily due to higher professional services related to the Build in Canada Innovation Program (BCIP) and an increase in IT consultant fees. The increase is also attributed to higher personnel expenditures for new programs, collective agreement retroactive adjustments, and an increase in personnel to address pay administration issues. | $ 17.5 | $ 49.0 |
| Revenue credited to vote: The increase is mainly due to revenues for internal services related to developing IT projects for CIPO. | (3.5) | (14.2) |
| Total Change in Net Operating Expenditures Authorities Used (Vote 1) | $ 14.0 | $ 34.8 |
| Capital Expenditures Authorities Used (Vote 5) | Increase/ (Decrease) in millions of dollars | |
|---|---|---|
| Q3 | YTD | |
| Minor items, net | $ 1.2 | $ 1.1 |
| Total Change in Capital Expenditures Authorities Used (Vote 5) | $ 1.2 | $ 1.1 |
| Other Authorities Used | Increase/ (Decrease) in millions of dollars | |
|---|---|---|
| Q3 | YTD | |
| Increase in Employee Benefit costs is due to an increase to the prescribed EBP rate used to estimate the employee benefit plan costs and the funding received for various Budget 2018 and Budget 2019 initiatives. | $ 0.6 | $ 1.9 |
| Increases to expenditures for CIPO are attributable to salary costs and IT infrastructure costs. These are partially offset by an increase in CIPO revenues from new international trademark treaties. | 4.1 | 0.3 |
| Other minor items, net | 0.1 | 0.1 |
| Total Change in Other Authorities Used | $ 4.8 | $ 2.3 |
2.2.2 Highlights of Changes in Actual Expenditures (2019–20 compared to 2018–19)
Variances in actual expenditures by standard object (Table 1: Departmental Budgetary Expenditures by Standard Object) are primarily due to the following:
| Spending Category | Explanation of significant changes in actual expenditures (2019-20 compared to 2018-19) | Increase/ (Decrease) in millions of dollars | |
|---|---|---|---|
| Q3 | YTD | ||
| Standard Object | |||
| Personnel | Significant changes have been explained in Section 2.2.1 — Net Operating Expenditures. | $ 19.2 | $ 37.2 |
| Professional Services | Significant changes have been explained in Section 2.2.1 — Net Operating Expenditures. | 4.8 | 26.2 |
| Transfer Payments | Significant changes have been explained in Section 2.2.1 — Grants and Contributions. | 16.9 | 160.2 |
| Revolving Fund Revenues | Increase due to new international trademark treaties. | (2.3) | (14.0) |
| Sales of Services | Significant changes have been explained in Section 2.2.1 — Net Operating Expenditures. | (3.6) | (14.3) |
| Other minor items, net | 1.9 | 3.1 | |
| Total Change in Net Budgetary actual expenditures | $ 36.9 | $ 198.4 | |
3. Significant changes in relation to operations, personnel and programs
On October 7, 2019, Douglas McConnachie was appointed Assistant Deputy Minister of the Corporate Management Sector and Chief Financial Officer of ISED.
4. Financial risks and uncertainties
ISED recognizes that its success in fulfilling its extensive mandate includes effective and integrated risk management (IRM). IRM enables the Department to identify and respond to uncertainty by using risk-based information to support decision-making and resource allocation, which support the achievement of departmental results.
The identification of risks is key to effective IRM. Among the 2019–20 enterprise risks, two finance-related risks were identified:
- Return on Investment: There might be insufficient time to fully realize the return on investment on ISED's grants and contributions portfolio, especially as it relates to new programming approaches. The return on those investments is less certain in an innovation economy where experimentation naturally translates into less certainty. Additionally, scientific endeavors tend to operate on longer timelines that might fail to demonstrate a return within the fixed periods generally defined within ISED contribution agreements.
- Organizational Agility: ISED might lack the agility to continually adapt its business model and mobilize people and resources to address shifting priorities. In an environment where limited resources support an expanding array of programs and priorities, the ability of the Department to effectively review and modify these programs and priorities is the key to maintaining operations.
To respond to these risks, ISED implements strong control frameworks, such as the Integrated Risk Management Framework (IRMF), which defines clear governance and policy objectives. These objectives support establishing expectations, monitoring progress and the timely checking of signals. ISED is also developing the data, processes and tools to support decision-making, including decision-making for resource allocation. These initiatives will place the organization in a position to adapt and align to shifting priorities and risks.
Approved by:

Simon Kennedy
Deputy Minister
February 26, 2020
Date
Douglas McConnachie
Assistant Deputy Minister/Chief Financial Officer
February 21, 2020
Date
| (in thousands of dollars) | Fiscal Year 2019–20 | Fiscal Year 2018–19 | |||||
|---|---|---|---|---|---|---|---|
| Total available for use for the year ending March 31, 2020Footnote 1 | Used during the quarter ended December 31, 2019 | Year to date used at quarter-end | Total available for use for the year ending March 31, 2019Footnote 1Footnote 2 | Used during the quarter ended December 31, 2018 | Year to date used at quarter-end | ||
| Vote 1 — Operating expenditures | 596,545 | 149,606 | 414,809 | 543,458 | 132,057 | 365,772 | |
| Vote 1 — Revenue Credited to the Vote | (117,364) | (35,793) | (93,002) | (116,249) | (32,218) | (78,728) | |
| Vote 1 — Net Operating Expenditures | 479,181 | 113,813 | 321,807 | 427,209 | 99,839 | 287,044 | |
| Vote 5 — Capital expenditures | 8,239 | 2,034 | 3,300 | 6,371 | 795 | 2,155 | |
| Vote 10 — Grants and contributions | 2,306,427 | 216,931 | 1,098,602 | 2,519,684 | 184,928 | 931,227 | |
| Total voted authorities | 2,793,847 | 332,778 | 1,423,709 | 2,953,264 | 285,562 | 1,220,426 | |
| Revolving Fund Gross expenditures | 202,186 | 48,824 | 140,713 | 188,796 | 42,356 | 126,430 | |
| Revolving Fund Revenues | (161,565) | (41,376) | (127,495) | (164,033) | (39,050) | (113,536) | |
| Revolving Fund Net expenditures | 40,621 | 7,448 | 13,218 | 24,763 | 3,306 | 12,894 | |
| Grants and Contributions | |||||||
| Genome Canada | 11,400 | - | 11,400 | 24,700 | - | 20,300 | |
| Liabilities under the Canada Small Business Financing Act & the Small Business Loans Act | 62,173 | 14,808 | 33,375 | 64,947 | 8,875 | 28,285 | |
| CIFAR — Pan-Canadian Artificial Intelligence | 32,500 | - | 17,619 | 25,000 | 21,000 | 21,000 | |
| Other statutory grants and contributions | - | - | - | - | 1 | 9 | |
| Total Statutory Grants and Contributions | 106,073 | 14,808 | 62,394 | 114,647 | 29,876 | 69,594 | |
| Employee Benefit Plans | 59,434 | 14,482 | 43,445 | 56,631 | 13,859 | 41,577 | |
| Refunds of Previous Years Revenue | - | 102 | 433 | - | 89 | 420 | |
| Proceeds for Crown Asset Disposals | 243 | 42 | 42 | 313 | 24 | 24 | |
| Ministers' Car Allowance | 351 | 73 | 248 | 344 | 97 | 162 | |
| Total budgetary statutory authorities | 206,722 | 36,955 | 119,780 | 196,698 | 47,251 | 124,671 | |
| Total Budgetary authorities | 3,000,569 | 369,733 | 1,543,489 | 3,149,962 | 332,813 | 1,345,097 | |
| Non-budgetary authorities | 800 | - | - | 800 | - | - | |
| Total authorities | 3,001,369 | 369,733 | 1,543,489 | 3,150,762 | 332,813 | 1,345,097 | |
| (in thousands of dollars) | Fiscal Year 2019–20 | Fiscal Year 2018–19 | |||||
|---|---|---|---|---|---|---|---|
| Planned expenditures for the year ending March 31, 2020Footnote 1 | Expended during the quarter ended December 31, 2019 | Year to date used at quarter-end | Planned expenditures for the year ending March 31, 2019Footnote 1Footnote 2 | Expended during the quarter ended December 31, 2018 | Year to date used at quarter-end | ||
| Expenditures: | |||||||
| Personnel | 582,839 | 156,708 | 438,834 | 542,291 | 137,525 | 401,654 | |
| Transportation and communications | 16,726 | 3,434 | 9,516 | 15,566 | 4,126 | 9,329 | |
| Information | 12,556 | 2,185 | 6,623 | 14,975 | 2,689 | 6,291 | |
| Professional and special services | 159,717 | 41,855 | 114,028 | 132,744 | 37,055 | 87,847 | |
| Rentals | 20,231 | 4,476 | 14,462 | 21,065 | 3,655 | 10,838 | |
| Repair and maintenance | 16,751 | 1,464 | 3,085 | 13,720 | 1,178 | 2,872 | |
| Utilities, materials and supplies | 9,400 | 1,512 | 3,387 | 9,380 | 1,486 | 3,473 | |
| Acquisition of machinery and equipment | 48,199 | 2,340 | 5,647 | 45,377 | 2,710 | 7,290 | |
| Transfer payments | 2,412,500 | 231,739 | 1,160,996 | 2,634,331 | 214,805 | 1,000,820 | |
| Other subsidies and payments | 579 | 1,189 | 7,408 | 795 | (1,148) | 6,946 | |
| Total gross budgetary expenditures | 3,279,498 | 446,902 | 1,763,986 | 3,430,244 | 404,081 | 1,537,360 | |
| Less revenues netted against expenditures: | |||||||
| Revolving Fund Revenues | 161,565 | 41,376 | 127,495 | 164,033 | 39,050 | 113,535 | |
| Sales of Services and Other Revenue | 117,364 | 35,793 | 93,002 | 116,249 | 32,218 | 78,728 | |
| Total Revenues netted against expenditures: | 278,929 | 77,169 | 220,497 | 280,282 | 71,268 | 192,263 | |
| Total net budgetary expenditures | 3,000,569 | 369,733 | 1,543,489 | 3,149,962 | 332,813 | 1,345,097 | |