
1. Introduction
This Quarterly Financial Report (QFR) has been prepared by management as required by section 65.1 of the Financial Administration Act, in the form and manner prescribed by the Treasury Board. This document should be read in conjunction with the Main Estimates and Supplementary Estimates for fiscal year 2025–26.
1.1 Our organization
Innovation, Science and Economic Development Canada (ISED) works with Canadians in all areas of the economy and in all parts of the country to improve conditions for investment; enhance Canada's innovation performance; increase Canada's share of global trade; and build a fair, efficient and competitive marketplace.
ISED helps Canadian businesses grow, innovate and expand so that they can create good quality jobs and wealth for Canadians. It also supports science research and the integration of scientific considerations into investment and policy choices. The Department helps small businesses grow through trade and innovation and promotes increased tourism in Canada. The Department also works to position Canada as a global centre for innovation where investments support clean and inclusive growth, the middle class prospers through more job opportunities and companies become global leaders.
ISED's efforts focus on improving conditions for investment, supporting science, helping small- and medium-sized businesses grow, building capacity for clean and sustainable technologies and processes, increasing Canada's share of global trade, promoting tourism, and building an efficient and competitive marketplace.
A summary description of ISED's core responsibilities can be found in the 2025–26 Departmental Plan.
1.2 Basis of presentation
The authority of Parliament is required before money can be spent by the government. Approvals are given in the form of annually approved limits through appropriation acts or through legislation for specific purposes. The accompanying Statement of Authorities includes the Department's spending authorities granted by Parliament, and those used by the Department consistent with the Main Estimates and Supplementary Estimates (as applicable) for the 2025–26 fiscal year. This report has been prepared using a special-purpose financial reporting framework designed to meet financial information needs with respect to the use of spending authorities.
As part of the departmental performance reporting process, ISED prepares its annual departmental financial statements on a full-accrual basis in accordance with Treasury Board accounting policies, which are based on Canadian Generally Accepted Accounting Principles for the public sector. The spending authorities are voted by Parliament on an expenditure basis. Therefore, management has prepared this report using an expenditure basis of accounting.
This report has not been subject to an external audit or review. However, it has been reviewed by ISED's Departmental Audit Committee (DAC) in accordance with Treasury Board guidance. No material misstatements or omissions have been identified.
1.3. General descriptions
The following descriptions are referred to throughout the report:
- Authority: Approvals from Parliament to spend up to a specific amount.
- Operating (Vote 1): Amount approved for the fiscal year for the Department to spend on salary and operating expenditures.
- Capital (Vote 5): Amount approved for the fiscal year for the Department to spend on capital purchases or for the construction of assets.
- Grants and Contributions (Vote 10 and Statutory):
- Vote 10: Amount approved for the fiscal year for the Department to provide Grants and Contributions (G&C) funding to prospective recipients.
- Statutory: Amount approved through an existing Act of Parliament where additional annual approvals are not required by the Department to access G&C funding for recipients.
- Operating and Capital Carry Forward: Eligible funds lapsed in the previous fiscal year brought forward to the following year.
- Employee Benefit Plan (EBP): The Department's contribution to public service employee benefit plans.
- Vote Netted Revenue (VNR): Authority to apply revenues earned by the organization to cover costs incurred for specific activities by that organization.
- Standard Object (SO): Classification or coding of transactions to permit the reporting of information about the nature of transactions in the Estimates and Public Accounts (i.e., personnel, professional and special services, and transfer payments).
2. Highlights of fiscal quarter and fiscal year-to-date (YTD) results
ISED's authorities available for use in 2025–26 increased by $2.5 billion compared with 2024–25, mostly in the Grants and Contributions authorities. This is attributable to increased funding for Electric Vehicle Battery Manufacturers ($1.9 billion), the Universal Broadband Fund ($489 million), Strategic Innovation Fund ($327 million), and Artificial Intelligence Programs ($139 million). These amounts are offset by reduced funding for programs such as the Canada Digital Adoption Program ($346 million), the Canada Foundation for Sustainable Development Technology ($158 million) and the Digital Research Infrastructure Strategy ($151 million). The capital vote remains consistent with the prior year planned spending levels.
ISED's net operating expenditures authority increased by $10.6 million reflecting increased funding for several Grants and Contributions programs. The increases were offset by reductions to expenditure categories such as Professional Services. Other authorities reduced by $5.5 million which is a combination of an increase to Employee Benefit Plan funding ($9.9 million) and a net decrease in planned spending for the department's revolving fund, CIPO ($15.3 million).
Variances in Q1 authorities used (a decrease of $27.3 million) are mainly attributable to the timing of payments made for Grants and Contributions between fiscal years and reductions in expenditure categories such as Professional Services.
2.1 Authorities available for use for the fiscal year and planned expenditures
ISED's current total authorities available for use of $8.6 billion in 2025–26 is $2.5 billion higher than the same period in 2024–25. This is illustrated in Graph 1 below, in the Statement of Authorities and in the Departmental Budgetary Expenditures by Standard Object.
Graph 1: Comparison of total net budgetary authorities available for use as at June 30, 2025, and June 30, 2024
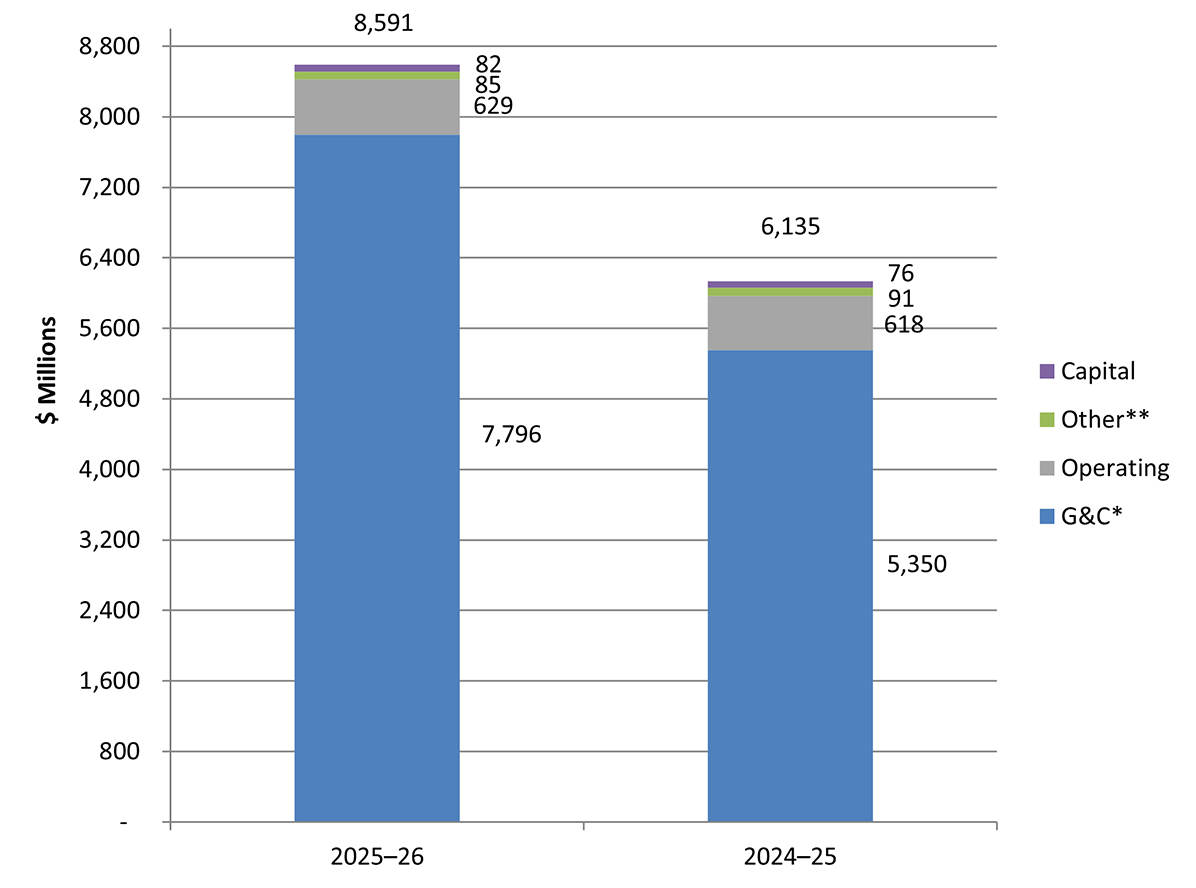
Comparison of total net budgetary authorities available for use as at June 30, 2025, and June 30, 2024
| 2025–26 | 2024–25 | |
|---|---|---|
| G&CFootnote * | 7,795,803,000 | 5,349,946,000 |
| Operating | 628,663,000 | 618,058,000 |
| OtherFootnote ** | 85,169,000 | 90,716,000 |
| Capital | 81,803,000 | 76,407,000 |
| Total Budget | 8,591,438,000 | 6,135,127,000 |
The overall increase in total net budgetary authorities available for use includes:
- Grants and Contributions (Vote 10 and Statutory): $2,445.8 million increase
- Net Operating Expenditures (Vote 1): $10.6 million increase
- Capital Expenditures (Vote 5): $5.3 million increase
- Other: $5.5 million decrease
- Employee Benefit Plan (EBP): $9.9 million increase
- Canadian Intellectual Property Office Revolving Fund: $15.3 million decrease
- Other: $0.1 million decrease
Variances for each type of appropriation are explained in detail in the tables below.
2.1.1 Highlights of changes in authorities available for use (2025–26 compared with 2024–25)
The following tables highlight the larger changes in authorities available for use, as reported in the Statement of Authorities (unaudited).
| Increase/ (Decrease) in millions of dollars | |
|---|---|
| Additional funding generated by recent Budget decisions | |
| Strategic Innovation Fund | 219.7 |
| Artificial Intelligence Compute Infrastructure Program / Compute Access Fund Program | 139.4 |
| Global Innovation Clusters | 85.9 |
| Horizon Europe | 34.5 |
| CanCode Program | 32.6 |
| Black Entrepreneurship Program | 15.0 |
| National Artificial Intelligence Institutes | 12.0 |
| Futurpreneur | 12.0 |
| Patent Collective Pilot Program | 7.5 |
| Canadian Institute for Advanced Research – Canadian Artificial Intelligence Safety Institute | 6.0 |
| Life Sciences Fund | 3.0 |
| Business Data Lab | 2.4 |
| Funding changes for existing programs | |
| Electric Vehicle Battery Manufacturers | 1,899.7 |
| Universal Broadband Fund | 489.3 |
| Strategic Innovation Fund | 107.5 |
| Strategic Science Fund – Science Research and Talent Development | 84.8 |
| Global Innovation Superclusters | 78.8 |
| Genome | 16.0 |
| Coordinated Accessible National Health Network | negative (5.0) |
| Canada Foundation for Innovation | negative (6.4) |
| CANARIE Inc. | negative (8.4) |
| ElevateIP Program | negative (11.0) |
| Telesat Low Earth Orbit Satellite Capacity | negative (15.0) |
| Mitacs | negative (45.0) |
| Digital Research Infrastructure Strategy | negative (151.5) |
| Canada Foundation for Sustainable Development Technology | negative (157.6) |
| Programs for which funding has ended in 2024–25Footnote * | |
| Diverse and Inclusive Economy Program | negative (6.9) |
| Digital Literacy Exchange | negative (7.0) |
| Indigenous Tourism Fund | negative (12.5) |
| Connect to Innovate | negative (38.3) |
| Canada Digital Adoption Program | negative (346.5) |
| Other minor items, net | negative (3.8) |
| Total Change in Vote 10 Authority | 2,431.2 |
| Statutory Authorities Program changes based on cash flow requirements |
|
| Canada Small Business Financing Act | 19.9 |
| Programs for which funding has ended in 2024–25Footnote * | |
| Pan-Canadian Artificial Intelligence Strategy | negative (5.3) |
| Total Change in Statutory Authorities | 14.6 |
| Total Change in Grants and Contributions (Vote 10 and Statutory) | 2,445.8 |
|
|
| Increase/ (Decrease) in millions of dollars | |
|---|---|
| Additional funding generated by Budget decisions | |
| Health Emergency Readiness Canada and Life Sciences Fund | 17.4 |
| Canadian Artificial Intelligence Sovereign Compute Strategy | 4.8 |
| Canadian Artificial Intelligence Safety Institute | 3.5 |
| Clean Technology Data Strategy Initiative and Clean Growth Hub Initiative | 3.3 |
| Black Entrepreneurship Program | 1.2 |
| Women's Entrepreneurship Strategy | 1.1 |
| Budget 2023 – Refocusing Government Spending Reductions | negative (6.5) |
| Funding changes based on cash flow requirements of existing programs & previous budgets | |
| Strategic Innovation Fund | 6.0 |
| Universal Broadband Fund | negative (1.7) |
| Beneficial Ownership Registry | negative (4.1) |
| Funding which has ended in 2024-25 | |
| Upskilling for Industry | negative (1.6) |
| Canada Digital Adoption Program | negative (15.1) |
| Other minor items, net | 2.3 |
| Total Change in Net Operating Expenditures Authority (Vote 1) | 10.6 |
| Increase/ (Decrease) in millions of dollars | |
|---|---|
| Funding changes | |
| New Generation of Wireless Technology 5G | 5.6 |
| Other minor items, net | negative (0.3) |
| Total Change in Capital Expenditures Authority (Vote 5) | 5.3 |
| Increase/ (Decrease) in millions of dollars | |
|---|---|
| Employee Benefit Plans – the increase is due to the use of a higher EBP percentage in 2025–26 to calculate its value compared to the one used in 2024–25 as well as for funding received for various Budget measures and new initiatives. | 9.9 |
| CIPO's Revolving Fund Net expenditures – the variance is due to an increase in Patent Maintenance fees and Trademark planned revenues offset by a combination of reduced costs related to the end of the Next Generation Project and an increase in salary costs. | negative (15.3) |
| Other minor items, net | negative (0.1) |
| Total Change in Other Authorities | negative (5.5) |
| Spending Category | Explanation of Significant Changes (2025–26 compared with 2024–25) | Planned Increase/ (Decrease) in millions of dollars |
|---|---|---|
| Standard Object | ||
| Personnel | Salary increases are primarily attributed to additional funding received in 2025-26 and the impact of the use of a higher EBP percentage in 2025-26 to calculate its value compared to the one used in 2024-25. | 29.0 |
| Professional Services | Decrease in professional services is primarily attributed to the Budget 2023 Refocusing Government Spending. | negative (5.3) |
| Utilities, Materials and Supplies | Decrease is mostly attributable to a realignment between Standard Object – Utilities, materials and supplies and Acquisition of machinery and equipment in 2025-26. | negative (19.4) |
| Acquisition of machinery and equipment | Increase is mostly attributable to a realignment between Standard Object – Utilities, materials and supplies and Acquisition of machinery and equipment in 2025–26 and to additional funding accessed for the New Generation of Wireless Technology – 5G initiative. | 30.6 |
| Transfer Payments | Significant changes have been explained in Section 2.1.1. | 2,445.8 |
| Other minor items, net | negative (1.3) | |
| Less changes in revenues netted against program expenditures | ||
| Revenues netted against expenditures | The increase is mainly due to planned higher CIPO's revenues following a change in Patent Maintenance fees and Trademark revenues. | 23.1 |
| Total Change in Planned Expenditures | 2,456.3 | |
2.2 Authorities used to date and actual expenditures
Authorities used and actual expenditures for the first quarter of 2025–26 decreased by $27.3 million when compared with the first quarter of 2024–25. (See Graph 2 below, the Statement of Authorities, and the Departmental Budgetary Expenditures by Standard Object.) The differences occurred primarily in Grants and Contributions payments and are largely attributable to recipients' cash flow requirements and the timing variances of payments. Additionally, spending on professional services has decreased year-over-year.
Graph 2: Comparison of net first-quarter authorities used and expended as of June 30, 2025 and June 30, 2024
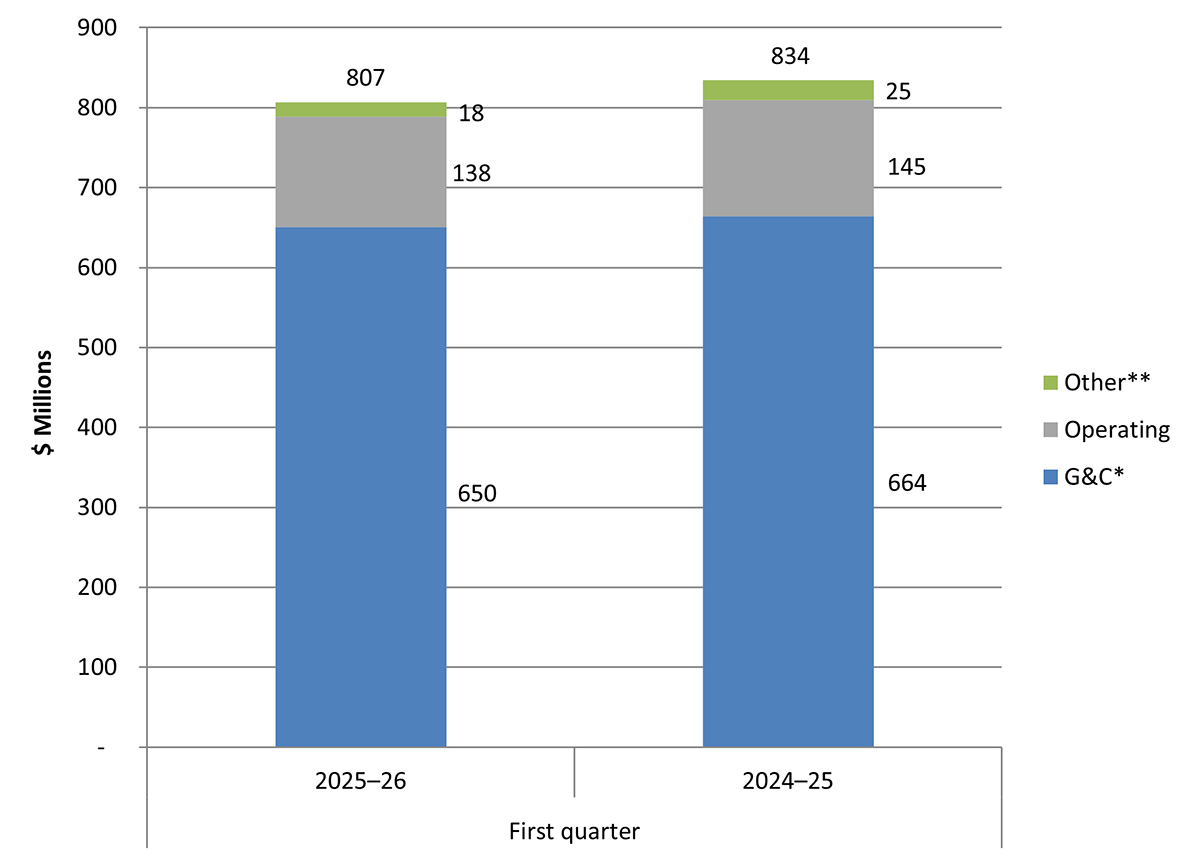
Comparison of net first-quarter authorities used and expended as of June 30, 2025 and June 30, 2024
| 2025–26 | 2024–25 | |
|---|---|---|
| G&CFootnote * | 650,394,000 | 664,270,000 |
| Operating | 138,099,000 | 145,270,000 |
| OtherFootnote ** | 18,365,000 | 24,607,000 |
| Total | 806,858,000 | 834,147,000 |
By category, the authorities used and expended in the first quarter compared with the same time last year have changed as follows:
- Grants and Contributions (Vote 10 and Statutory) – $13.9 million decrease
- Net Operating Expenditures (Vote 1) – $7.2 million decrease
- Other
- CIPO Revolving Fund – $8.3 million decrease
- Other minor items, including capital expenditures (Vote 5) and EBP – $2.1 million increase
Section 2.2.1 provides a detailed breakdown of the changes in authorities used for the first quarter.
2.2.1 Highlights of changes in authorities used for the first quarter
The following tables highlight, by authority, the larger changes in authorities used, as reported in the Statement of Authorities.
| Increase/ (Decrease) in millions of dollars Q1 | |
|---|---|
| New/additional program spending | |
| Horizon Europe | 34.9 |
| AI Compute Infrastructure Program | 6.6 |
| Variance due to timing of payments and/or cash flow requirements | |
| Canada Foundation for Innovation | 51.1 |
| Strategic Science Fund | 30.1 |
| Global Innovation Clusters | 21.4 |
| Futurpreneur Canada | 9.0 |
| Canadian Institute for Advance Research | 7.1 |
| CANARIE Inc | 6.3 |
| WES Ecosystem Fund | negative (5.3) |
| ElevateIP | negative (13.3) |
| Digital Research Infrastructure Strategy | negative (59.6) |
| Programs for which funding has ended in 2024–25 | |
| AdMare Bioinnovations | negative (6.7) |
| Canada Digital Adoption Program | negative (94.4) |
| Other minor items, net | negative (1.1) |
| Total Change in Grants and Contributions Authorities Used (Vote 10 and Statutory) | negative (13.9) |
| Increase/ (Decrease) in millions of dollars Q1 | |
|---|---|
| Net Operating expenditures: The decrease is primarily due to reductions in professional service expenditures. |
negative (7.2) |
| Total Change in Net Operating Expenditures Authorities Used (Vote 1) | negative (7.2) |
| Increase/ (Decrease) in millions of dollars Q1 | |
|---|---|
| Other minor items, net | negative (0.4) |
| Total Change in Capital Expenditures Authorities Used (Vote 5) | negative (0.4) |
| Increase/ (Decrease) in millions of dollars Q1 | |
|---|---|
| Revolving Fund Net expenditures – the variance is mainly due to higher revenues from patent maintenance fees and trademark application filings, largely driven by increased volumes and the CPI adjustment of January 2025. Operating expenses were also lower year-over-year, mostly due to decreases in professional services for the implementation of the New Generation Patent system, which was deployed in July 2024. These savings were partially offset by increases to salaries, in particular, for patent examiners who signed a new collective agreement. | negative (8.3) |
| Other minor items, net | 2.5 |
| Total Change in Other Authorities Used | negative (5.8) |
| Spending Category | Explanation of significant changes (2025–26 compared to 2024–25) | Increase/ (Decrease) in millions of dollars Q1 |
|---|---|---|
| Standard Object | ||
| Personnel | Salary Increases can be attributed primarily to funding received for collective agreement increases, such as for the patent examiners in CIPO, as well as additional funding for various new programs. | 8.2 |
| Professional and Special Services | Decreases are mostly attributable to reductions related to CIPO, who completed production of a new patent system. Other amounts relate to timing differences between fiscal years for legal services received from Justice Canada as well as for increased spending for the Innovative Solutions Canada program. | negative (12.9) |
| Transfer Payments | Significant changes have been explained in Section 2.2.1. | negative (13.9) |
| Other minor items, net | negative (2.7) | |
| Less revenues netted against expenditures | ||
| Revolving Fund Revenues | Revolving fund revenue increases were from patent maintenance fees and trademark application filings, largely driven by increased volumes and the CPI adjustment of January 2025 | 6.0 |
| Total Change in Budgetary expenditures | negative (27.3) | |
3. Significant changes in relation to operations, personnel and programs
Several changes have occurred since the last published quarterly report (February 28, 2025). The following are the more significant changes related to personnel and programs:
- On April 7 Kendal Hembroff took on the role of Associate Assistant Deputy Minister (ADM) of the Industry Sector. Kendal had served as ADM of the Strategic Communications and Marketing Sector (SCMS), where Jean-Philippe Lapointe, Director General of the Digital Technologies and Investment Branch, will act until a replacement is found.
- At the end of May, Andrea Johnston, ADM of Innovation Canada, retired. Stephanie Tanton, ADM responsible for the Strategic Innovation Fund, replaces Andrea, and will at the same time, lead Innovation Canada.
- Effective June 5, Laurie-Eve Bergeron joined the department as head of Human Resources.
- Effective July 7, the department took on the responsibility for the AI Secretariat from the Privy Council Office. Continuing his work as Deputy Secretary, Mark Schaan returns to ISED to support the mandate of Honourable Evan Solomon, Minister of Artificial Intelligence and Digital Innovation.
4. Financial risks and uncertainties
Innovation continues to drive ISED's mandate, fostering the growth of critical sectors in Canada's economy. Between Q3 2024–25 and Q1 2025–26, focus on expanding targeted investments in green technologies and digital transformation initiatives continued, along with efforts to enhance Canada's integrated EV battery supply chain. Recent federal commitments aimed at attracting global talent and private sector collaboration have strengthened Canada's leadership in artificial intelligence (AI). These initiatives are designed to address immediate economic pressures while laying the groundwork for long-term competitiveness.
ISED has made significant strides in domestic manufacturing, particularly in EV battery production, through regional partnerships and strategic investments. Recent collaborations with international automakers, such as those in the Indo-Pacific region, have reinforced Canada's supply chain resilience and reduced dependency on overseas suppliers. As part of the Pan-Canadian Artificial Intelligence Strategy, ISED has effectively aligned funding approaches with private-sector priorities, resulting in notable growth in industry partnerships. This includes the new Canadian Sovereign AI Compute Strategy, which is a program specifically designed to mobilize private sector investment, support businesses, and provide access to necessary AI compute capacity. Furthermore, ISED continues its robust support for midstream processing under the Canadian Critical Minerals Strategy, enhancing value-added production within Canada.
In Q1 2025–26, the Department continues to experience fiscal pressures influenced by persistent inflationary trends, elevated interest rates, and geopolitical tensions that are contributing to uncertainty in international trade and supply chains. To manage these challenges, ISED is streamlining its financial management practices by implementing scenario planning and the proactive reallocation of resources to ensure the ongoing delivery of program objectives. Finally, contribution agreements are currently under review with the aim of incorporating more flexible risk-sharing measures. This approach has enabled ISED to successfully navigate current economic volatility while upholding its strategic priorities.
The government's Refocusing Government Spending (RGS) initiative, introduced in Budget 2023, continues to influence departmental efficiency. Continued adherence to spending limits and an enhanced focus on operational efficiencies will compel ISED to adopt additional cost-management strategies (caps on professional services and travel remain in effect). To support these efforts, enhanced reporting through Monthly Financial Status Reports will include forward-looking indicators to provide comprehensive insight into expenditure trends and potential risks.
To further address financial risks, ISED has strengthened its risk management framework by:
- Establishing a standardized departmental approach to risk management implementation for ISED's grant and contribution (G&C) programs to enhance consistency and support informed decision-making;
- Pursuing the implementation of Phase 3 of the Financial Management Modernization Initiative, with a focus on integrating real-time financial data into decision-making processes; and
- Reinforcing accountabilities under the CFO model through additional clarity in roles and financial oversight functions.
Looking ahead, evolving economic and geopolitical landscapes continue to necessitate vigilant resource management. In Q1 2025–26, renewed uncertainties caused by global trade disruptions and technological dependencies are driving strategic realignments of departmental priorities. ISED remains committed to aligning its support and investments with broader Government of Canada priorities, notably the RGS initiative. This strategic alignment underscores ongoing efforts to effectively address fiscal uncertainties and promote resilient economic growth.
Approved by:
Philip Jennings
Deputy Minister
Date: August 25, 2025
Douglas McConnachie
Chief Financial Officer
Date: August 19, 2025
| Fiscal Year 2025–26 | Fiscal Year 2024–25 | |||||
|---|---|---|---|---|---|---|
| Total available for use for the year ending March 31, 2026Footnote 1 | Used during the quarter ended June 30, 2025 | Year to date used at quarter-end | Total available for use for the year ending March 31, 2025Footnote 1 | Used during the quarter ended June 30, 2024 | Year to date used at quarter-end | |
| Vote 1 – Operating expenditures | 763,070 | 163,893 | 163,893 | 748,171 | 170,714 | 170,714 |
| Vote 1 – Revenue credited to the Vote | negative (134,407) | negative (25,794) | negative (25,794) | negative (130,113) | negative (25,444) | negative (25,444) |
| Vote 1 – Net operating expenditures | 628,663 | 138,099 | 138,099 | 618,058 | 145,270 | 145,270 |
| Vote 5 – Capital expenditures | 81,803 | 452 | 452 | 76,407 | 870 | 870 |
| Vote 10 – Grants and contributions | 7,675,234 | 649,822 | 649,822 | 5,243,951 | 663,117 | 663,117 |
| Total voted authorities | 8,385,700 | 788,373 | 788,373 | 5,938,416 | 809,257 | 809,257 |
| Revolving Fund gross expenditures | 263,133 | 58,273 | 58,273 | 259,602 | 60,532 | 60,532 |
| Revolving Fund revenues | negative (263,133) | negative (61,838) | negative (61,838) | negative (244,278) | negative (55,810) | negative (55,810) |
| Revolving Fund net expenditures | - | negative (3,565) | negative (3,565) | 15,324 | 4,722 | 4,722 |
| Liabilities under the Canada Small Business Financing Act & the Small Business Loans Act | 120,569 | 572 | 572 | 100,657 | 1,153 | 1,153 |
| CIFAR – Pan-Canadian Artificial Intelligence | - | - | - | 5,338 | - | - |
| Total statutory grants and contributions | 120,569 | 572 | 572 | 105,995 | 1,153 | 1,153 |
| Employee Benefit Plans | 84,960 | 21,240 | 21,240 | 75,069 | 18,767 | 18,767 |
| Refunds of previous years' revenue | - | 213 | 213 | - | 222 | 222 |
| Proceeds for Crown asset disposals | - | - | - | 122 | - | - |
| Ministers' salary and motor car allowance | 209 | 25 | 25 | 201 | 26 | 26 |
| Total budgetary statutory authorities | 205,738 | 18,485 | 18,485 | 196,711 | 24,890 | 24,890 |
| Total budgetary authorities | 8,591,438 | 806,858 | 806,858 | 6,135,127 | 834,147 | 834,147 |
| Non-budgetary authorities | 800 | - | - | 800 | - | - |
| Total authorities | 8,592,238 | 806,858 | 806,858 | 6,135,927 | 834,147 | 834,147 |
|
||||||
| Fiscal Year 2025–26 | Fiscal Year 2024–25 | |||||
|---|---|---|---|---|---|---|
| Planned expenditures for the year ending March 31, 2026Footnote 1 | Expended during the quarter ended June 30, 2025 | Year to date used at quarter-end | Planned expenditures for the year ending March 31, 2025Footnote 1 | Expended during the quarter ended June 30, 2024 | Year to date used at quarter-end | |
| Expenditures | ||||||
| Personnel | 819,781 | 205,076 | 205,076 | 790,817 | 196,896 | 196,896 |
| Transportation and communications | 10,374 | 1,650 | 1,650 | 7,001 | 2,068 | 2,068 |
| Information | 17,066 | 1,842 | 1,842 | 16,253 | 2,134 | 2,134 |
| Professional and special services | 206,158 | 24,735 | 24,735 | 211,481 | 37,629 | 37,629 |
| Rentals | 31,559 | 7,780 | 7,780 | 37,611 | 5,709 | 5,709 |
| Repair and maintenance | 10,853 | 246 | 246 | 10,106 | 561 | 561 |
| Utilities, materials and supplies | 4,091 | 445 | 445 | 23,535 | 545 | 545 |
| Acquisition of land, buildings and works | - | 17 | 17 | - | - | - |
| Acquisition of machinery and equipment | 93,293 | 1,853 | 1,853 | 62,646 | 3,153 | 3,153 |
| Transfer payments | 7,795,803 | 650,394 | 650,394 | 5,349,946 | 664,270 | 664,270 |
| Other subsidies and payments | - | 452 | 452 | 122 | 2,436 | 2,436 |
| Total gross budgetary expenditures | 8,988,978 | 894,490 | 894,490 | 6,509,518 | 915,401 | 915,401 |
| Less revenues netted against expenditures | ||||||
| Revolving Fund revenues | 263,133 | 61,838 | 61,838 | 244,278 | 55,810 | 55,810 |
| Sales of services and other revenue | 134,407 | 25,794 | 25,794 | 130,113 | 25,444 | 25,444 |
| Total revenues netted against expenditures | 397,540 | 87,632 | 87,632 | 374,391 | 81,254 | 81,254 |
| Total net budgetary expenditures | 8,591,438 | 806,858 | 806,858 | 6,135,127 | 834,147 | 834,147 |
|
||||||