
Summary:
This report provides an overview of the key characteristics and drivers affecting the performance of Canada’s engineering and architectural services industry. The research summarizes economic data and the results of a series of interviews with Canadian firms to identify key impediments to business, success factors and best practices.
- To obtain a copy of this publication or an alternative format (Braille, large print, etc.)
- Permission to reproduce
- Executive summary
- Key findings
- 1. Introduction
- 2. Industry profile
- 2.1 Financial indicators
- 2.2 Employment indicators
- 2.2.1 Occupations
- 2.2.2 Labour shortage
- 2.3 Economic indicators
- 3. Interview results
- 3.1 Successful business strategies
- 3.1.1 Growth strategies
- 3.1.2 Key growth areas
- 3.1.3 Managing a firm's reputation
- 3.1.4 Human resources strategies
- 3.1.5 Best practices
- 3.2 Strategies to work internationally
- 3.2.1 Permanent versus non-permanent presence
- 3.2.2 Foreign partners
- 3.2.3 Use of global value chains
- 3.2.4 The Canadian advantage
- 3.2.5 Best practices
- 3.3 Barriers to growth
- 3.3.1 Public procurement process
- 3.3.2 Labour constraints
- 3.3.3 Barriers for working internationally
- 3.3.4 Value of design
- 3.3.5 Best practices
- 3.4 Technology and innovation
- 3.1 Successful business strategies
- 4. Final remarks
- Appendix A: Participating organizations
- Appendix B: Interview guide
- References
PDF version

Executive Summary
The role of high-value services, such as financial and professional services, continues to grow in the Canadian economy. The services sector accounted for 71 percent of GDP while manufacturing's share was 13 percent (2010). Professional services are becoming more relevant as more and more economies seek to increase value-added activities and compete for investment within manufacturing. With this in mind, it is important to understand the drivers of success in Canada's professional services industry, particularly the engineering and architectural industry as it has been a key source of growth in recent years.
The study was conducted by the Conference Board of Canada on behalf of Industry Canada to develop a better understanding of the key characteristics and drivers affecting the performance of Canada's engineering and architectural services industry. This report summarizes economic data and the results of a series of interviews with Canadian firms to identify key impediments to business, success factors and best practices. Industry Canada collaborated with Foreign Affairs and International Trade Canada, Export Development Canada, the Association of Consulting Engineering Companies Canada and its member firms, Engineers Canada and the Royal Architectural Institute of Canada and its member firms on this study.
Key Findings
In terms of growth strategies, some firms are using mergers and acquisitions as a means to grow their geographic reach and service offerings. Others are becoming more niche-focused on particular regions, service offerings, and/or types of clients, while others are vertically integrated offering broad services.
Managing a firm's reputation is a priority. This can be achieved by maintaining client satisfaction through the provision of quality services, having strong business and communication skills, focusing on client relationships, and selecting partners strategically.
Human resource strategies are identified as critical to a firm's success as the industry faces a shortage of experienced highly skilled workers. Effective techniques include coaching and mentoring, promoting from within, choosing projects that will develop employee expertise, and employee ownership.
The effects of labour shortages are also apparent in the industry's trade performance. Industry exports have not changed significantly since 2005, and interviewees reported that capacity constraints have been a contributing factor. However, Canada is still a significant net exporter of engineering and architectural services and is the fourth largest exporter globally. When it comes to finding work outside of Canada, engineering and architecture firms have been most successful when leveraging their domestic strengths. These include recognized expertise in highly complex and technology intensive engineering projects, experience with public-private partnerships and the development of natural resources.
Canadian firms may engage in international markets by establishing a permanent local presence. This provides firms with local market intelligence as well as a network of suppliers and customers. Alternatively, Canadian firms may operate in a foreign market remotely by establishing effective local partnerships. These partners help to understand and overcome various barriers, such as language, cultural and regulatory differences.
Interviewees identified barriers limiting growth such as the public procurement process which tends to award contracts to the lowest price bidders. To overcome this obstacle, firms have adopted a number of cost-control techniques such as making use of technicians and other professionals who can support engineers and architects at a lower cost. Other barriers identified include labour shortages, and barriers to trade such as the underuse of trade commissioners.
Finally, technology plays an important role in the success of the industry. Technology is changing continuously and in order to stay competitive, firms are making use of the latest technology such as 3D modelling. Some firms have developed or acquired unique technologies as a means to differentiate themselves from their competitors. They have dedicated time for employees to explore innovative ideas. Smaller firms can also work with academia to find opportunities for developing innovative techniques or products.
1. Introduction
The engineering and architectural services industry has made strong gains in sales and employment since the mid-1990s. In fact, the pace of employment growth in the industry was nearly triple the average for the economy as a whole over this period. While the industry did see a dip in employment and sales as a result of the 2008-09 recession, it has fully recovered and is poised for continued growth.
Given the recent strength of the engineering and architecture industry, and the expectation that it will continue to be a growth driver for the Canadian economy, it is important to understand both its success factors and possible constraints on its future performance.
The first part of the report provides a profile of the industry that examines a variety of characteristics including its financial performance, employment indicators, structure and international trade performance. The second section of the report discusses the results of interviews carried out with industry leaders. It identifies key impediments to business and best practices in terms of how individual firms are successfully adapting to challenges and seizing opportunities. The interviews examined four aspects of the industry's performance:
- Successful strategies
- Strategies for working internationally
- Barriers to growth
- Innovation and technology
2. Industry Profile
The Architectural, Engineering and Related Services industry, as defined by the North American Industry Classification System (NAICS)Footnote 1 as NAICS 5413, comprises establishments primarily engaged in providing architectural, engineering and related services such as structure design, drafting, building inspection, landscape design, surveying and mapping, and laboratory and on-site testing. The most recently available data at the time the report was written was used.
2.1 Financial Indicators
The industry's revenues were $26 billion in 2010Footnote 2 of which engineering services accounted for 87 percent. The industry has experienced remarkable growth in recent years. Revenues stood at $14.3 billion in 2004. This represents an average annual growth in revenues of more than 10 percent per year, and has been driven by strong increases in domestic investment by both businesses and government. Total investment in structures and engineering projects rose from $83.9 billion in 2004 to $140 billion in 2010, and growth continued into 2011.Footnote 3
The industry's operating expenses were estimated to be $22.9 billion in 2010, resulting in operating profits of $3.1 billion. At 12 percent, the industry's operating profit margin is well above the economy wide average of 8 percent, and the average for the broad services sector of 8.6 percent. Moreover, the industry has been able to maintain its profit margin at a fairly stable rate over time. Margins are modestly higher in the architecture segment, at 13.3 percent in 2010, but engineering firms also have above average margins, at 11.8 percent in 2010.
2.1.1 Engineering Revenues
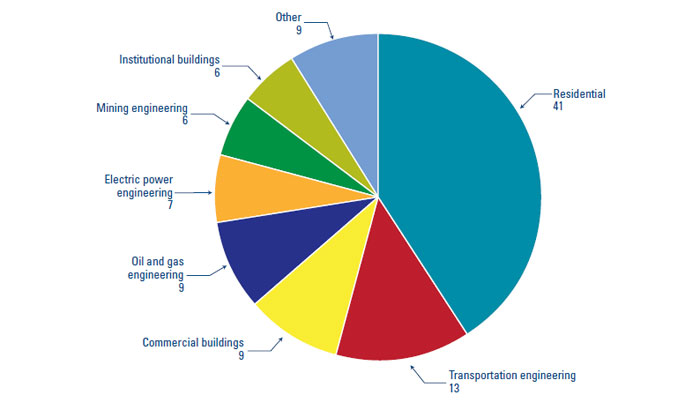
The largest client group for engineering firms in 2010 was petroleum products (oil and gas extraction) and the petrochemical sector, which accounted for 19.2 percent of revenues (see Figure 1). Other large sources of revenues included building construction, the mining sector, and transportation projects (such as bridges and highways).
Figure 1: Share of Engineering Sales, in Percentage
Engineering's largest clients have changed over the years

In recent years, the demand for engineering services from the oil and mining industries has increased significantly reflecting the rise in prices for oil and many mineral products. For example, Statistics Canada reports that oil prices rose by 79 percent between 2004 and 2011, while non-ferrous metal prices rose by 109 percent over the same period.Footnote 4 Consequently, profits have improved for these industries and there has been strong investment in exploration and development as companies try to take advantage of the high price environment.
Meanwhile, the share of revenues derived from manufacturers and secondary activities (such as environmental consulting and project management) has declined. However, it is important to note that the engineering revenues from the manufacturing sector rose modestly between 2004 and 2010. Thus, the decline in the share of engineering revenues that is derived from manufacturing is due to the rapid growth in other segments, rather than an outright decline in spending by manufacturers.
The decline in secondary activities, such as environmental consulting, construction services and other non-engineering specific services to the industry's revenues may be a reflection of capacity constraints within the industry. The combination of rapid growth in recent years and suggestions of labour shortages (see 2.2.2) may mean that engineering firms are focusing on their core businesses. As a result, growth in revenues derived from secondary activities has been much weaker.
2.1.2 Architectural Revenues
Architectural firms derive the majority of their revenues from the design of non-residential structures (see Figure 2). Major types of non-residential structures include educational buildings, health and office buildings. The sources of revenue have remained relatively constant over the years. The most significant change has been the decline in revenues derived from residential structures and the growth in other revenue sources (such as urban planning, building restoration, landscape architecture and interior design).
Figure 2: Share of Architectural Sales, in Percentage
Architectural revenues largely come from the construction of non-residential buildings
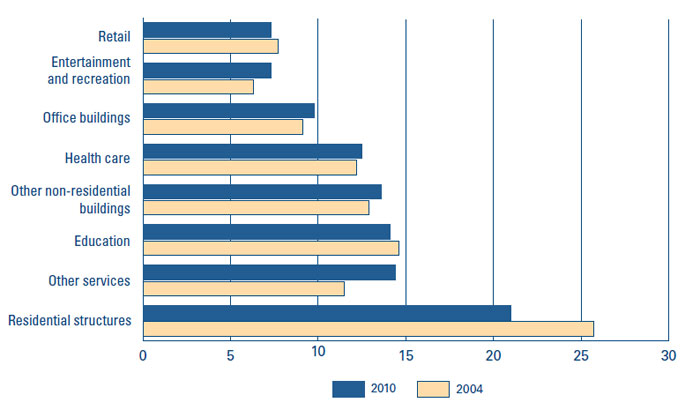
Revenues from residential construction projects have declined since 2004. In fact, the number of homes built in Canada in 2010 was below the number built in 2004. This has been a key factor limiting growth in architectural revenues from this segment. The largest source of growth in recent years has been educational and healthcare buildings. This may partially be the result of federal and provincial stimulus spending to counteract the effects of the financial crisis and recession of 2008-09, as a large portion of the spending was focused on building new infrastructure. With that stimulus now winding down, this trend may likely reverse itself in the coming years.
2.1.3 Provincial Breakdown
More than 90 percent of engineering and architectural revenues are concentrated in four provinces (see Figure 3). The largest provincial share is Alberta, with close to a third of the total industry revenues, due to the oil and gas industry, a key source of revenues for engineering firms. Ontario, Quebec and British Columbia are other large beneficiaries of engineering revenues.
Figure 3: Architect and Engineering Operating Revenues,
Provincial Share of Canadian Total, in Percentage for 2010
The industry's revenues are highly concentrated in four provinces
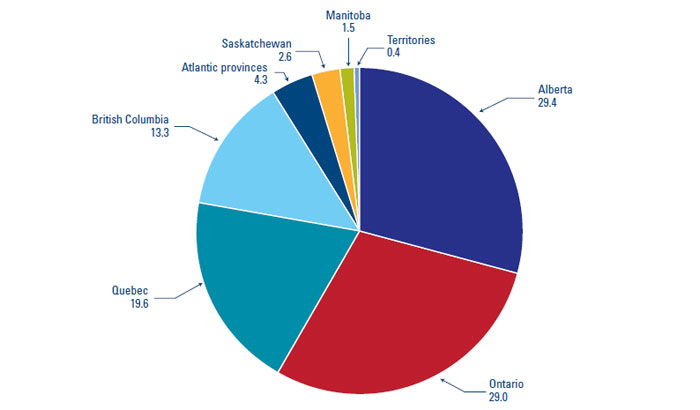
It should be noted that the regional mix of revenues for architectural services more closely resembles the distribution of population growth in Canada. Ontario is the single largest source of revenues, accounting for 40.6 percent in 2010. Quebec was the second most important region accounting for 19.3 percent of sales, while British Columbia and Alberta each accounted for about 15 percent of revenues.
2.1.4 Sales Profile: Architectural Firms vs. Engineering Firms
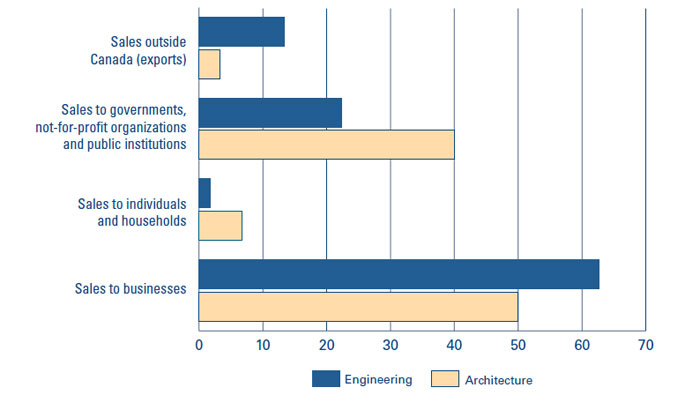
Within the industry, the type of client of engineering and architectural firms differs. While exports are more significant to engineering firms, sales to individuals are more important to architectural firms. However, the majority of sales for both sectors come from businesses and the public sector (see Figure 4).
Figure 4: Share of Engineering and Architectural Sales, in Percentage for 2010
Architecture and engineering markets differ
2.1.5 Labour Is a Key Cost Component
The industry is highly labour intensive; 44.6 percent of all operating expenses are salaries, wages and benefits (see Figure 5). The third largest expense for the industry, accounting for 13.5 percent of expenses, are fees paid to subcontractors, much of which would be labour costs. Thus, labour directly and indirectly accounts for more than half of the industry's operating expenses. Labour's share of the industry's costs increased modestly between 2004 and 2010, but the industry's cost structure has not changed markedly over time.
Figure 5: Share of Industry's Total Operating Costs, in Percentage for 2010
Most of the industry's costs are labour related

2.2 Employment Indicators
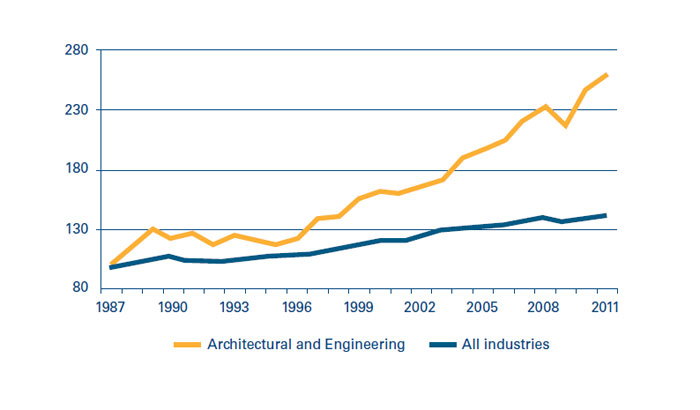
The architectural and engineering industry counted 283,000 employees in 2011, which is about 1.6 percent of the total workforce in Canada.Footnote 5 It also represents 21.6 percent of the professional, scientific and technical sector in Canada (see Figure 6). The industry has been a significant source of job creation for more than a decade. Industry employment has nearly doubled since 1997, and averaged growth of 5.1 percent per year since then (see Figure 7). This compares with average employment growth for all industries of 1.7 percent and growth of 4 percent for the broad other professional, scientific and technical services sector over the same period.
Figure 6: Share of Professional, Scientific and Technical Workers' Employment, in Percentage for 2011
Architecture and engineering accounts for a sizeable share of professional, scientific and technical workers
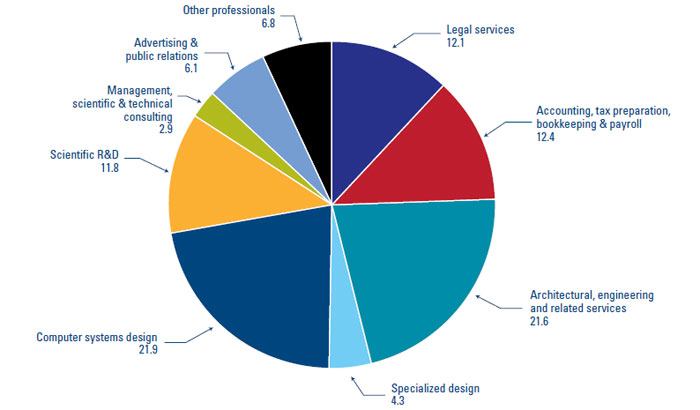
Figure 7: Architectural and Engineering Services Employment Index, 1987 = 100
The industry posted exceptionally strong employment growth in the last 15 years
2.2.1 Occupations
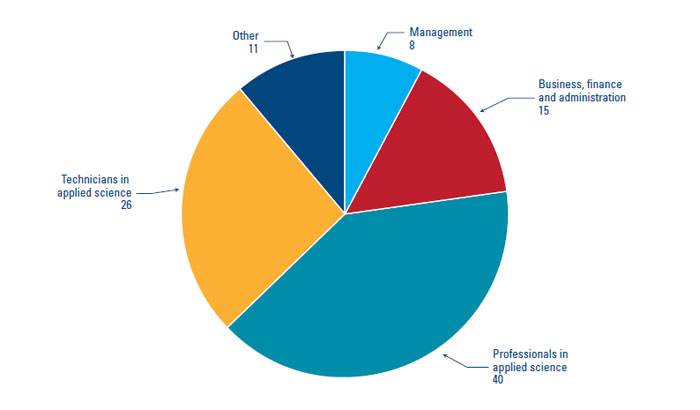
When describing the industry's workforce, it is important to note that the number of employees includes engineers, architects and all other employees who work in engineering and architectural firms, such as management and support staff. According to the 2006 Census, 40 percent of the workers in the engineering and architectural industry are professionals in applied science, mostly engineers and architects, and 26 percent are technicians in applied science. About a third of the industry's workers are in management, business, finance and administration or other occupations (see Figure 8).
Figure 8: Share of Architectural and Engineering Services Employment by Occupation, in Percentage
Employment by occupation shows business structure
2.2.2 Labour Shortage
The industry's concentration of employment in a limited number of highly skilled occupations has exposed it to reported labour shortages in those occupations. According to the Conference Board of Canada's Compensation Planning Survey,Footnote 6 an annual survey of large and medium-sized Canadian organizations operating in a variety of regions and sectors, professionals in engineeringFootnote 7 have been in the top five occupations in highest demand for more than a decade, alongside information technology specialists and accounting and finance specialists. More precisely, 33 percent of respondents in 2011 reported difficulty to recruit and/or retain employees with engineering skills, similar to the 35 percent recorded in 2001.
2.3 Economic Indicators
2.3.1 Industry's Concentration
There are about 17,500 architectural and engineering firms in Canada, of which 84 percent have fewer than 10 employees (see Figure 9). Canada counts 180 medium-sized firms, with between 100 and 500 employees and 30 large firms with more than 500 employees. Of these large firms, 16 are based in Ontario, seven in Quebec, six in Alberta and one is in British Columbia.
Figure 9: Share of Architectural and Engineering Enterprises by Size of Employment, in Percentage for 2011
The industry is largely made up of small firms

2.3.2 Pricing Power
Pricing power refers to an industry's capacity to transfer its cost increases on to its customers. An industry with high pricing power will be able to increase the price of its products by the same amount its costs increase and sometimes more. Industries with weak pricing power will usually have to absorb some or all of the cost increases, which will reduce their profitability. Depending on the degree of pricing power, industries will absorb price variations in the short term, but raise prices over time to catch up with its costs. The degree of pricing power determines how fast the industry can adjust its output prices to its cost increases.
Despite the high degree of competition implied by the large number of architectural and engineering firms, the industry's average price increases have surpassed the overall rate of inflation since 2002. Before 2002, the industry's prices were growing essentially at the same pace as overall inflation. As such, the industry has been able to consistently obtain higher than average price increases.
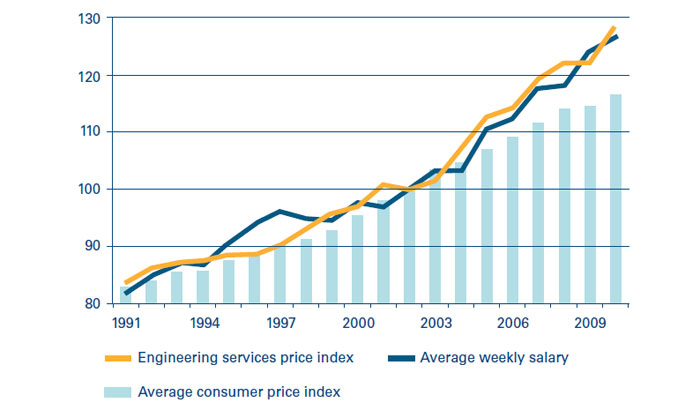
Since labour accounts for more than half of the industry's costs, it is useful to look at how the industry's price increases compare with its wage increases. Between 2002 and 2010, the average weekly earnings in the architectural and engineering industry rose by an average of 3 percent per year. Over the same period, the industry's price index rose by 3.2 percent per year, roughly the same as wages (see Figure 10). When the industry wasn't growing during the mid-1990s, its ability to raise prices was much more limited, but it appears that since that time the industry's pricing power has improved and it is now fairly strong.
Figure 10: Price Index 2002 = 100
The industry can pass wage cost increases on to clients
2.3.3 Construction Investments: A Driver of Domestic Growth
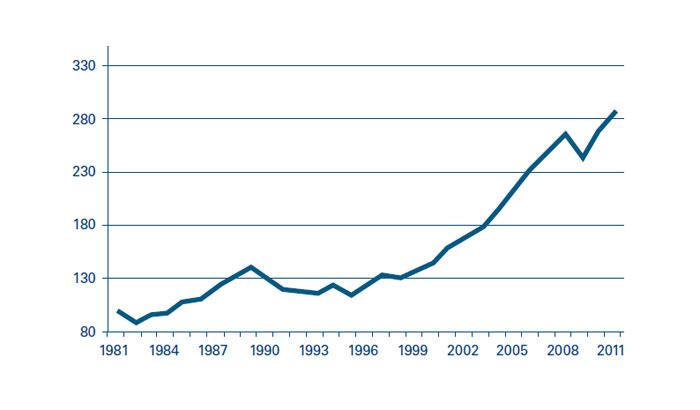
During the early 1990s, the architectural and engineering industry went through a sustained period of weakness. At that time, fewer projects were being developed as economic growth was generally weak during and following the economic recession of 1990-92. Financing costs were also high for investors, as interest rates were raised to high levels. In Canada, total investment in residential and non-residential construction was reduced by 17 percent from 1989 to 1993 (see Figure 11). The industry lost 11,500 jobs between 1989 and 1992, a peak-to-trough decline of about 8 percent. No significant improvements were observed until 1997 when interest rates stabilized and the economy was in better shape. Both construction spending and industry employment have boomed since then.
Figure 11: Investment in Residential and Non-Residential Construction, Billions of Dollars
Construction activity declined in the early 1990s
A more recent economic event that had an important impact on the industry was the recession of 2008-09. However, compared to the early 1990s, the decline was fairly steep but brief. Total residential and non-residential investment declined by 12.1 percent in 2009, but by 2011 it had surpassed its pre-recession peak.Footnote 8 The segment that has been the slowest to rebound is engineering construction spending on oil and gas projects (see Figure 12). Although oil prices are very high, natural gas prices are at multi-decade lows due to weak demand growth and rapid increases in production in the U.S. as a result of new horizontal drilling and hydraulic fracturing techniques. However, spending has more than recovered from the effects of the recession for most segments and industry employment today is 12 percent above where it stood in 2008.
Figure 12: Change in Construction Spending, 2011 versus 2008, in Percentage
Most types of construction spending have recovered from the effects of the recession
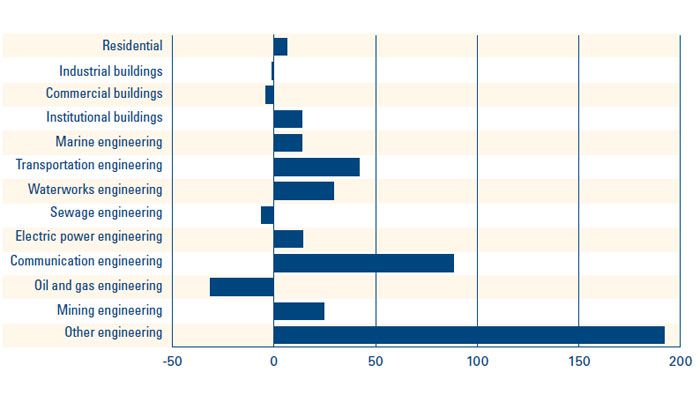
Domestic activity accounts for the vast majority of sales, and as such, domestic demand has been a key driver of the industry's growth. Nearly every major type of construction investment spending in Canada has risen over the past decade, with industrial buildings being the only major exception. Key drivers of growth have been residential construction, transportation projects, commercial buildings, and oil and gas projects (see Figure 13). With oil and metal prices expected to remain high compared to their historic norms, energy and mining related projects are expected to remain growth drivers for the industry in the years to come.
Figure 13: Share of Growth in Canadian Construction Spending Between 2011 and 2000, in Percentage
A variety of domestic sources have driven the industry's expansion
2.3.4 Canada is a Net Exporter of Architectural and Engineering Services
Rising exports, particularly prior to the mid-2000s, are part of the growth story for the industry. Exports accounted for 15.2 percent of industry sales, and 35.7 percent of firms reported having business activity outside of Canada in 2009.Footnote 9 These figures are high for a services industry. Engineering firms have a greater share of export sales than architectural firms.
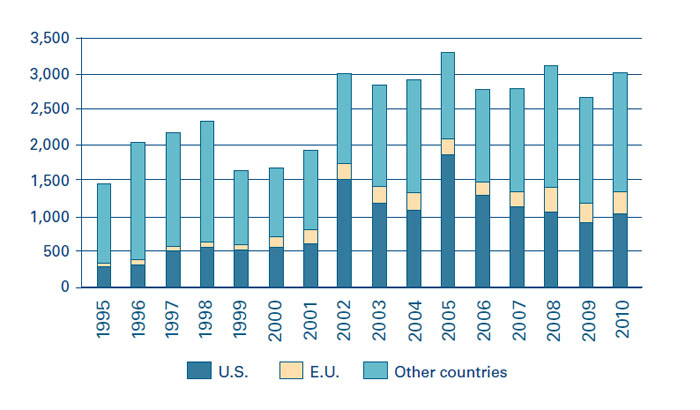
In terms of markets, industry exports to the U.S. have declined since peaking in 2005. The share of industry exports has fallen from a peak of more than half to only 34 per cent in 2010 (see Figure 14). As a result, the industry's exports to the European Union have made slow but steady gains over the past decade and now account for 10.4 percent of the industry's exports.Footnote 10
Figure 14: Canadian Exports of Architectural and Engineering Services, Millions of Dollars
The importance of the U.S. as a source of industry revenues has waned
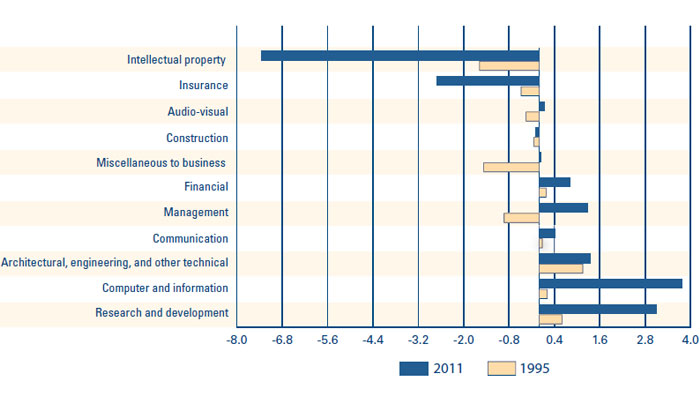
Canada exports more architectural and engineering services than it imports, as measured by Statistics Canada's International Transactions in Services Survey. The net trade balance (exports minus imports) of architectural and engineering services was the largest of all commercial services in 1995. However, exports of architectural and engineering services have shown only a modest increase in the following years, compared to many other tradable commercial services. For example, while total exports of architectural and engineering services increased by an average of 5.6 percent per year between 1995 and 2011, exports of computer and information services increased by 8.3 percent, management services increased by 8.9 percent and research and development increased by 7.2 percent per year on average. As of 2011, the architecture and engineering industry's net trade balance was in third position among tradable commercial services (see Figure 15).
Figure 15: Net Trade Balance of Commercial Services, Billions of Dollars
Industry is a net exporter, but some other service industries are expanding faster
Canada has been losing significant market share in the global export of engineering and architectural services. In 2000, Canada accounted for 10 percent of all architectural and engineering service exports in the world and was the third largest exporter of such services after the Netherlands and Germany according to United Nations data (see Table 1). In 2010, Canada's share was down to 5.7 percent becoming the fifth largest exporter, as the Netherlands and Germany have both increased their presence and Brazil and the U.K. have surpassed Canada.
| Share of World exports in percentage | Average annual growth of exports in percentage | ||
|---|---|---|---|
| 2000 | 2010 | 2000-2010 | |
| Source: UNCTAD, countries available. * Russian Federation average annual growth is from 2001 to 2010 as data was not available prior to 2001. Note: Data is not available for many large countries, including China, Japan, and the United States. | |||
| Netherlands | 21.9 | 36.1 | 21.2 |
| Germany | 15.2 | 16.5 | 16.4 |
| Brazil | 9.4 | 7.5 | 12.7 |
| Canada | 10.0 | 6.5 | 10.4 |
| Spain | 4.4 | 4.8 | 16.4 |
| Russian Federation | - | 4.3 | 29.3* |
The two largest exporters of architectural and engineering services, the Netherlands and Germany, are also the largest importers of such services. This suggests that there is a large amount of intra-firm trade between companies based in those countries and their foreign subsidiaries. India, Russia and Kazakhstan, have also become large importers of architectural and engineering services over the last decade (see Table 2). It is important to note that data was not available for many countries such as the U.S., the U.K., China, Japan and most of the Middle East countries.
| Share of world imports in percentage | Average annual growth of imports in percentage | ||
|---|---|---|---|
| 2000 | 2010 | 2000-2010 | |
| Source: UNCTAD, countries available. Note: Data is not available for many large countries, including China, Japan, the United Kingdom and the United States. | |||
| Netherlands | 19.6 | 31.6 | 17.9 |
| Germany | 19.3 | 14.8 | 9.4 |
| India | 0.0 | 8.7 | - |
| Russian Federation | 0.0 | 6.4 | - |
| Brazil | 5.0 | 6.0 | 14.4 |
| Kazakhstan | 0.9 | 5.6 | 35.4 |
| Canada | 5.2 | 4.2 | 10.1 |
| Spain | 3.5 | 3.2 | 11.6 |
| Italy | 9.9 | 2.5 | -2.1 |
A different survey conducted annually by Engineering News-Record (ENR) magazine found that the European Union is the largest exporter of design services in 2011 followed by the U.S., Australia and Canada (see Table 3).Footnote 11 This survey is not directly comparable to United Nations data as it uses a different methodology.
| Country | Exports, US$ billion 2011 |
|---|---|
| Source: ENR Top 200 Design Firms. | |
| European Union | 24.1 |
| U.S. | 22.8 |
| Australia | 5.4 |
| Canada | 4.8 |
| China | 2.3 |
| Japan | 1.3 |
| Rest of world | 5.9 |
| Total | 65.3 |
3. Interview Results
This section presents the results of interviews conducted between March and May 2012 by the Conference Board of Canada.** Overall, 22 interviews were completed. Among the interviewees, 10 were with firms whose core business is engineering services and seven were with architectural firms. Firms were from eight provinces and territories, with a balanced mix of small, medium and large firms. Two interviews were done with key informants from the federal government and three from industry associations.
The engineering interviews were conducted with consulting engineering firms. Consulting engineering is a professional service that provides independent expertise in engineering, science and related areas to governments, industries, developers and construction firms.Footnote 12 As such, the views expressed in the interviews may not be representative of other types of engineering services.
The small sample size limits the ability to draw definite conclusions about the research questions (see Appendix B). Nonetheless, common themes were identified.
**The views do not reflect the opinion of the Conference Board of Canada, but rather those of the key informants interviewed.
3.1 Successful Business Strategies
Firm leaders interviewed had different approaches to business development, with different focal points and varying business philosophies. Some firms are very selective about their growth strategies, while others are trying to expand their reach into new geographic regions and areas of expertise. These broad business strategies are complemented by policies designed to effectively manage a firm's reputation and its employees. The success of a firm is critically dependent on the skills and knowledge of its workforce.
3.1.1 Growth Strategies
3.1.1.1 Niche Market versus Broad Service
Domestically, firms of all sizes are able to compete and thrive. Small and medium-sized firms are more likely to be specialised in a niche market. However, large firms can also focus on niches such as those specializing in oil and gas related projects in Alberta. Focusing on a niche can reduce the number of potential competitors a firm has. As well, interviewees reported that small firms can compete effectively by using their local knowledge (such as location specific logistical challenges) and offering more flexible and personalized service (such as working with a particular engineer). They are also able to compete with large firms in most types of projects, or at least on some steps of a project as only a limited number of engineers or architects are needed to execute the work.
Large firms are more likely to provide a broad range of services. Their advantage is that they can undertake very large projects, have larger clientele networks, bring a wide array of expertise and experience and are stronger financially. This is particularly important when bidding on projects with long durations and when undertaking international projects or public-private partnership projects. Similarly, with a combination of local branches and larger central offices, they can potentially provide a combination of local knowledge and specialized skills.
Internationally, firms interviewed reported that companies that do well either focus on a niche or provide a very broad range of services. Firms with an unfocused service offering are less successful. Also, smaller firms specializing in high level engineering are more likely to be successful than those specializing in basic engineering. High-level engineering refers to complex engineering that requires deeper use of highly sophisticated technologies, equipment or building techniques such as hospitals, water treatment facilities or "smart" buildings. Basic engineering refers to structures that are simpler in their design and building processes, such as a simple road or a warehouse. Firms specializing in basic engineering are more likely to face competition from emerging markets on basic services as Canadian labour costs are generally higher.
3.1.1.2 Mergers and Acquisitions versus Organic Growth
While organic growth (growth from a company's existing businesses) is considered preferable by many interviewees, it is often difficult to achieve because of the shortage of skilled workers. More engineering and architectural firms experienced organic growth in service provision and engineering services than through mergers and acquisitions in 2007-09.Footnote 13
Firms are also using mergers and acquisitions (M&A) to widen their geographic reach and broaden their areas of expertise. Neither of these motivations is more predominant than the other. M&A also facilitate access to larger projects, as customer perception is often that larger firms are better able to handle larger projects. In 2009, 14.5 percent of architectural and engineering firms reported being a subsidiary of another enterprise.Footnote 14 Companies that have merged or acquired firms in 21 the past have generally reported that they have successfully met their objectives with limited difficulties integrating systems or business cultures.
According to interviewees, the acquisition of architectural firms by engineering firms is increasingly common. This is particularly true for large companies, which generally have both services available so that they can offer a comprehensive service to their clients. Access to structural, mechanical and electrical engineering teams, combined with an architectural team allows firms to deliver integrated projects. While not a common practice, some have acquired or merged with non-engineering or non-architectural firms, to partner with another field of research, such as materials or equipment developers. The main reason cited was to obtain control of a new technology that had commercial potential for the engineering and architecture practice.
3.1.2 Key Growth Areas
Many sectors are identified as having strong potential in the coming years, including mineral, petroleum and energy projects (see section 2.1.1). While many respondents felt that Europe was generally a saturated market, opportunities in niche markets exist. For example, firms offering services related to clean technologies and the development of environmentally sustainable projects can compete effectively given heightened environmental concerns in many European countries.
Strong global demand, particularly from emerging markets, has pushed commodity prices up in recent years, which has subsequently increased interest in developing new mines and restarting shuttered ones around the world. As a result, demand for engineering services specializing in mining is strong. Developments are happening in regions rich in natural resources, such as Canada, South America and Africa.
In addition, interviewees felt that developing economies in Asia, South America and Africa present many opportunities. Economic and population growth are generally stronger in these countries than in developed countries. At the same time, these populations are becoming rapidly urbanized.Footnote 15 This results in growing demand for infrastructure development, such as power generation and transmission, water and sanitation systems, and transportation infrastructure. One study estimated that global infrastructure investment will top US$40 trillion between 2005 and 2030Footnote 16 (see Figure 16).
Figure 16: Infrastructure Investment by Region 2005-2030,Trillions of U.S. Dollars
Asia is expected to be the largest source of infrastructure spending

3.1.3 Managing a Firm's Reputation
3.1.3.1 Quality of Service
Firms identified maintaining client satisfaction through the provision of quality services as their first priority in managing a firm's reputation. Quality of service can be measured by: adhering to budgets and timelines, quality of design, consideration of all project elements, including the type of construction that best suits the needs of the client, construction costs, lifespan of a structure, and maintenance costs. Some interviewees suggested the best outcomes occur when architectural and engineering firms are involved at the earliest stages of a project when potential solutions to an identified problem are still being developed.
3.1.3.2 Business and Communication Skills
Other elements, such as business and communication skills, also improve the overall quality of a service. Business skills are critical to understanding how to run a firm successfully. They include how to maximize profits and revenues, perform proper cost evaluations and manage staff.
Communication skills are important for understanding the needs of the client, explaining projects to non-experts, and understanding and responding to business proposals.
According to some interviewees, the formal education that engineers receive in school is mostly oriented towards science and techniques required to do the work, but provides little support for non-technical skills. Many firms recognize the importance of those skills and will select their hires accordingly. Providing training for employees to develop these skills did not seem to be a common practice among the firms interviewed. The primary reason mentioned is concern that those employees will subsequently leave, which would result in a limited return on the investment. Considering the importance of non-technical skills, providing training could benefit firms in the form of better service provision and subsequently improved business development.
3.1.3.3 Developing client relationships
Client relationships are key as referrals and repeat business are a major part of how firms thrive and grow. Part of managing a firm's brand is being selective and disciplined when choosing clients. For example, stretching outside of a firm's core area of expertise to acquire a new client can be counter productive if that leads to a less than ideal project and dissatisfied customers. Bidding on projects with low expected profit margins can affect the firm's profitability and subsequently limit a firm's ability to make the needed investments in people and technology.
It is also important to ensure that firms are not dependent on a narrow client base. Thus, a specific client or type of clients should not account for an overly large share of a firm's revenues. This can be addressed by diversifying the number of clients a firm has, as well as where they are located and what type of industry they are in.
3.1.3.4 Selection of partners
Being highly selective when choosing supplier networks is also important. Most interviewees reported that they either return to trusted partners or rely on professional networks to find new partners when necessary. For smaller firms that provide niche services or firms operating in foreign markets, this means finding reliable partners that will not compromise the quality of service (see Section 3.2.2). Flexibility and adaptability in supplier networks are also important, as the nature of partnerships needed may change depending on the project.
3.1.4 Human Resources Strategies
Most interviewees reported that the industry is facing a labour shortage. As such, hiring the best workers is a challenge, and having a strategy to attract and retain workers is critical. Generally, firms that reported having fewer problems with attraction and retention are those that put employees as a focal point in their overall business strategies.
3.1.4.1 Hiring Talent
Firms are adopting different hiring strategies. While most interviewees preferred hiring experienced highly-skilled professionals, this segment of the workforce is the hardest to find. Experienced workers are also more likely to have non-work commitments such as family considerations that may make them less mobile.
In contrast, some firms have had success with hiring young professionals. They can be trained to fit a firm's business culture. However, many interviewees expressed some reluctance toward hiring young graduates as they are perceived to be costly (e.g. time to learn the business) and risky to hire (e.g. they often leave after a few years). In order to be successful with this approach, it is critical to make employees feel that they will have an opportunity to experience new challenges, to develop and to be promoted within a firm. Coaching and mentoring programs were also mentioned.
Interviewees reported that employee-owned companies have fewer problems retaining and attracting employees. It is believed that when employees own shares of the company, it fosters a "business mindset" among employees geared towards the importance of the client and the success of the firm creating a strong work ethic.
3.1.4.2 Retaining Talent
Interviewees mentioned making use of a variety of retention tactics. For example, firms may consider bidding on projects that suit the professional development of their employees thereby, creating opportunities for staff to develop and learn rather than doing repetitive work. Over 76 percent of architecture and engineering firms reported that they involve employees in decision making.Footnote 17 Investing in team building activities and social interaction and promoting a balanced lifestyle by limiting extra-hours were other techniques highlighted by firms.
Interviewees also mentioned programs for measuring employee satisfaction, such as staff committees or employee surveys. These tools can be used to gauge employee opinions on benefits, insurance plans, holidays or other issues. This type of initiative is a good way to improve retention, which can lead to better customer relations, better products, reduced recruitment costs and improved profitability over the long term.
3.1.5 Best Practices
Firms are either specializing and focusing on core areas of expertise, or using merger and acquisitions (M&A) as a strategic tool to drive growth. M&A provides a means to potentially differentiate a company from its competitors by broadening its suite of services or providing access to firm specific technologies and products.
Niche firms, on the other hand, are selective about the types of projects they undertake (e.g. focusing on areas of expertise), their customers, and/or the regions they operate in. For example, they may focus on key growth areas such as mining and energy projects.
Firms also differentiate themselves on the basis of their human resource strategies. As an industry employing a highly skilled workforce, these are a critical component of business strategies. Effective employee attraction and retention programs have been identified as a success factor for firms.
3.2 Strategies to Work Internationally
There are ample opportunities for Canadian firms to expand their activity in international markets with global infrastructure investment estimated at US$40 trillion between 2005 and 2030.Footnote 18 Firms interviewed raised two ways to export their services: establishing a permanent commercial presence to provide ongoing service in a particular country or region, or through temporary movement of professionals to carry out business activity abroad.
3.2.1 Permanent versus Non-Permanent Presence
Establishing permanent offices around the world is typical of large multinational firms, or medium-sized firms with one or a few international offices. Firms can establish a permanent presence in foreign markets, through subsidiaries, branch offices or strategic partnerships.Footnote 19 Having a foreign presence helps a firm to understand local differences, create a network of partners and suppliers, and access information on potential projects earlier, which gives the firm more time to prepare its proposals. A local presence can also help firms to navigate cultural differences. To work in Asia for example, China in particular, a relationship has to be established, and it may take two to three years before getting any contracts.
Some firms perform work outside of Canada, but do not establish a permanent presence in other countries. This approach is more common with smaller firms, because they likely do not have the resources needed to open and operate a foreign office. For example, one interviewee likened the experience of opening an office abroad to starting a brand new business.
When expanding internationally, some domestic clients, such as mining companies, hire the same engineers or architects with whom they have previously worked. Thus, it increases their confidence in undertaking foreign projects successfully and reduces the risks associated with using an unknown supplier. As a result, firms are unlikely to change their business strategy or service offerings while working abroad, as consistency is the reason they were hired in the first place.
3.2.2 Foreign Partners
Successful outcomes for international projects often require a good understanding of the cultural, political, environmental, societal and economic context, and access to a network of local partners and suppliers. Interviewees reported that their main technique for identifying potential foreign partners is to consult their professional networks for recommendations.
Firms can be successful internationally by partnering with local foreign firms. Working with local partners in a foreign country is beneficial in easing regulatory, language and cultural barriers. They also provide a better understanding of local regulations and building codes, and would generally already have the accreditations necessary to operate in a particular country. This eases the administrative burden for Canadian firms. Furthermore, it is often a requirement for firms to make use of local suppliers if they are awarded a project in a foreign country.
3.2.3 Use of Global Value Chains
Interviewees suggested that some firms in the industry may be making use of global value chains, but its use is limited. There are six phases in the value chain: conceptual design (pre-design); feasibility; engineering (design); procurement; construction and operations and maintenance.Footnote 20 Firms prefer to do as much as possible in-house, rather than outsource. Only 9 percent of architectural and engineering services are outsourced either in or outside of Canada.Footnote 21
The limited use of global value chains may be attributed to the regulatory differences across countries related to building codes, credentials recognition and other regulations for instance. One of the main reasons why firms use local partners on foreign projects is to overcome these barriers.
There is some sharing of work between branches of a firm in order to manage work flows or make use of expertise in a particular office. It is not common for this work to be shared across borders. However, when it does occur, it tends to remain in the same region as the client (e.g., North America). Just over 20 percent of architectural and engineering services are performed within the firm outside of Canada.Footnote 22
On the other hand, large multinational firms are making use of global value chains by having teams cooperate around the world on a single project allowing them to deliver faster and provide around the clock services. Firms also use value chains for the construction phase of a project as it is generally subcontracted to other firms. For example, Canadian engineering firms generally partner with foreign construction firms, Chinese firms in particular, when conducting international work. Also, architectural firms outsource portions of the design process for large international building projects.Footnote23
3.2.4 The Canadian Advantage
Canadian engineering firms generally have considerable expertise and experience with natural resource related projects. Canada is a major global producer of a variety of resource based products including metals, energy, agriculture and forestry. Canadian engineering firms have designed the infrastructure necessary to produce and transport these products. As such, they are well positioned to benefit from the development of natural resource based projects around the world.
Key competitive advantages for Canadian firms when operating internationally are the quality of their work and the capacity to manage large projects. This is the result of a strong education system in Canada, which trains world-class engineers and architects. Canadian engineers and architects are perceived as being highly efficient, providing quality work and being good business partners by the international community. One of Canada's advantages is its multicultural workforce (see Figure 17). The foreign knowledge and experience of critical employees can reduce language and cultural barriers, and has actually led to the establishment of international offices for some Canadian firms. For example, a Canadian firm may have a highly skilled and experienced employee of Indian origin who would like to return to India. A firm may use this as an opportunity to retain an employee while simultaneously establishing a new office. This allows the firm to gain a local presence in a foreign country, creating new business opportunities while reducing the travel requirements for Canadian-based employees.
Figure 17: Share of Labour Force of Architectural, Engineering and Related Services, in Percentage
The industry has a multicultural workforce

The ability for some Canadian firms to work in French is also an important advantage in many countries, particularly Africa, where French is often an official language. Having the capacity to serve clients in their own language is an asset, as it helps to create trust and reduces communication barriers.
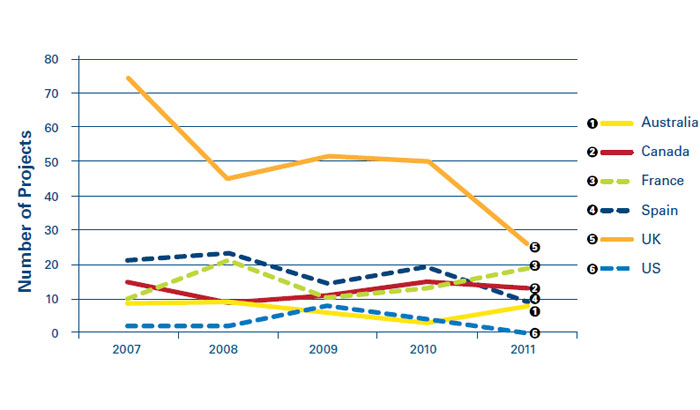
Finally, Canada has a well developed public-private partnership (P3) structure. A number of Canadian engineering firms have experience in P3 projects providing them with a comparative advantage. Many projects have been completed in Canada under the P3 model; in fact, Canada consistently ranks in the top five globally in terms of the number of P3 projects completed (see Figure 18). With most countries facing an environment of fiscal restraint, finding new ways of financing projects will be necessary going forward and P3s may become more common as a result. While P3s add more risk for companies due to the need for private financing, they also generally give firms more control and greater potential returns on their work. Footnote 24 For example, firms can potentially generate revenues over the entire lifespan of an infrastructure project through maintenance fees.
Figure 18: Number of P3 Projects Reaching Financial Close, Select Countries
Canada is a significant user of P3 projects
3.2.5 Best Practices
When it comes to finding international work, engineering and architecture firms have been most successful when leveraging their domestic strengths. Identified areas of competitive strength for Canadian firms include experience with P3 projects and expertise in the extraction and development of natural resources. Adapting specialized knowledge, such as how to effectively work in remote locations with unique logistical challenges, or producing designs that accommodate extreme environmental conditions can also provide an advantage when seeking contracts.
Canadian engineering firms also have recognized expertise in highly complex and technology intensive engineering projects internationally. As well, Canadian architecture firms have recognized expertise in advanced building technologies and designs and can differentiate themselves by focusing on those areas. This makes best use of Canadian expertise, while limiting the degree of competition on price, since clients may be less price-sensitive when it comes to these types ofprojects.
Understanding and overcoming various barriers, such as language, cultural and regulatory differences are critical to a firm's success when undertaking foreign activity. Working outside of Canada is easier for firms that maintain an ongoing presence abroad, even during slower periods. This provides advantages in terms of market intelligence and establishing networks of suppliers and partners. Alternatively, Canadian firms may operate in a foreign market remotely by establishing effective local partnerships. Taking advantage of a firm's multicultural workforce as well as making use of Canadian employees with foreign backgrounds can assist in this process. Another important strategy is to use available supports, such as trade commissioners and Export Development Canada (see 3.3.3.5).
Firms could potentially breakdown projects into their component parts and distribute them amongst domestic and/or international offices and partners using global value chains. This means performing each stage of a project in the country or region where it can be done most efficiently. There is limited evidence that architecture and engineering firms are doing this atpresent, but other professional services have begun to make use of such strategies. For example, the accounting industry uses offices in India to do basic bookkeeping work, while many software engineering companies outsource portions of programming to China.
3.3 Barriers to Growth
Firms identified several barriers to growth that have an impact on their domestic and international business activities.These include the public procurement process and labour constraints amongst others. Another significant barrier is the lingering effects from the economic recession of 2008-09. Firms drastically reduced their investment during the recession and it has been slow to recover.
3.3.1 Public Procurement Process
The public sector procurement process for all levels of government was identified as a barrier to growth by interviewees because of the way procurement is done for public sector projects in Canada. While many technical factors are considered during the evaluation of proposals for engineering and architectural services, price becomes the distinguishing factor where multiple bidders meet all of the requirements. Thus, the firm selection process is geared towards the lowest price. In addition, not all public agencies have the technical expertise to assess best value.
Furthermore, the quality of engineering services is not directly comparable across firms, but they are being treated as though they were. Engineering firms referred to this trend as the "commoditization of engineering services." However, engineering services are more complex and quality can vary largely across firms with similar price points.
Price based selection acts as an innovation deterrent for the industry, as firms have little incentive to propose innovative solutions, according to interviewees. They reported reducing the number of options evaluated that could significantly extend the life of a project and/or reduce its construction and maintenance costs. This is important when one considers that engineering design generally represents 1 to 2 percent of the project lifecycle cost, but has a large impact on the overall construction and maintenance costs.Footnote 25
Lastly, interviewees reported that some public entities, such as colleges, schools, universities and municipalities, are increasing their procurement requirements. For example, smaller jobs may have onerous requirements and, as a result, the time being spent on preparing proposals is becoming longer. Previously, those projects would have been awarded with an off-the-shelf portfolio and a cover letter.
3.3.1.1 Contract Clauses
Some interviewees mentioned observing stricter contract language that places an excessive amount of liability on the firm rather than the client, to the point where, in some cases, the interviewees' insurers will not cover them. One interviewee suggested that large firms likely have lawyers to flag such clauses and re-negotiate contracts, but small and medium-sized firms may have more limited resources. About 55 percent of architectural and engineering firms do not have either in-house or outsourced legal services.Footnote 26
Intellectual property clauses were also an issue for some interviewees, particularly where the firm does not retain any copyright. For example, some contracts include clauses such as "all drawings and specifications that are prepared for the project are the sole property of the client". This was deemed to be inappropriate by some interviewees as the client can own the outcome, but not the idea. Interviewees suggested that these types of clauses tend to reduce design innovation because firms are not able to fully benefit from the proceeds of their innovations.
3.3.2 Labour Constraints
One of the most significant barriers to growth is the limited availability of experienced, highly-skilled engineers. Most engineering firms interviewed indicated that there is a labour shortage in the industry in Canada. Several reported that their firms have had to turn down contracts because they did not have the capacity to do the work without hiring more employees, which they cannot find. Interviewees suggested that labour shortages for architects are less of a concern. According to architectural firms interviewed, the economic downturn in the U.S., which was more severe and longer lasting than in Canada, left many skilled architects out of work. This has been a benefit for Canadian architectural firms looking for skilled and experienced people to fill positions in recent years.
The tight labour market conditions have also contributed to retention issues. Some interviewees reported that employees have many choices of where to work and tend to change jobs frequently. This seems to be most common with the new generation of engineers, who prefer not to stay with the same company for as long as their predecessors. This trend contributes to the belief that hiring and training young professionals are costly and risky.
Firms in remote communities also have trouble finding employees, but have fewer problems with retention. Within Canada, engineering demand in some provinces is experiencing stronger growth than in others, which would also affect the relative tightness of the engineering labour market. Interviewees from Alberta and Saskatchewan seemed more concerned with labour supply than others. Respondents in Atlantic Canada also found it hard to find workers, but seemed to have fewer problems with retention. A potential reason identified by interviewees was that employees who live in Atlantic Canada are usually from the region and are not necessarily interested in moving away.
3.3.3 Barriers for Working Internationally
3.3.3.1 Capacity Constraints
Interviewees noted that the labour shortages in Canada have been affecting both the industry's interest and ability to work internationally. Some reported that finding workers willing to move abroad is a challenge. While less experienced employees are most willing to move, clients prefer more experienced professionals involved in a project. While it is easier to travel than relocate, it is more difficult to develop client relationships.
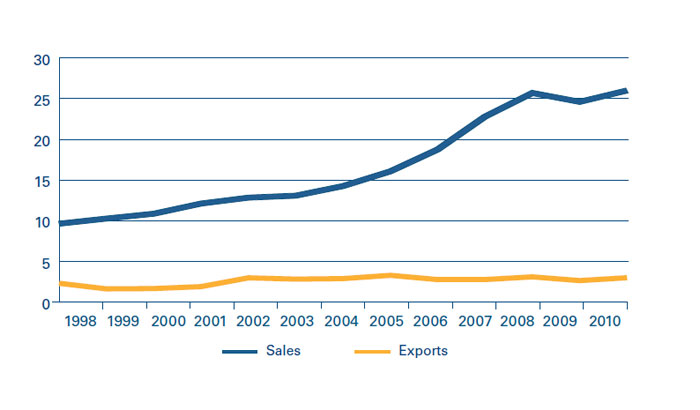
Furthermore, Canadian companies have been less focused on expanding in international markets due to the strong domestic market and the easily accessible U.S. market. Export data for the industry show that exports have not risen significantly since 2005Footnote 27 (see Figure 19). This has been a great benefit over the decades, but it also makes Canadian firms somewhat less apt to seek international business. Now that the economic stimulus spending is tailing off, firms are trying to reengage in the international market, but it will take time.
Figure 19: Sales and Exports, Billions of Dollars
Export growth has not kept up with domestic sales
3.3.3.2 Protectionism
Because of the recent global economic downturn, some countries have used protectionism as a way to shield their domestic economies. For example, although the Buy American Act does not apply to engineering and architectural services specifically, it does make it difficult for Canadian firms to be suppliers for public contracts in the U.S. It is very likely they will need to have a significant technological or cost advantage over U.S. based firms to succeed in obtaining contracts in the U.S.Footnote 28
Other forms of protectionism were reported by interviewees. For example, the BRIC countries (Brazil, Russia, India and China) have a growing demand for infrastructure development and help each other with new projects, to the exclusion of firms from developed countries. Thus, Canadian firms may have difficulty accessing these markets.
There may even be some protectionist sentiment within Canada. For example, interviewees reported that Saskatchewan and Alberta in particular can be difficult markets to penetrate if you are not seen as a resident. As a result, firms looking to conduct work in different regions of the country often need to either open local offices in those regions and/or develop effective local partnerships.
3.3.3.3 Fiscal Rules and Transparency
Some interviewees reported issues related to unclear tax policies and a lack of transparency while working in foreign countries. For example, although firms had researched and planned ahead, they have encountered unexpected problems. This adds risk and uncertainty around projects in countries where a firm has not worked before. Obtaining permits can also be confusing in some countries. Finding good local partners is key to overcoming these problems.
3.3.3.4 International Development Investment
Some interviewees reported that the lack of Canadian International Development Agency (CIDA) financing of infrastructure development abroad has resulted in their international business development activities becoming more costly and less successful. CIDA's Industrial Co-Operation Program provided support for up to 75 percent of the cost of undertaking feasibility studies related to infrastructure and industrial development.Footnote 29 As such, firms were able to establish a client base and a network of partners and suppliers abroad and maintain their business even after the CIDA project that brought them to a particular country had ended. However, CIDA has gradually reduced its funding for the Program and has shifted its focus from infrastructure towards other types of international aid.Footnote 30
Firms also reported that they have had limited success winning contracts from international financial institutions. The change in CIDA funding may have reduced engineering firms' ability to win foreign infrastructure contracts since Canadian firms now have less experience with these types of projects.
3.3.3.5 Underuse of Trade Commissioners and Export Development Canada
Interviewees reported making limited use of government services such as trade commissioners. Foreign Affairs and International Trade Canada has a network of trade commissioners that can provide early intelligence, i.e., pro-active information on upcoming projects before they are publicly announced which is considered crucial to be competitive. This gives firms more time to prepare proposals. Trade commissioners are also capable of identifying qualified business partners and suppliers for Canadian firms, and providing support regarding local laws, taxes, permits and other legal issues.
Export Development Canada also has programs that can help firms abroad. These include loans for developing business or purchasing firms abroad, and guarantees and other insurance to mitigate the risk of working overseas. Only 3.8 percent of architectural and engineering firms made use of government export incentives and services in 2009.Footnote 31 However, those that do make use of government assistance programs generally report effective results.
3.3.4 Value of Design
According to several architectural firms interviewed, some clients do not understand the value of good design. As a result, they seek the cheapest solution possible and not necessarily the best design. However, clients that are more knowledgeable of the value of their services are more inclined to pay for high quality design.
3.3.5 Best Practices
Companies are successfully adapting to the challenges posed by the public procurement process by using cost-control strategies. These include choosing the most appropriate staff for each task, and making use of technicians and other professionals who support engineers and architects at a lower cost. As well, making use of employees who are experienced at writing proposals, while using pre-established templates and techniques, may save valuable time.
Interviewees identified public procurement process alternatives. The preferred option is qualification based selection (QBS) whereby governments select firms based on their competency, qualifications and experience, not price. For example, the three best proposals are identified and the public entity enters into negotiations with the best firm until a reasonable agreement is reached. If the two parties do not agree, it can proceed with the second choice and then the third, if necessary, until an agreement is reached.
The QBS approach is preferable for interviewees because it involves a post award negotiation where the client and the firm can discuss options and costs of all elements of a project. It allows the firm to propose alternative approaches, and the client to make more informed decisions. The United States has made QBS mandatory for its federal public infrastructure work since the Brooks Act was passed in 1972. Quebec also began using QBS for provincial procurement in 2008.
The second option that governments can use in the procurement process is to request proposals from firms for periods of time rather than specific projects. In this case, the public entity creates a pool of pre-selected firms from which it can pull the most suitable one as projects arise. The terms and scope of the project are then negotiated between the firm and the client. This method was a preferred option by many interviewees who have experience with this model because firms are chosen based on their qualifications. It also leads to a better understanding of clients' needs and the consideration of unconventional solutions. It can also help firms do more long term planning, since they may have a better understanding of workflows over the period of the contract.
Working with various levels of government to find mutually beneficial solutions to the procurement process is another strategy. For example, the Federal/Industry Real Property Advisory Council includes many federal departments and representatives of the engineering, architecture and construction industries. It meets several times a year to discuss strategies regarding procurement, security, insurance, sustainability, joint project works and government structuring with respect to real property services.
In response to labour shortages in Canada, many firms have successfully hired professionals from other countries. Skills recognition and other regulatory obstacles were fairly easy to overcome. This process is facilitated by the education-based international mutual recognition agreements that Canada has in place with a number of countries.Footnote 32
3.4 Technology and Innovation
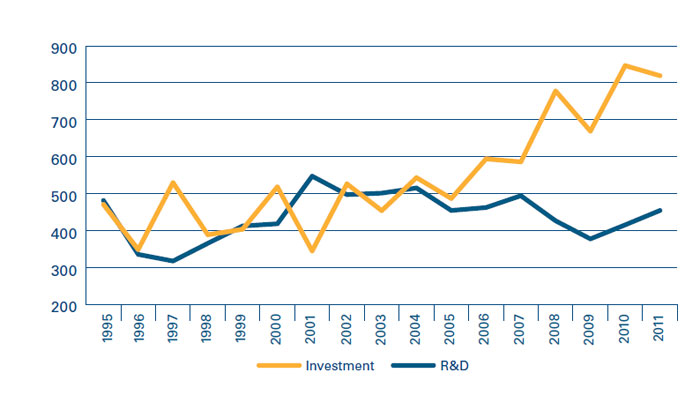
Technology and innovation are an important part of the engineering and architecture industry, particularly in facilitating international work.Footnote 33 In 2011, the industry spent $454 million on research and development (R&D) and invested $704 million in new machinery and equipmentFootnote 34 (see Figure 20). While these are high relative to revenues for a services industry, it is important to note that the ratio of R&D to revenues has steadily declined over time. Despite the strong growth in sales the industry experienced since 2000, nominal expenditures on R&D have not changed significantly over the past decade. Technology can be a source of competitive advantage for firms, as firms that are innovators are more likely to be exporters.Footnote 35
Figure 20: Industry R&D and Investment Expenditures, Millions of Dollars
Architectural, engineering and related services R&D expenditures have remained constant over the past decade
Interviewees identified three ways in which technology is used by engineering and architecture firms. First, there is the technology used in the provision of services such as design software and measuring instruments. Second, there is the technology related to the products used to build their designs. This includes smart buildings, environmentally friendly technologies and innovations in material science. Finally, there are the communication and other office technologies, which include various tools such as File Transfer Protocol (FTP) networks, email archiving and management, that are used by companies to facilitate the delivery of projects and manage workflows.
3.4.1 Technology Related to Service Provision
There are a variety of technologies that are widely used across the industry when designing projects. For example, Building Information Modeling (BIM) involves generating and managing a digital representation of the physical and functional characteristics of a building. It becomes a shared resource supporting the decision-making about a facility from conception, to design, construction and operation. According to a survey conducted by the Institute for BIM in Canada, the benefits of BIM are better end products, enhancing productivity, providing a competitive advantage, and improving documentation.Footnote 36 However, interviewees suggested that it is expensive to acquire and the software changes every year. The need for upgrades can make it difficult for small and medium-sized companies to use BIM.
When it comes to using technology in design, the majority of interviewees referred to the "leading edge" versus the "bleeding edge". Most firms aim to be at the leading edge, making use of the most current proven technologies. The bleeding edge is a more risky strategy whereby firms use unproven technologies that may have significant flaws, may not yet have an established market, or may make clients nervous. While firms may benefit from being early adopters of technology, these technologies may be costly, ineffective and produce sub-par results.
While most firms use or adapt existing off-the-shelf technologies, some develop their own technologies. In 2009, 71.6 percent of architectural and engineering firms reported using off the shelf technologies, while 30.6 percent undertook some in-house development of software.Footnote 37 Firm size is not a determining factor in developing technology. Some smaller firms invest in developing their own tools as a way to differentiate themselves and offer a customised service. For example, one interviewee had acquired a patented technology that only his firm can offer.
3.4.2 Technology and Innovation in Products
Both engineering and architectural firms need to keep up to date with the materials and techniques used to build the products they design, as these are constantly undergoing innovation and change. Construction technology has changed considerably in the last 40 years. Examples include smart buildings (structures that indicate when they are under stress or require maintenance) and Leadership in Energy and Environmental Design (LEED) certified buildings which rates buildings on the basis of site sustainability, water efficiency, energy and atmosphere, materials and resources, and indoor environment quality. Specialized knowledge regarding the installation of advanced machinery specific to the needs of a particular client and knowledge of how the availability and characteristics of different materials are changing over time are other examples.
Understanding new construction techniques is extremely important for architectural firms both in Canada and abroad because they are ultimately held responsible for the structure. As a result, keeping up to date with technology is time consuming. As a way to overcome this challenge, firms interviewed hired more technicians to support architects in their practice.
One interviewee noted that Canada is perceived as a world leader in building and infrastructure techniques and technologies due to the National Research Council's Institute for Research in Construction. The Institute helps to remove uncertainties and financial risks in the development and use of new technologies. It is helpful for architects to understand and test new technology, such as digital design and nano-technologies, to enable their safe and efficient use in projects.
3.4.3 Technology Related to Communication
Communication technology has not only created new ways of sharing information and delivering products, it has also affected how the industry is organized. For example, the trend towards larger firms is being heavily supported by improved communication technology making it possible and cost-effective to share knowledge and cooperate on projects at a distance. This means different offices with different skills can make use of each other's expertise making it unnecessary for firms to have experts in every field in every office.
Technology can be used to strategically manage workflows, maximize the use of employees, minimize regional fluctuations effects and make long term planning easier. Firms can also use technology to track projects and staff expertise, match available staff with needed expertise across offices and in some cases across geographic boundaries. For example, a firm can use other offices that are less busy instead of expanding its operations to accommodate a large one-time project. It also makes it easier to retain employees in a specific regional office, avoiding layoffs during quiet periods.
Technology has also allowed large multinational firms to offer around the clock services. Large projects can be delivered faster as teams from around the world cooperate on a single project to deliver the results as quickly as possible. However, this ability is generally restricted to large multinationals with offices in multiple regions of the world.
Another technological change mentioned by many interviewees was the growing importance of emails in their communication and how it is affecting their practice. This creates the need for better software to classify, control and archive files. As a result, engineering firms have had to rethink their communication protocols.
3.4.4 Best Practices
To stay competitive, firms need to make use of the latest technologies. These include the technology and materials used to deliver on a project (e.g., using 3D modeling). As a result, some firms have developed or acquired unique technologies as a means to differentiate themselves from their competitors. At the same time, it is important to find a balance between adopting new technology and using proven technology.
Using highly sophisticated and constantly changing software effectively can be a challenge. Providing ongoing training and allocating time for employees to learn new software is necessary to take full advantage of these tools. Also, new graduates, who are generally trained on the latest software, can bring this knowledge to an organization. While they may not yet be able to fully contribute on all of the aspects of a project due to their inexperience, firms can still benefit from an exchange of knowledge.
Despite the risks, some firms do perform in-house R&D to explore and test new materials and techniques. Firms interviewed that undertake R&D activity specified that it is important to make time in employee schedules (e.g., about 20 percent of staff's time) to explore ideas and think about innovative alternatives. This provides a balance between delivering projects profitably and devoting sufficient time to innovation. Having dedicated staff and funds for R&D can provide firms with a competitive advantage if it leads to the commercialization of a product or service. Strategically focusing any R&D efforts to complement the existing services of the firm and target the clients' needs is the best way to generate results.
While not all firms have the financial capacity to support an R&D department, smaller firms can work with academia to find opportunities for developing innovative techniques or products. For example, universities can provide joint research opportunities with computer scientists, physicists, chemists or other researchers that can help to develop concrete solutions for engineers and architects without requiring firms to hire such experts. Colleges also increasingly offer opportunities for applied research initiatives.Footnote 38
Because technologies change quickly, firms often don't have time to test or see how products and materials react over the lifespan of a project before making use of them. One way that firms can propose new solutions and materials to clients without putting the firm at risk financially is to use appropriate contract language that mitigates or discharges responsibility in the event of a malfunction. According to interviewees, some clients were willing to accept some risk and try new technologies with this approach while others were not interested. In order to maintain client trust, it is very important to provide objective information.
As firms expand and have more employees with varying types of expertise, it becomes increasingly difficult for staff to remain informed as to the breadth of its resources and capabilities. As such, innovative firms are developing tools such as internal network portals that centralize and standardize information for staff. With these tools, staff can easily access project lists, identify internal experts in particular fields, marketing information, standardized forms and proposal templates, and other information. This reduces the unnecessary duplication of work and makes it easier to identify available internal resources for a project.
Managing shared work between various locations and teams in different time zones requires firms to provide the appropriate communication and planning tools. The files shared are often extremely large and there are risks associated with losses during transfers, file corruptions, network breaches and multiplicity of files. Firms also need to ensure that offices sharing information have compatible information technology systems and software. Having a firm wide strategy for developing information technology infrastructure and the standardization of equipment across all regions is a best practice that can make the difference between a firm that uses its global capacities efficiently and one that is operating under its potential.
4. Final Remarks
Opportunities for growth for Canada's engineering and architectural industry remain. On the domestic front, energy and mining related projects are key sources of growth, while strong demand in emerging markets represents export opportunities. Future global infrastructure investment is estimated at US$40 trillion between 2005 and 2030.
In terms of trade, Canada's exports of engineering and architectural services have not changed significantly in recent years. Furthermore, its share of global trade has been shrinking. This is due primarily to domestic labour constraints and economic weakness in the U.S., Canada's largest export market. A variety of other barriers such as language, cultural and regulatory barriers and capacity constraints were also identified as limiting growth.
The industry is facing a labour shortage, particularly experienced engineers. Firms are adapting to this challenge through consolidation. Others are turning to foreign markets to hire the people they need, or choosing a niche strategy by being more selective about the projects that they are taking on. It also means that given the importance of labour as a key input for the industry, employee attraction and retention strategies have become an integral part of firms' business strategies. For policymakers, strategies that would increase the supply of available engineers are something to consider.
Finally, technology and innovation remain an important part of the industry and provide a source of competitive advantage. Firms that innovate are more likely to be exporters.Footnote 39 However, the industry is becoming less R&D intensive over time as it moves towards adapting existing technologies rather than creating new ones.
Appendix A: Participating Organizations
A total of 22 organizations participated in the interviews. Please note that this list does not include organizations that asked not to be identified.
- Arcop
- Associated Engineering
- Association of Consulting Engineering Companies
- Cannon Design
- CBCL Limited
- Collings Johnston Inc.
- ENGCOMP
- Engineers Canada
- Exp Services
- Export Development Canada
- Foreign Affairs and International Trade Canada
- IBI Group
- McElhanney Consulting Services Ltd.
- Number TEN Architectural Group
- Royal Architectural Institute of Canada
- SNC-Lavalin
- URS Canada
- Watson MacEwen Teramura Architects
- Williams Engineering Canada
Appendix B: Interview Guide
Successful Strategies
- 1.1 What successful business models or strategies has your firm employed in Canada?
- 1.2 What would you say are your key competitive advantages? Versus domestic competitors? Versus foreign competitors?
- 1.3 Does your firm conduct any business abroad, why or why not?
- 1.4 If so how do you apply your strategies outside of Canada?
Integration into Value Chains
- 2.1 What types of activities does your firm do best and why? (e.g. advisory/pre-design, design, construction, post-construction)? Does this vary domestically versus abroad, if so why?
- 2.2 What role does your firm play in a project (e.g. owner engineer, compliance, feasibility, tendering and selection)? Does this vary domestically versus abroad, if so why?
- 2.3 What types of activities would you say Canadian firms are global leaders in? In your opinion how did we become global leaders?
- 2.4 What key trends do you see occurring in how Canadian architectural and engineering firms integrate themselves with their suppliers and customers both domestically and abroad?
- 2.5 Do you involve Canadian suppliers currently when conducting work outside of Canada? If not, why not?
- 2.6 How can we expand the role of Canadian suppliers in work conducted elsewhere?
Barriers to Growth
- 3.1 What are the major barriers to growth that your firm faces in the domestic market? How do you overcome these barriers?
- 3.2 What are the major barriers to growth that your firm faces in foreign markets? How do you overcome these barriers?
Technology and Innovation
- 4.1 Is technology a critical factor driving your success?
- 4.2 How is technology being used by your firm (e.g. improve operations/efficiencies, customer management, service delivery, etc.)?
- 4.3 Are you adopting best-in-class/best practice technology (or developing unique technology to your firm)? If not, why not? (e.g. capital, knowledge) If so, what are the best practice technologies that your firm is adopting (e.g. Building Information Modelling)?
- 4.4 Are there other important non-technology based innovations that your business is making use of?
Additional Thoughts
Are there any other thoughts you would like to share with us, or other sources of information you think we should reference?
References
Footnotes
- Footnote 1
The NAICS system is used by statistical agencies in Canada, the United States and Mexico to describe economic and business activity at the industry level. Data is generally collected at the establishment level with an establishment being assigned to a specific industry based on its primary activity.
- Footnote 2
Canada. Statistics Canada. Catalogue no. 63-245-X and 63-258-X.
- Footnote 3
Ibid., derived from CANSIM table 031-0002.
- Footnote 4
Ibid., derived from CANSIM table 330-0007.
- Footnote 5
Based on special tabulations of Statistics Canada's Labour Force Survey data.
- Footnote 6
The Conference Board of Canada, Compensation Planning Outlook 2011: Playing it Safe in the
Face of an Uncertain Economic Recovery, October 2010.- Footnote 7
Respondents were presented a list of selected specializations but can add specifics if needed, architecture was not among the pre-defined choices and was not specifically identified by respondents.
- Footnote 8
Canada. Statistics Canada. Derived from CANSIM tables 031-0003 and 030-0002.
- Footnote 9
Industry Canada, Foreign Affairs and International Trade Canada and Statistics Canada, Survey of Innovation and Business Strategy, 2009.
- Footnote 10
Canada. Statistics Canada. Derived from CANSIM table 376-0033.
- Footnote 11
ENR Engineering News-Record, The Top 200 International Design Firms, July 23, 2012, pp. 27-48.
- Footnote 12
Association of Consulting Engineering Companies. http://www.engineeringlegacies.com/WhatIs.php
- Footnote 13
Industry Canada, Foreign Affairs and International Trade Canada and Statistics Canada, Survey of Innovation and Business Strategy, 2009.
- Footnote 14
Ibid.
- Footnote 15
United Nations Population Fund. The State of World Population 2011.
- Footnote 16
Viren Doshi, Gary Schulman and Daniel Gabaldon, Lights! Water! Motion!, July 2007.
- Footnote 17
Industry Canada, Foreign Affairs and International Trade Canada and Statistics Canada, Survey of Innovation and Business Strategy, 2009.
- Footnote 18
Viren Doshi, Gary Schulman and Daniel Gabaldon, Lights! Water! Motion!, July 2007.
- Footnote 19
World Trade Organization Council for Trade in Services, Engineering Services: Background Note by the Secretariat, February 22, 2011.
- Footnote 20
Karina Fernandez-Stark, Penny Bamber and Gary Gereffi, Engineering Services in the America, Centre on Globalization, Governance & Competitiveness, Duke University, 2010.
- Footnote 21
Industry Canada, Foreign Affairs and International Trade Canada and Statistics Canada, Survey of Innovation and Business Strategy, 2009.
- Footnote 22
Ibid.
- Footnote 23
World Trade Organization Council for Trade in Services, Architectural Services: Background Note by the Secretariat, September 17, 2009.
- Footnote 24
For a discussion of the pros and cons of public-private partnerships see: Mario Iacobacci, Dispelling the Myths: A Pan-Canadian Assessment of Public-Private Partnerships for Infrastructure Investments, 2010. http://www.conferenceboard.ca/e-Library/abstract.aspx?did=3431
- Footnote 25
Federation of Canadian Municipalities and National Research Council. InfraGuide: Selecting a Professional Consultant, 2006. http://www.fcm.ca/Documents/reports/Infraguide/Selecting_a_Professional_Consultant_EN.pdf
- Footnote 26
Industry Canada, Foreign Affairs and International Trade Canada and Statistics Canada, Survey of Innovation and Business Strategy, 2009.
- Footnote 27
Canada. Statistics Canada. Derived CANSIM table 376-0033.
- Footnote 28
For a discussion of the implications of the Buy American Act, see: Buy American Act and Construction Projects
- Footnote 29
Canadian International Development Agency. Executive Report on the Evaluation ofthe CIDA Industrial Cooperation (CIDA-INC) Program. December 2007, p. 9. www.acdi-cida.gc.ca/inet/images.nsf/vLUImages/Evaluations/$file/INC_ExecutiveReport-E.pdf
- Footnote 30
Canadian International Development Agency. Infrastructure Services Performance Review:Executive Report. 2001. p. 6. www.acdi-cida.gc.ca/inet/images.nsf/vLUImages/Performancereview5/$file/Infra_Engl.pdf
- Footnote 31
Industry Canada, Foreign Affairs and International Trade Canada and Statistics Canada, Surveyof Innovation and Business Strategy, 2009.
- Footnote 32
See Engineers Canada. http://engineerscanada.ca/
- Footnote 33
OECD. Sixth Services Experts Meeting-Domestic Regulation and Trade in Professional Services. Architectural Services in Global Trade in Professional Services. February 15-16, 2007. www.oecd.org/site/tadstri/40778733.pdf
- Footnote 34
Canada, Statistics Canada. Derived from CANSIM tables 358-0024 and 031-0002.
- Footnote 35
Prism Economics and Analysis, Engineering and Technology Labour Market Study: Canada'sConsulting Engineering Sector in the International Economy, March 2009.
- Footnote 36
Institute for BIM in Canada, BIM Survey 2011, 2011.
- Footnote 37
Industry Canada, Foreign Affairs and International Trade Canada and Statistics Canada, Survey of Innovation and Business Strategy, 2009.
- Footnote 38
The Conference Board of Canada. Innovation Catalysts and Accelerators: The Impact of Ontario Colleges' Applied Research. 2010. http://www.conferenceboard.ca/e-Library/abstract.aspx?DID=3904
- Footnote 39
Prism Economics and Analysis, Engineering and Technology Labour Market Study: Canada's Consulting Engineering Sector in the International Economy, March 2009.
Permission to reproduce:
Non-commercial Reproduction
Except as otherwise specifically noted, the information in this publication may be reproduced, in part or in whole and by any means, without charge or further permission from Industry Canada, provided that due diligence is exercised in ensuring the accuracy of the information reproduced; that Industry Canada is identified as the source institution; and that the reproduction is not represented as an official version of the information reproduced, nor as having been made in affiliation with, or with the endorsement of Industry Canada.
Commercial reproduction
For permission to reproduce the information in this publication for commercial purposes,
please contact the:
Web Services Centre
Industry Canada
C.D. Howe Building
235 Queen Street
Ottawa, Ontario Canada
K1A 0H5
Telephone (toll-free in Canada): 1-800-328-6189
Telephone (Ottawa): 613-954-5031
Fax: 613-954-2340
TTY (for hearing-impaired): 1-866-694-8389
Business hours: 8:30 a.m. to 5:00 p.m. (Eastern Time)
Email: ic.info-info.ic@canada.ca
© Her Majesty the Queen in Right of Canada,
represented by the Minister of Industry, March 2013
Cat. No.: Iu44-91/2013E-PDF
ISBN: 978-1-100-21619-5
This document was prepared for Industry Canada by The Conference Board of Canada. Opinionsand statements in the publication attributed to named authors do not necessarily reflect the policyof Industry Canada or the Government of Canada.
Aussi offert en français sous le titre Pratiques exemplaires adoptées par les firmes d’ingénierie et d’architecture