
PDF version
State of Canada's Defence Industry 2022
1.06 mb, 42 pages
Objective: Develop relevant, quality and timely strategic information on Canadian production of defence goods and services to brief policy and industry decision makers
- Canada is the first among OECD1 countries to conduct an in-depth Government Statistical Agency survey on defence industry capabilities
- Supported by a multi-year collaborative analytics agreement between ISED and the Canadian Association of Defence and Security Industries (CADSI)

- This analysis presents a statistical overview of Canadian defence industry activities in 2020, based on the most recent data available
- As such, these findings provide insights into the state of Canada’s defence industry during the first year of the COVID-19 pandemic
- The next iteration of the biennial survey will measure 2022 industrial activities
- Publication of the basic 2022 data by Statistics Canada is currently scheduled for early 2024
1 OECD is the Organisation for Economic Co-operation and Development
Project Framework
Survey Refinement & Preparations (May 2020 – February 2021):
- Consultation with industry, subject matter experts, defence and public security organizations, and policy makers on the research framework and updating the targeted population and questionnaire
Data Development (March 2021 January 2022):
- ISED sponsored Statistics Canada biennial survey measuring 2020 activities (first year of Covid-19) with completion a legal requirement under the Statistics Act
- Previous data collection efforts measured 2014, 2016 and 2018 with their findings summarised under previous reports
- The next round of data collection will measure 2022 industrial activities
- Data quality validation and firm-level imputation based on administrative and other data
Data Analysis (February 2022 – May 2022):
- Data analytics and report structure development
- Economic impact estimation based on a methodology informed by experts at the OECD and Statistics Canada
Canada’s defence industry outperformed the broader manufacturing sector across industrial indicators between 2018-20202
Figure 1: Performance of Key Variables, the Canadian Defence Industry vs. the Broader Manufacturing Sector, % Change, 2018-20202

2 Financial values are in nominal terms and are not adjusted for inflation, and R&D spending relates to defence industry businesses’ in-house R&D. See annex for 2014 to 2020 data and changes over time
Source: Statistics Canada’s Canadian Defence, Aerospace, Marine and Cybersecurity Industries Survey (2018, 2020), 2020 survey released in 2022; Statistics Canada export data accessed through “Trade Data Online”; and Statistics Canada’s online tables: 27-10-0333-01 (released in 2021)14-10-0202-01, 16-10-0047-01 (both released in 2022)
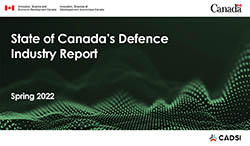
Canada’s defence industry contributed close to $9.2B in GDP and 78,000 jobs across the Canadian economy in 20203
- Total economic activity contribution supported by the Canadian defence industry increased by close to $2.2 billion in GDP and 13,900 jobs between 2018 and 20203
Figure 2: Economic Impact 2020
3 Excludes impacts from activities that occurred due to the application of the Industrial & Technological Benefits (ITB) Policy to military procurements if those activities did not relate in any way to Canadian defence industry production in 2020 (as either supplies to the defence industry, or defence goods production by a defence firm). See annex for associated data tables
Source : Statistics Canada’s Canadian Defence, Aerospace, Marine and Cybersecurity Industries Survey (2018, and 2020), 2020 survey released 2022; ISED economic modelling based on Statistics Canada’s latest input-output multipliers (2016 and 2018), and the specific economic impact multipliers most relevant to the survey’s individual defence goods and services categories
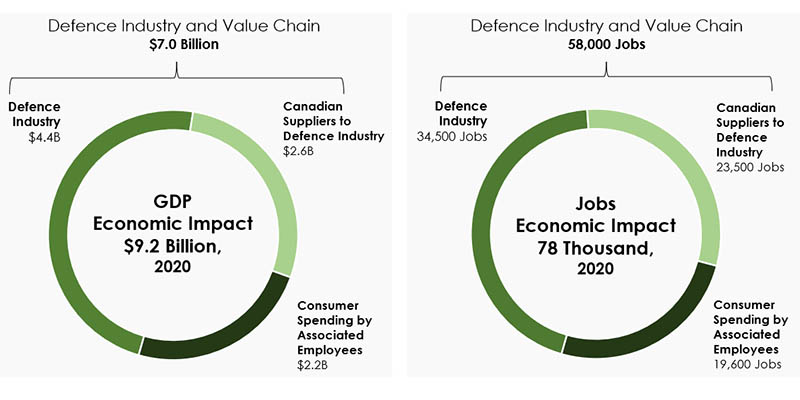
Firms with fewer than 250 employees represented close to 90% of firms in the Canadian defence industry in 2020
- Firms with 250-499 employees captured 12% or less of the overall number of firms, revenues, employment, R&D and exports
- Firms with 500 or more employees accounted for over 60% of the industry revenues, employment, R&D, and exports
Figure 3: Breakdown by Defence Firm Size, 2020
Source: Statistics Canada’s Canadian Defence, Aerospace, Marine and Cybersecurity Industries Survey (2020), 2022. See annex for associated data tables
Over $12.6B in defence revenues were generated by over 620 businesses across domains in 20204
- Air & space systems5 and land & other defence goods and services categories accounted for most of the defence industry’s R&D and exports
Figure 4: Defence Activity Breakdown by Domain
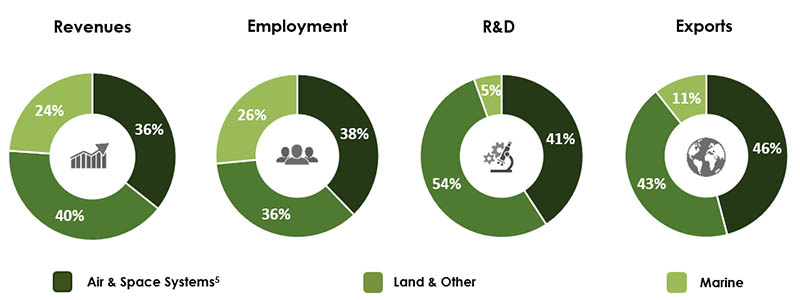
4 In the context of this document, the grouping of defence goods and services categories according to ‘domains’ is determined by the platform type to which they relate. See annex for associated data tables. For the full official titles and definitions of the survey’s defence goods and services categories, and for lists of the categories which are included under the broader “Domain”.
5 ‘Space Systems’ as measured here is narrower in scope than the broader concept of the ‘Space Sector’ as measured by the Canadian Space Agency (CSA)
Source: Statistics Canada’s Canadian Defence, Aerospace, Marine and Cybersecurity Industries Survey (2020), 2022
Marine related activities led revenue growth both in dollar value and relative terms between 2018-20206
- Export activities were responsible for close to 75% of the growth of revenues in air & space systems, close to 30% in land & other and more than 20% in marine between 2018 and 2020
Figure 5: Defence Revenues by Domain, Change in $, Millions, and Defence Revenues by Domain, Change in %, (2018-20207)
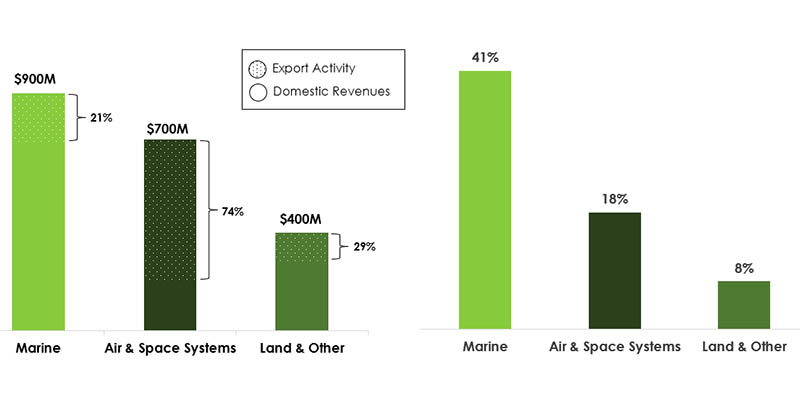
6 In this document, the grouping of defence goods and services categories by ‘domain’ reflects the platform types to which they relate. See annex for associated data tables and full official titles and definitions of the goods and services categories, and lists of the categories included under the broader “domain” type groupings
7 Revenues are not adjusted for inflation
Source: Statistics Canada’s Canadian Defence, Aerospace, Marine and Cybersecurity Industries Survey (2020), 2022
Each region had specific areas of strength in 20208
Figure 6: Canadian Defence Industry Employment Regional Breakdown9, with Top Regional Specializations 2020
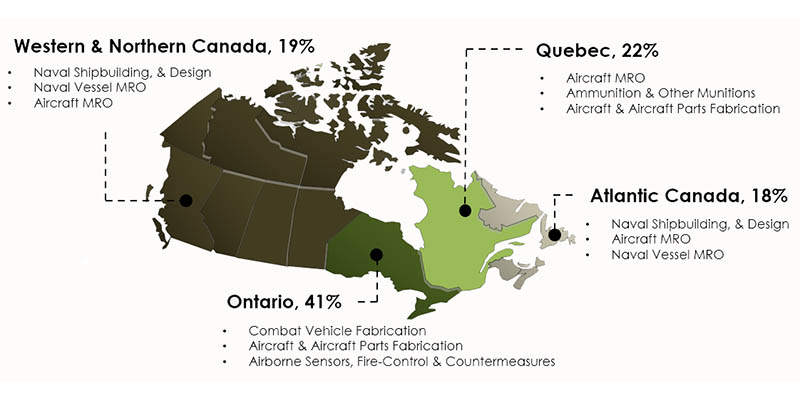
8 See annex for the associated data table, the top 10 specializations per region, and for the full official titles of the defence goods and services categories
9 Ontario’s share was rounded up to 41% so that the chart total sums to 100%. Shares of employment by region are based on businesses that specified their regional employment breakdown and reflect the defence industry’s own 34.5K in total employees. The rankings of top 3 activities per region exclude a survey category which covered a mix of other (unspecified) defence goods and services
Source: Statistics Canada’s Canadian Defence, Aerospace, Marine and Cybersecurity Industries Survey (2020), 2022
Women in STEM accounted for 17% of STEM employees in the defence industry, compared to 23% in the broader manufacturing sector in 2020
Figure 7: Canadian Defence Industry Occupation & Gender Breakdown By Employment Type, 2020
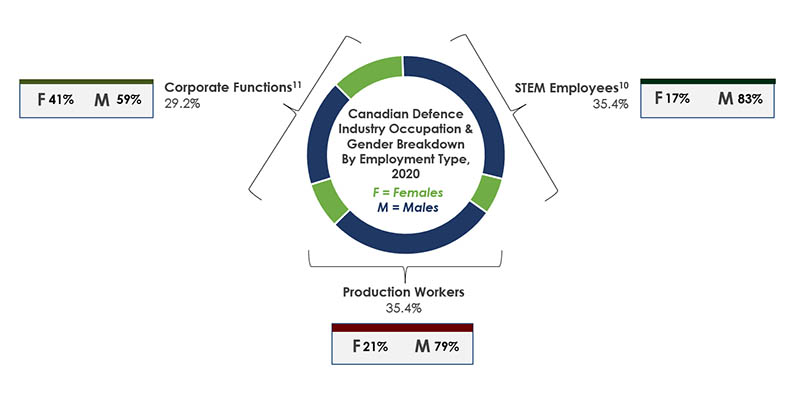
10 Under the survey, Science, Technology, Engineering, & Mathematics (STEM) occupations include engineers, scientists and/or researchers, and technicians and technologists. See annex for associated data tables
11 Includes occupations in: management, administration, marketing, and all other employees
Source: Statistics Canada’s Canadian Defence, Aerospace, Marine and Cybersecurity Industries Survey (2020), 2022; and Statistics Canada custom tabulations based on the Labour Force Survey (2020), 2022
STEM10 occupations’ share of employment was almost 3X the Canadian manufacturing sector average in 2020
Figure 8: Share of an Industry’s Employees in STEM10 Related Occupations, the Canadian Defence Industry vs. the Broader Manufacturing Sector, 2020
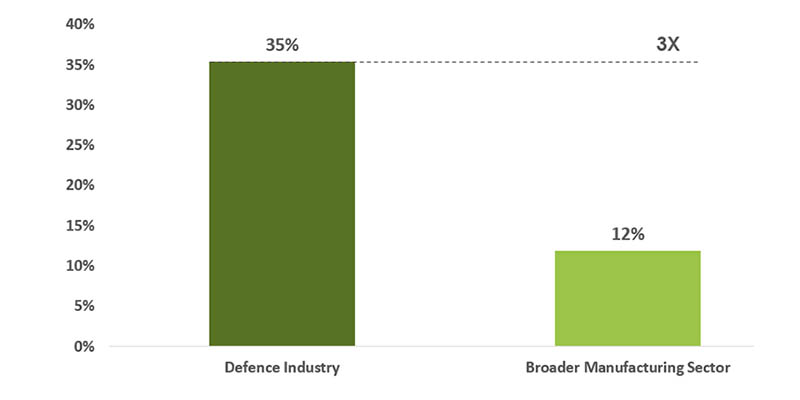
10 Under the survey, Science, Technology, Engineering, & Mathematics (STEM) occupations include engineers, scientists and/or researchers, and technicians and technologists. See annex for the associated data table
Source: Statistics Canada’s Canadian Defence, Aerospace, Marine and Cybersecurity Industries Survey (2018, 2020), 2020 released in 2022, custom tabulations for ISED; and Statistics Canada custom tabulations based on the Labour Force Survey (2020), 2022
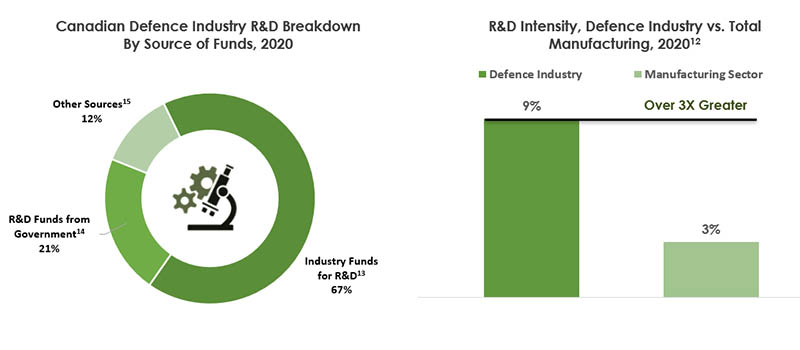
The defence industry’s R&D intensity12 was over 3X greater than the Canadian manufacturing sector average in 2020
- Close to $401M of R&D performed by the defence industry in 2020
- 67% funded by industry, and close to 21% funded by Canadian government sources14
Figure 9: Canadian Defence Industry R&D Breakdown By Source of Funds, and R&D Intensity, Defence Industry vs. Total Manufacturing, 2020
12 Industry-level R&D intensity is measured as the ratio of R&D performed by a given industry or sector relative to its own GDP. At the level of individual defence goods & services categories, R&D to GDP ratios are not available, but ratios of category-level R&D to sales are available, and are provided in the annex for insights into differences in relative R&D orientation across specific defence activities
13 This was led by internal funds from the defence businesses performing the R&D, plus some funds from their parent, affiliated and subsidiary companies. Contract work for other businesses only accounted for under 4% of industry funds for defence industry in-house R&D
14 Government funded R&D was led by contract funds
15 Other sources may include universities, foreign governments, individuals, etc.
Source: Statistics Canada’s Canadian Defence, Aerospace, Marine and Cybersecurity Industries Survey (2020), 2022; ISED estimates of defence industry GDP; and Statistics Canada online tables 27-10-0344-01, 27-10-0333-01 (released in 2021) and tables 36-10-0434-01,18-10-0005-01 (released in 2022). See annex for associated data tables.
Close to 80% of Canadian defence industry supply chain expenditures were with Canadian and U.S. based suppliers in 2020
- Canadian-owned firms used domestic suppliers more than foreign-owned firms
Figure 10: Canadian Defence Industry Supply Chain Footprint by Suppliers’ Location (% of Expenditures), 202016
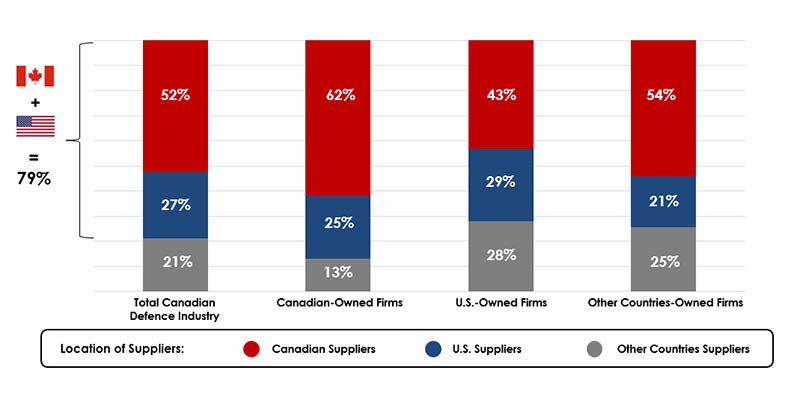
16 This reflects the subset of operating expenditures that relate to purchases of mainly raw materials and components that are more directly used for/in manufacturing processes, and differences in the extent to which Canadian vs. foreign-owned businesses make their purchases of such inputs from domestic companies or distributors
Source: Statistics Canada’s Canadian Defence, Aerospace, Marine and Cybersecurity Industries Survey (2020), 2022, Statistics Canada
Over $6.5B in exports, with close to 55% accounted for by exports to Canada’s Five Eyes partners17
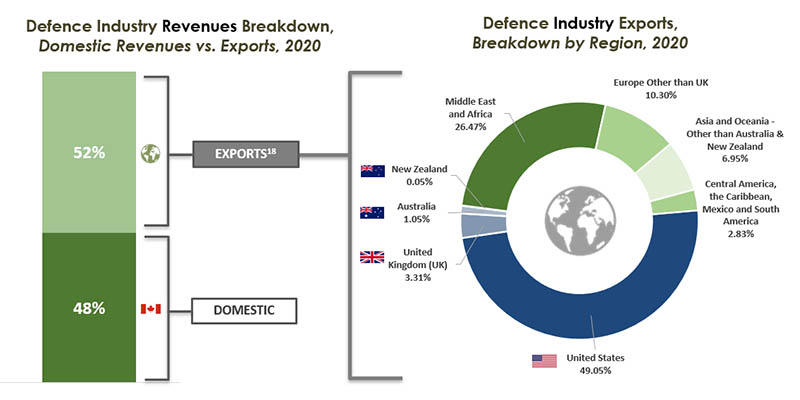
17 The Five Eyes partner nations include: Australia, Canada, New Zealand, the United Kingdom, and the United States of America
18 Ratios of category-level exports to sales are also available, and are provided in the annex for insights into differences in the relative export orientation of specific defence activities
Source: Statistics Canada’s Canadian Defence, Aerospace, Marine and Cybersecurity Industries Survey (2020), 2022. See annex for associated data tables
Key Findings
In 2020, Canada’s defence industry:
- Outperformed the broader manufacturing sector across industrial indicators between 2018-2020
- Had over 620 firms active across domains with over $12.6B in revenues
- Contributed close to 78,000 jobs to the Canadian economy
- An increase of close to 13,900 jobs between 2018 and 2020
- Was national in scope, with regional specializations
- Was close to 3X more STEM oriented and R&D intensive than the broader manufacturing sector
- Had close to 80% of its supply chain expenditures with Canadian and U.S. based suppliers
- Had $6.5B worth of exports, with close to 55% of exports going to Canada’s Five Eyes partners
Annexes
Annex 1 – Economic impact methodology principles
- Foundation data is based on the latest (2020) Canadian Defence, Aerospace, Marine, and Cybersecurity Industries Survey released in 2022
- ISED economic modelling based on Statistics Canada’s latest Input-Output multipliers (2018) and closest related specific economic impact multipliers that relate to defence activities
- Economic model is based on Statistics Canada Input-Output multipliers
- Defence activity has been linked to the latest (2018) and most relevant specific economic impact multipliers per defence industry goods and services category
- GDP impact is reported cumulatively and on a yearly average basis
- Job impact is reported on the annual average basis and measured in terms of full-time equivalent employment (FTE)
- Total economic impact of the defence industry includes the activity that occurs within the Canadian defence industry, Canadian suppliers to the Canadian defence industry, as well as consumer spending by associated employees across the Canadian economy
- Economic impact estimates are reported at the national-level and cannot be broken down at the regional-level
Annex 2 – Data Tables
| Defence | Manufacturing |
|---|---|---|
Revenues | 18% | -11% |
Employment | 18% | -6% |
R&D | -3% | -14% |
Exports | 14% | -11% |
2 Note: Financial values are in nominal terms and are not adjusted for inflation, and R&D spending relates to defence industry businesses’ in-house R&D.
Source: Statistics Canada’s Canadian Defence, Aerospace, Marine and Cybersecurity Industries Survey (2018, 2020), 2020 survey released in 2022; Statistics Canada export data accessed through “Trade Data Online”; and Statistics Canada’s online tables: 27-10-0333-01, 14-10-0202-01, and 16-10-0047-01
| Key Industry Indicators | DEFENCE INDUSTRY | MANUFACTURING SECTOR | ||||
|---|---|---|---|---|---|---|
| 201419 | 2020 | % Change | 2014 | 2020 | % Change | |
Revenues | $9,231,524,542 | $12,612,286,611 | 36.6% | $616,609,722,000 | $611,216,697,000 | -0.9% |
Employment | 26,857 | 34,489 | 28.4% | 1,492,981 | 1,452,860 | -2.7% |
R&D20 (2016-2020) | $398,848,412 | $400,806,699 | 0.5% | $6,680,000,000 | $5,680,000,000 | -15.0% |
Exports | $5,509,665,830 | $6,532,679,153 | 18.6% | $318,754,843,000 | $335,539,476,000 | 5.3% |
19 Changes in monetary values are in current dollars/not adjusted for inflation, with R&D relating to businesses’ in-house R&D. Estimates presented here in relation to 2014 defence industry activities are based on updated 2014 data reflecting necessary revisions which occurred subsequent to both Statistics Canada’s original data release, and the ISED CADSI publication in 2016 of the “State of Canada’s Defence Industry, 2014” report.
20 A 2014 defence industry R&D value could not be used for comparisons over time, with 2016 used instead. Among firms accounting for 50.1% of 2014 defence industry revenues, it could not be determined if they performed such R&D, and/or the value of such spending. Hence, the 2014 estimate cannot be regarded as statistically representative of the overall defence industry with sufficient confidence. Since the 2014 value is more likely to notably understate actual R&D in that year, is not used here.
Source: Statistics Canada’s Canadian Defence, Aerospace, Marine and Cybersecurity Industries Survey (2014, 2016, 2018, & 2020), 2020 survey date released 2022; Statistics Canada export data accessed through “Trade Data Online”; and Statistics Canada’s online tables: 27-10-0333-01, 14-10-0202-01, and 16-10-0047-01
GDP Economic Impact ($M) | ||||
|---|---|---|---|---|
Defence Industry | Suppliers to Defence Industry | Defence Industry and Value Chain | Consumer Spending by Associated Employees | Total GDP Economic Impact |
$4,420M | $2,567M | $6,987M | $2,199M | $9,186M |
Jobs Economic Impact | ||||
Defence Industry | Suppliers to Defence Industry | Defence Industry and Value Chain | Consumer Spending by Associated Employees | Total Annual Average Jobs |
34,500 Jobs | 23,500 Jobs | 58,000 Jobs | 19,600 Jobs | 77,600 Jobs |
Source: Canadian Defence, Aerospace, Marine and Cybersecurity Industries Survey (2020), released in 2020; ISED economic modelling based on Statistics Canada’s latest Input-Output multipliers (2018) and closest related specific economic impact multipliers that relate to defence activity
Size Breakdown | Share of Total Defence Industry Enterprise Counts | Share of Total Defence Industry Revenues | Share of Total Defence Industry Employment | Share of Total Defence Industry R&D | Share of Total Defence Industry Exports |
|---|---|---|---|---|---|
Enterprises with Fewer than 250 Employees | 88% | 22% | 28% | 23% | 19% |
Enterprises with Between 250 and 499 Employees | 6% | 11% | 12% | 8% | 12% |
Enterprises with 500 or More Employees | 6% | 67% | 60% | 69% | 69% |
Total Enterprises | 100% | 100% | 100% | 100% | 100% |
Domain | Share of Total Defence Industry Revenues | Share of Total Defence Industry Employment | Share of Total Defence Industry R&D | Share of Total Defence Industry Exports |
|---|---|---|---|---|
Aerospace and Space | 36% | 38% | 41% | 46% |
Land and Other | 40% | 36% | 54% | 44% |
Marine | 24% | 27% | 6% | 11% |
Total Enterprises | 100% | 100% | 100% | 100% |
Source: Statistics Canada’s Canadian Defence, Aerospace, Marine and Cybersecurity Industries Survey (2020), 2022
| Revenue, % Change, 2018-2020 | Revenue, Change in $ Billion, 2018-2020 | Share of Growth from Exports, % |
|---|---|---|---|
Air & Space Systems | 18% | $0.70 | 74% |
Land & Other | 8% | $0.36 | 29% |
Marine | 41% | $0.87 | 21% |
Regional Breakdown | Western and Northern Canada | Ontario | Quebec | Atlantic Canada |
|---|---|---|---|---|
Distribution of Employment in the Defence Industry | 19.1% | 40.4% | 22.3% | 18.2% |
| Ranking | Western and Northern Canada Top 10 Ranking of Activities |
|---|---|
1 | Naval Vessel Construction, Conversions, Architecture, Engineering and Related Services |
2 | Naval Ship Maintenance, Repair, Overhaul, Modernization or Upgrade Services |
3 | Military Aircraft Maintenance, Repair, Overhaul, Modernization or Upgrade Services |
4 | Aircraft Fabrication, Structures and Components |
5 | Other Defence |
6 | Naval Ship-Borne Mission Systems and Components |
7 | Primarily Land-Based, Man-Portable or Non-Platform Specific Communications and Navigation Systems; and Other Information Systems (Including Processing and Dissemination), Software, Electronics and Components |
8 | Combat and Other Military Ground Vehicles and Components |
9 | Naval Ships' Structural Elements, Platform Systems, Parts and Components (Excludes: Ship-Borne Naval Mission Systems) |
10 | Primarily Land-Based or Man-Portable Electro-Optical, Radar, Sonar and Other Sensor/Information Collection Systems; Fire Control, Warning and Countermeasures Systems and Related Components |
| Ranking | Ontario Top 10 Ranking of Activities |
1 | Combat and Other Military Ground Vehicles and Components |
2 | Aircraft Fabrication, Structures and Components |
3 | Primarily Airborne Electro-Optical, Radar, Sonar and Other Sensor/Information Collection Systems; Fire Control, Warning and Countermeasures Systems and Related Components |
4 | Other Defence |
5 | Primarily Land-Based, Man-Portable or Non-Platform Specific Communications and Navigation Systems; and Other Information Systems (Including Processing and Dissemination), Software, Electronics and Components |
6 | Naval Ship-Borne Mission Systems and Components |
7 | Military Aircraft Maintenance, Repair, Overhaul, Modernization or Upgrade Services |
8 | Naval Ships' Structural Elements, Platform Systems, Parts and Components (Excludes: Ship-Borne Naval Mission Systems) |
9 | Primarily Airborne Communications and Navigation Systems; and Other Information Systems (Including Processing and Dissemination), Software, Electronics and Components |
10 | Combat and Other Military Ground Vehicles Maintenance, Repair, Overhaul, Modernization and Upgrade Services |
| Ranking | Quebec Top 10 Ranking of Activities |
1 | Military Aircraft Maintenance, Repair, Overhaul, Modernization or Upgrade Services |
2 | Ammunition and Other Munitions |
3 | Aircraft Fabrication, Structures and Components |
4 | Simulation Systems for Aircraft |
5 | Military Training Services |
6 | Primarily Airborne Communications and Navigation Systems; and Other Information Systems (Including Processing and Dissemination), Software, Electronics and Components |
7 | Combat and Other Military Ground Vehicles and Components |
8 | Naval Ship Maintenance, Repair, Overhaul, Modernization or Upgrade Services |
9 | Other Defence |
10 | Naval Ships' Structural Elements, Platform Systems, Parts and Components (Excludes: Ship-Borne Naval Mission Systems) |
| Ranking | Atlantic Canada Top 10 Ranking of Activities |
1 | Naval Vessel Construction, Conversions, Architecture, Engineering and Related Services |
2 | Military Aircraft Maintenance, Repair, Overhaul, Modernization or Upgrade Services |
3 | Naval Ship Maintenance, Repair, Overhaul, Modernization or Upgrade Services |
4 | Other Defence |
5 | Aircraft Fabrication, Structures and Components |
6 | Primarily Airborne Electro-Optical, Radar, Sonar and Other Sensor/Information Collection Systems; Fire Control, Warning and Countermeasures Systems and Related Components |
7 | Naval Ships' Structural Elements, Platform Systems, Parts and Components (Excludes: Ship-Borne Naval Mission Systems) |
8 | Naval Ship-Borne Mission Systems and Components |
9 | Primarily Land-Based or Man-Portable Electro-Optical, Radar, Sonar and Other Sensor/Information Collection Systems; Fire Control, Warning and Countermeasures Systems and Related Components |
10 | Combat and Other Military Ground Vehicles Maintenance, Repair, Overhaul, Modernization and Upgrade Services |
| Occupation Breakdown | Share of Employment by Occupation | Gender Breakdown | Share of Occupations’ Employment by Gender |
|---|---|---|---|
STEM | 35.4% | Male | 83.2% |
Female | 16.8% | ||
Production Workers | 35.4% | Male | 78.8% |
Female | 21.2% | ||
Corporate Functions | 29.2% | Male | 59.3% |
Female | 40.7% |
| Occupation Type | Canada’s Defence Industry | Canada’s Manufacturing Sector |
|---|---|---|
Corporate Functions | 41% | 46% |
STEM | 17% | 23% |
Production Workers | 21% | 21% |
| TOTAL | 25% | 28% |
| 2020 | |
|---|---|
Defence Industry | 35% |
Broader Manufacturing Sector | 12% |
Source: Statistics Canada’s Canadian Defence, Aerospace, Marine and Cybersecurity Industries Survey (2020), 2022
| Sources of Funds for R&D | Share of R&D Breakdown |
|---|---|
Industry Funds for R&D13 | 67.0% |
R&D Funds from Government14 | 21.3% |
Other Sources15 | 11.7% |
| 2020 | |
|---|---|
Defence Industry | 9.1% |
Manufacturing Sector | 2.8% |
12 Industry-level R&D intensity is measured as the ratio of R&D performed by a given industry or sector relative to its own GDP. At the level of individual defence goods & services categories, R&D to GDP ratios are not available, but ratios of category-level R&D to sales are available, and are provided in the annex for insights into differences in relative R&D orientation across specific defence activities
13 This was led by internal funds from the defence businesses performing the R&D, plus some funds from their parent, affiliated and subsidiary companies. Contract work for other businesses only accounted for under 4% of industry funds for defence industry in-house R&D.
14 Government funded R&D was led by contract funds
15 Other sources may include universities, foreign governments, individuals, etc.
Source: Statistics Canada’s Canadian Defence, Aerospace, Marine and Cybersecurity Industries Survey (2020), 2022; ISED estimates of defence industry GDP; and Statistics Canada online tables 27-10-0344-01, 27-10-0333-01 (released in 2021) and tables 36-10-0434-01,18-10-0005-01 (released in 2022). See annex for associated data tables.
| Category Revenues | Category R&D Relative Revenues | Ranking, from Highest to Lowest R&D to Revenue Ratio | |
|---|---|---|---|
| Unmanned Aerial Systems/Vehicles (UAS/V) and Components | $63,556,985 | X > 15% | 1 |
| Simulation Systems for Aircraft | $235,430,669 | 12% | 2 |
| Simulation Systems for Naval Vessels | $9,235,218 | 9% | 3 |
| Primarily Airborne Communications and Navigation Systems; and Other Information Systems (Including Processing and Dissemination), Software, Electronics and Components | $377,610,671 | 9% | 4 |
| Missiles and Rockets | $126,891,803 | 3% | 5 |
| Primarily Land-Based, Ground Vehicle-Borne, Man-Portable or Non-Platform Specific Electro-Optical, Radar, Sonar and Other Sensor/Information Collection Systems; Fire Control, Warning and Countermeasures Systems and Related Components | $332,564,053 | 3% | 6 |
| Military Training Services | $355,998,765 | 3% | 7 |
| Primarily Airborne Electro-Optical, Radar, Sonar and Other Sensor/Information Collection Systems; Fire Control, Warning and Countermeasures Systems and Related Components | $994,181,470 | 3% | 8 |
| Combat and Other Military Ground Vehicles and Components21 | $2,131,512,853 | 3% | 9 |
| Military Personal Protective Equipment, Load Carriage Systems and Operational Clothing | $166,503,552 | 3% | 10 |
| Primarily Land-Based, Ground Vehicle-Borne, Man-Portable or Non-Platform Specific Communications and Navigation Systems; and Other Information Systems (Including Processing and Dissemination), Software, Electronics and Components | $507,845,649 | 3% | 11 |
| Other Defence | $636,232,827 | 3% | 12 |
| Ammunition and Other Munitions | $408,365,530 | 3% | 13 |
| Combat and Other Military Ground Vehicles Maintenance, Repair, Overhaul, Modernization and Upgrade Services21 | $303,021,503 | 3% | 14 |
| Firearms and Other Weapons | $106,350,078 | 0% X 3% | 15 |
| Military Systems Deployed in Space, Space Launch Vehicles, Land-based Systems for the Operation, Command and Control of Space Launch Vehicles or Systems Deployed in Space and Related Components | $70,704,636 | 0% X 3% | 16 |
| Simulation Systems for Land Vehicles or Other Applications | $27,861,283 | 0% X 3% | 17 |
| Naval Ship-Borne Mission Systems and Components | $480,265,905 | 0% X 3% | 18 |
| Aircraft Fabrication, Structures and Components | $1,416,086,478 | 0% X 3% | 19 |
| Naval Ships' Structural Elements, Platform Systems, Parts and Components (Excludes: Ship-Borne Naval Mission Systems) | $415,459,845 | 0% X 3% | 20 |
| Military Aircraft Maintenance, Repair, Overhaul, Modernization or Upgrade Services | $1,339,505,777 | 0% X 3% | 21 |
| Naval Ship Maintenance, Repair, Overhaul, Modernization or Upgrade Services | $775,234,432 | 0% X 3% | 22 |
| Naval Vessel Construction, Conversions, Architecture, Engineering and Related Services | $1,331,866,629 | 0% X 3% | 23 |
21 In the case of the two combat vehicles related categories, there is relatively greater certainty in regards to their combined R&D to revenue ratio. Merged together, the R&D to revenue ratio is within 3% th position
Source: Statistics Canada’s Canadian Defence, Aerospace, Marine and Cybersecurity Industries Survey (2020), 2022, Statistics Canada, Custom Tabulation
| 2020 | |
|---|---|
Canadian-Owned Firms' Purchases | 62% |
Other Foreign-Owned Firms' Purchases | 54% |
U.S.-Owned Firms' Purchases | 43% |
16 This reflects the subset of operating expenditures that relate to purchases of mainly raw materials and components that are more directly used for/in manufacturing processes, and differences in the extent to which Canadian vs. foreign-owned businesses make their purchases of such inputs from domestic companies or distributors
Source: Statistics Canada’s Canadian Defence, Aerospace, Marine and Cybersecurity Industries Survey (2020), 2022, Statistics Canada
| Defence Domestic Revenues | 48% | Defence Export Revenues | 52% |
|---|---|---|---|
| Domestic Revenues by Customer Type | Export Revenues by Destination | ||
| Canadian Federal Government | 72% | Canada’s ‘Five Eyes’ Partners | 53.4% |
United States | 49.1% | ||
| Other Canadian Customer | 28% | United Kingdom (UK) | 3.3% |
|
| Australia | 1.0% |
|
| New Zealand | 0.1% |
|
| Middle East and Africa | 26.5% |
|
| Europe Other than UK | 10.3% |
|
| Asia and Oceania - Other than Australia & New Zealand | 6.9% |
|
| Central America, the Caribbean, Mexico and South America | 2.8% |
| Defence Industry Domestic Revenues Total | 100% | Defence Industry Export Revenues Total | 100% |
Source: Statistics Canada’s Canadian Defence, Aerospace, Marine and Cybersecurity Industries Survey (2020), 2022
| Category Revenues | Exports' Share (%) of Category Revenue [Export Intensity] | Ranking, from Highest to Lowest Export Intensity | |
|---|---|---|---|
| Primarily Airborne Electro-Optical, Radar, Sonar and Other Sensor/Information Collection Systems; Fire Control, Warning and Countermeasures Systems and Related Components | $994,181,470 | 80% | 1 |
| Unmanned Aerial Systems/Vehicles (UAS/V) and Components | $63,556,985 | 80% | 2 |
| Aircraft Fabrication, Structures and Components | $1,416,086,478 | 60% | 3 |
| Combat Vehicles and Components & Combat Vehicles Maintenance, Repair and Overhaul22 | $2,434,534,356 | 60% | 4 |
| Military Systems Deployed in Space, Space Launch Vehicles, Land-based Systems for the Operation, Command and Control of Space Launch Vehicles or Systems Deployed in Space and Related Components | $70,704,636 | 60% | 5 |
| Missiles and Rockets | $126,891,803 | 60% | 6 |
| Primarily Airborne Communications and Navigation Systems; and Other Information Systems (Including Processing and Dissemination), Software, Electronics and Components | $377,610,671 | 40% | 7 |
| Simulation Systems for Aircraft | $235,430,669 | 40% | 8 |
| Naval Ship-Borne Mission Systems and Components | $480,265,905 | 40% | 9 |
| Naval Ships' Structural Elements, Platform Systems, Parts and Components (Excludes: Ship-Borne Naval Mission Systems) | $415,459,845 | 40% | 10 |
| Ammunition and Other Munitions | $408,365,530 | 40% | 11 |
| Primarily Land-Based, Ground Vehicle-Borne, Man-Portable or Non-Platform Specific Electro-Optical, Radar, Sonar and Other Sensor/Information Collection Systems; Fire Control, Warning and Countermeasures Systems and Related Components | $332,564,053 | 40% | 12 |
| Primarily Land-Based, Ground Vehicle-Borne, Man-Portable or Non-Platform Specific Communications and Navigation Systems; and Other Information Systems (Including Processing and Dissemination), Software, Electronics and Components | $507,845,649 | 40% | 13 |
| Military Aircraft Maintenance, Repair, Overhaul, Modernization or Upgrade Services | $1,339,505,777 | 40% | 14 |
| Simulation Systems for Naval Vessels | $9,235,218 | 20% | 15 |
| Military Personal Protective Equipment, Load Carriage Systems and Operational Clothing | $166,503,552 | 20% | 16 |
| Other Defence | $636,232,827 | 20% | 17 |
| Military Training Services | $355,998,765 | 20% | 18 |
| Simulation Systems for Land Vehicles or Other Applications | $27,861,283 | 0% X 20% | 19 |
| Firearms and Other Weapons | $106,350,078 | 0% X 20% | 20 |
| Naval Vessel Construction, Conversions, Architecture, Engineering and Related Services | $1,331,866,629 | 0% X 20% | 21 |
| Naval Ship Maintenance, Repair, Overhaul, Modernization or Upgrade Services | $775,234,432 | 0% X 20% | 22 |
22 The survey’s two combat vehicles related categories were merged here to provide an export intensity estimate more certain to be representative of the combined set of associated activities, than would be individual estimates where the combat vehicles MRO estimate would have been of more uncertain reliability
Source: Statistics Canada’s Canadian Defence, Aerospace, Marine and Cybersecurity Industries Survey (2020), 2022, Statistics Canada, Custom Tabulation
Annex 3: Defence Goods and Services Categories by Domain/Platform Relation
| Air & Space |
|---|
Aircraft Fabrication, Structures and Components |
Military Aircraft Maintenance, Repair, Overhaul, Modernization or Upgrade Services |
Military Systems Deployed in Space, Space Launch Vehicles, Land-based Systems for the Operation, Command and Control of Space Launch Vehicles or Systems Deployed in Space and Related Components |
Primarily Airborne Communications and Navigation Systems; and Other Information Systems (Including Processing and Dissemination), Software, Electronics and Components |
Primarily Airborne Electro-Optical, Radar, Sonar and Other Sensor/Information Collection Systems; Fire Control, Warning and Countermeasures Systems and Related Components |
Simulation Systems for Aircraft |
Unmanned Aerial Systems/Vehicles (UAS/V) and Components |
| Land and Other |
Ammunition and Other Munitions |
Combat and Other Military Ground Vehicles and Components |
Combat and Other Military Ground Vehicles Maintenance, Repair, Overhaul, Modernization and Upgrade Services |
Firearms and Other Weapons |
Military Personal Protective Equipment, Load Carriage Systems and Operational Clothing |
Military Training Services |
Missiles and Rockets |
Other Defence |
Primarily Land-based, Ground Vehicle-Borne, Man-Portable or Non-Platform Specific Communications and Navigation Systems; and Other Information Systems (Including Processing and Dissemination), Software, Electronics and Components |
Primarily Land-based, Ground Vehicle-Borne, Man-Portable or Non-Platform Specific Electro-Optical, Radar, Sonar and Other Sensor/Information Collection Systems; Fire Control, Warning and Countermeasures Systems and Related Components |
Simulation Systems for Land Vehicles or Other Applications |
| Marine |
Naval Ship Maintenance, Repair, Overhaul, Modernization or Upgrade Services |
Naval Ship-Borne Mission Systems and Components |
Naval Ships' Structural Elements, Platform Systems, Parts and Components (Excludes: Ship-Borne Naval Mission Systems) |
Naval Vessel Construction, Conversions, Architecture, Engineering and Related Services |
Simulation Systems for Naval Vessels |
Source: Statistics Canada’s Canadian Defence, Aerospace, Marine and Cybersecurity Industries Survey (2020), 2022, Statistics Canada, Custom Grouping
Annex 4: Defence Goods and Services Category Official Definitions
Ammunition and Other Munitions This category includes sales related to production as well as research, development, design, engineering, testing and evaluation services, and disposal activities such as relating to:
Excluded are sales of missiles, rockets and other related parts and components which should be reported under the category for, ‘Missiles and Rockets’. |
Missiles and Rockets This category includes sales related to production as well as research, development, design, engineering, testing and evaluation services relating to military missiles and rockets, including advanced missiles used by anti-ballistic missile (ABM) systems. Excluded here are sales relating to:
Those are to be reported under either the categories for ‘Ammunition and Other Munitions’ or for military space systems as appropriate. |
Firearms and Other Weapons This category includes military sales related to production as well as research, development, design, engineering, testing and evaluation services relating to technologies aggressively used to gain or defend a tactical advantage over an adversary; to attack, defend and protect assets and personnel. This includes lethal and non-lethal kinetic and non-kinetic weapon systems like:
|
Military Systems Deployed in Space, Space Launch Vehicles, Land-based Systems for the Operation, Command and Control of Space Launch Vehicles or Systems Deployed in Space, and Related Components This category includes sales related to production as well as research, development, design, engineering, testing and evaluation services:
|
Primarily Airborne Electro-Optical, Radar, Sonar and Other Sensor / Information Collection Systems; Fire Control, Warning and Countermeasures Systems, and Related Components This category includes sales related to production as well as research, development, design, engineering, testing and evaluation services relating to primarily airborne:
Note: sales relating to similar systems, parts and components but which are integrated into naval vessels should be reported under the category for “Naval Ship-Borne Mission Systems and Components”. |
Primarily Land-based Ground Vehicle Borne, Man-Portable or Non-Platform Specific Electro-Optical, Radar, Sonar and Other Sensor/Information Collection Systems; Fire Control, Warning and Countermeasures Systems, and Related Components This category includes sales related to production as well as research, development, design, engineering, testing and evaluation services relating to primarily land-based, ground vehicle-borne, man-portable or non-platform specific:
Note: sales relating to similar systems, parts and components but which are integrated into naval vessels should be reported under the category for: “Naval Ship-Borne Mission Systems and Components”. |
Primarily Airborne Communications and Navigation Systems; and Other Information Systems (Including Processing and Dissemination), Software, Electronics and Components This category includes sales related to production as well as research, development, design, engineering, testing and evaluation services relating to primarily airborne:
Note: sales relating to similar systems but which are integrated into naval vessels should be reported under the category for: “Naval Ship-Borne Mission Systems and Components”. |
Primarily Land-based, Ground Vehicle-Borne, Man-Portable or Non-Platform Specific Communications and Navigation Systems; and Other Information Systems (Including Processing and Dissemination), Software, Electronics and Components This category includes sales related to production as well as research, development, design, engineering, testing and evaluation services relating to land-based, ground vehicle-borne, man-portable or non-platform specific:
Note: sales relating to similar systems but which are integrated into naval vessels should be reported under the category for: “Naval Ship-Borne Mission Systems and Components”. |
Naval Ship-Borne Mission Systems and Components This category includes sales related to production as well as research, development, design, engineering, testing and evaluation services relating to such systems as: Naval vessel mission/combat systems: command, control, and communications; radar, sonar, electro-optical and other sensors, navigation systems, displays, other Information Technologies (including Software) and electronics, countermeasures; guns, and missile or torpedo launchers. |
Naval Ship’s Structural Elements, Platform Systems, Parts & Components (Excluding Shipborne Naval Mission Systems) This category includes sales for production as well as research, development, design, engineering, testing and evaluation services relating to: Excluded from this category are sales related to shipborne naval mission systems/naval vessels’ combat systems like command, control, and communications systems; radars, sonar, electro-optical systems, naval countermeasures, navigation systems, displays and other sensors and electronics, naval guns and missile launchers. Those are to be reported under the category for: |
Naval Vessel Architecture, Engineering, Certification and Related Professional Services This category includes sales under contracts specifically for naval architecture and engineering services relating to naval surface ships or naval submarines operated by navies (i.e., vessels specifically designed for/restricted to use by militaries in combat, their transportation of military goods and personnel, or to otherwise perform military/naval specific functions). Relevant Services Include:
Exclude from this category:
|
New Naval Vessels Constructed by Shipyards, and Naval Conversions Only to be reported here are sales by shipyards in relation to their construction/assembly work (and/or related research, development, design and engineering work) conducted by their operations in Canada in relation to the: Conversion of existing vessels that were originally designed and built as commercial/civil vessels into naval vessels for future use by militaries in combat, the transportation of military goods and personnel, or to otherwise perform military/naval specific functions. Excluded from this category are sales of goods and services related to shipborne naval mission systems such as naval radars, battle management command and control systems, mine detection and naval countermeasures, naval guns and missile launchers etc. Those are to be reported under a preceding category for: Excluded from this category are sales related to maintenance, repair and overhaul services (MRO) for manned naval surface ships and submarines. Those sales should instead be reported under a separate category for: Excluded from this category are sales of goods and services relating to structural elements, other platform systems, subsystems, parts and components of naval vessels not elsewhere reported. Such sales should instead be reported under the separate preceding category for: Naval ships’ structural elements, platform systems, parts, & components (excludes shipborne naval mission systems) Further exclusions or guidance: For such businesses, they should only report any relevant sales relating to work done by their respective operations’ employees in Canada, which exclude the sales value of work the businesses contracted/subcontracted or passed through to shipyards in Canada. This is necessary in order to prevent potential large scale double counting of the actual value of naval vessels being delivered by shipyards in Canada, and hence overestimation of the actual volume of associated industrial activity at shipyards in Canada |
Naval Ship Maintenance, Repair and Overhaul This category includes sales, carried out under contract, related to the provision of services for maintenance, repair, and overhaul of naval surface and subsurface marine vessels (e.g., submarines); as well as for related training activities. |
Combat Vehicles and Components This category includes sales related to production as well as research, development, design, engineering, testing and evaluation services relating to: Land-based vehicles designed for use in combat and to transport and protect soldiers, and the systems, sub-systems and components of such vehicles (e.g., vehicle structures, electrical systems, armour, engines, transmission systems, heating/cooling systems, engineering). Combat vehicle communication systems, electronics, sensors, fire-control and navigation systems sales should be reported under either the appropriate categories for:
Similarly, sales relating to maintenance, Repair, overhaul (MRO) and/or training services relating to combat vehicles should also be reported separately in the category for: |
Combat Vehicles Maintenance, Repair and Overhaul This category includes sales, carried out under contract, related to the provision of services for maintenance, repair, and overhaul of land-based vehicles designed for use in combat and to transport and protect soldiers; as well as for related training activities. |
Aircraft Fabrication, Structures and Components This category includes sales related to production as well as research, development, design, engineering, testing and evaluation services relating to: Excluded from this category are sales related to military aircraft maintenance, repair and overhaul (MRO) services; aircraft communication systems; navigation systems; avionics; air-borne sensors; missiles, rockets and projectiles made to be fired from aerial platforms; display units; and other electronics for manned military aerial platforms—these are to be reported under separate defence product and service categories as appropriate. |
Military Aircraft Maintenance, Repair and Overhaul Services This category includes sales relating to maintenance, repair and overhaul activities (carried out under contract) in relation to military aircraft, engines and accessories; as well as for related training activities. |
Unmanned Aerial Systems and Vehicles and Components This category includes sales related to production, research, development, design, engineering, testing and evaluation services relating to: Excluded are sales relating to missiles; or to weapon systems (e.g., guns, missile launchers) and ammunition, munitions, and missiles carried on/delivered by unmanned aerial systems or vehicles. |
Simulation Systems for Aircraft This category includes sales related to production as well as research, development, design, engineering, testing and evaluation services for the hardware and software technologies used by military and security forces to develop, experiment and test operational doctrines and to train personnel using situational scenarios (e.g., intelligent software, visual systems, network simulations, real-time simulators) as primarily related to aircraft and operations in the air-domain. |
Simulation Systems for Naval Vessels This category includes sales related to production as well as research, development, design, engineering, testing and evaluation services for the hardware and software technologies used by military and security forces to develop, experiment and test operational doctrines and to train personnel using situational scenarios (e.g., intelligent software, visual systems, network simulations, real-time simulators) as primarily related to naval vessels and operations in the maritime-domain. |
Simulation Systems for Land Vehicles or Other Applications This category includes sales related to production as well as research, development, design, engineering, testing and evaluation services for the hardware and software technologies used by military and security forces to develop, experiment and test operational doctrines and to train personnel using situational scenarios (e.g., intelligent software, visual systems, network simulations, real-time simulators) as primarily related to land vehicles/ground-based systems and operations; or for other applications not elsewhere specified. |
Military Training Services This category includes sales related to the provision and development (by operations in Canada) of: Relevant activities are those that occur in real/natural physical environments mirroring expected operational environments/ conditions to the extent possible, using actual platforms and/or other systems and equipment. |
Military Personal Protective Equipment, Load Carriage Systems and Operational Clothing This category includes sales related to production, research, development, design, engineering, testing and evaluation services; as well as to the maintenance and repair of:
Excluded from this category are sales relating to ceremonial uniforms, as well as commercial/civil market items purchased for soldiers. Nor are these to be reported as defence goods and services sales under any of the other defence sales categories. |
All Other Defence (Specify) This category includes sales that could not otherwise be captured under other specified defence goods and services categories, and which are earned from:
EXCLUDED are sales of:
|
Source: Statistics Canada’s Canadian Defence, Aerospace, Marine and Cybersecurity Industries Survey (2020), 2022