

PDF version

Features of Report
- The Report Context
- Economic Impact
- Employment Trends
- Regional Breakdown
- Employment Characteristics
- Innovation
- Civil Aerospace Global Rankings
- Aerospace Defence
- Exports Products
- Key Findings
- Annexes
- Annex 1: Economic Impact Detailed Methodology Principles
- Annex 2: Main Activities Associated with Canadian Aerospace Manufacturing and MRO Services
- Annex 3: Canadian Aerospace Industrial Indicators (2019–2024)
- Annex 4: Canadian Aerospace Industry Economic Impact (2024)
- Annex 5: Share of Canadian Aerospace Industry Employment by Region (2023 vs. 2024)
- Annex 6: Canadian Aerospace Defence Segment Revenues (2018–2022) by Goods and Services Category
- Data Sources
The Report Context
- The report is a partnership:
- Multi-year collaborative analytics agreement with the Aerospace Industries Association of Canada (AIAC) and Innovation, Science and Economic Development Canada (ISED)
The referenced media source is missing and needs to be re-embedded.
- Multi-year collaborative analytics agreement with the Aerospace Industries Association of Canada (AIAC) and Innovation, Science and Economic Development Canada (ISED)
- The report is fact-based:
- Foundational data sourced from government agencies and international independent subject matter experts and reflects revisions and updates
- Economic impact modelsFootnote 1 and innovation indicators informed by experts from the Organisation for Economic Co-operation and Development (OECD) and Statistics Canada
- Statistical overview of Canadian aerospace industry activities in 2024Footnote 2, based on the most recent data available:
- Focus on the industry’s recovery from the COVID-19 pandemic
- Comparative analysis from 2019 to 2024, subject to data availability
Economic Impact
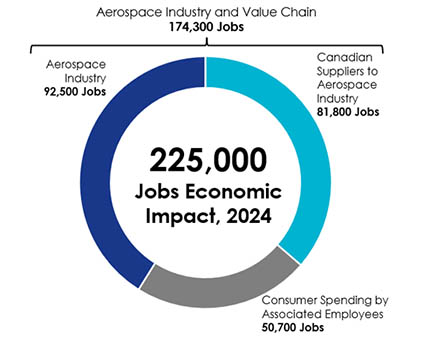
In 2024, the Canadian aerospace industry contributed $34.2B to GDPFootnote 3 and 225,000 jobs to the Canadian economyFootnote 4
Figure 1: Aerospace Industry Contribution to GDP, 2024
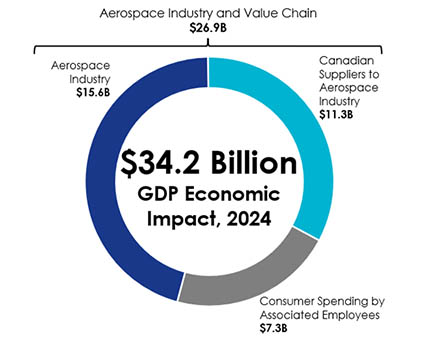
Figure 2: Aerospace Industry Contribution to Jobs, 2024
- Footnote
-
Gross Domestic Product (GDP) is the total unduplicated value of the goods and services produced in an industry, country, or region during a given period. GDP better represents activity that occurs within Canada, in contrast to revenues, which include R&D, employment, and sales from outside of Canada.
-
See Annex 1 for detailed methodology principles and Annex 4 for a comparative economic impact analysis of Canadian aerospace manufacturing and MRO services in 2024.
Employment Trends
In 2024, the Canadian aerospace industry reached 99.8% of pre-pandemic direct employment levelsFootnote 5.
Figure 3: Canadian Aerospace Industry Direct Employment Index, 2019–2024

- Footnote
-
Canadian aerospace manufacturing includes production of aircraft (airplanes, spacecraft, unmanned aerial systems/vehicles, balloons, and parachutes), helicopters, flight simulators, engines, landing gears, avionics, and other parts and components. See Annex 2 for a list of the main activities associated with Canadian aerospace manufacturing and MRO services and Annex 3 for a comparative analysis of Canadian aerospace industrial indicators from 2019 to 2024.
Regional Breakdown
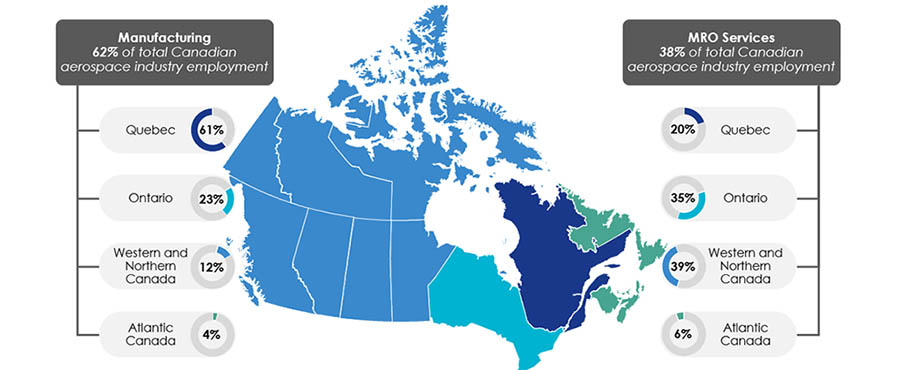
Between 2023 and 2024, all regions maintained their relative employment shares across the Canadian aerospace manufacturing and MRO services sectorsFootnote 6
Figure 4: Share of Canadian Aerospace Industry Employment by Region, 2024
Employment Characteristics
In 2024, the Canadian aerospace manufacturing workforce was innovation-focused and earned close to 25% more than the Canadian manufacturing average
Figure 5: Aerospace Manufacturing Employment
by Occupation Type, 2024

Figure 6: STEM Intensity, 2024
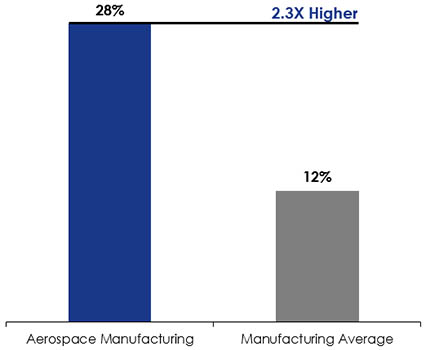
- In 2024, aerospace manufacturing was 2.3X more STEM-intensiveFootnote 7 than the broader Canadian manufacturing industry
- In 2024, aerospace manufacturing employees earned an average yearly salary of over $85,000
- Footnote
-
Science, technology, engineering, and mathematics (STEM). Industry-level STEM intensity is measured as the ratio of employees in STEM-related occupations in each industry or sector relative to its total employment.
Innovation
In 2024, the Canadian aerospace industry maintained its #1 R&DFootnote 8 ranking among all Canadian manufacturing industries
Figure 7: R&D Intensity, 2024

- In 2024, aerospace manufacturing invested more than $1.2B in R&D, returning to pre-pandemic levels
- In 2024, aerospace manufacturing was 2.8X more R&D-intensive than the broader Canadian manufacturing industry
- Footnote
-
Research and development (R&D) is measured in terms of the dollar value of R&D activity. Industry-level R&D intensity is measured as the ratio of R&D expenditures by a given industry or sector relative to its GDP contribution. See Annex 3 for a comparative analysis of Canadian aerospace R&D spending from 2020 to 2024.
Civil Aerospace Global Rankings
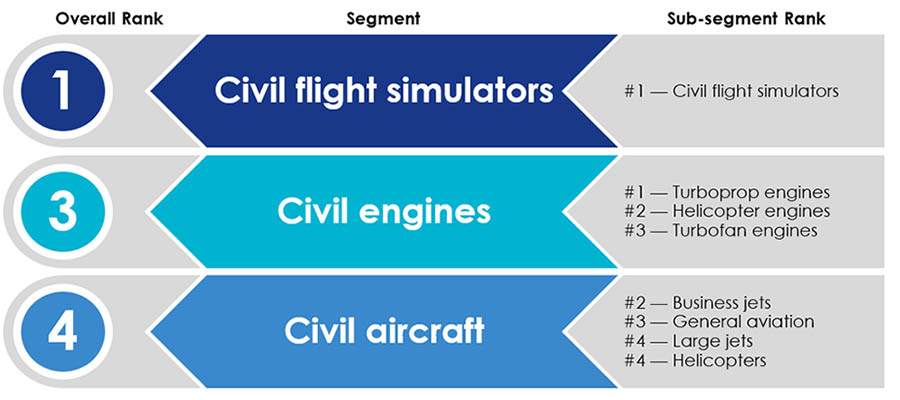
In 2024, Canada rankedFootnote 9 in the global top 5 across civil flight simulators, engines, and aircraft segmentsFootnote 10
Figure 8: Canada’s Civil Aerospace Industry Rankings, 2024
- Footnote
-
Rankings are based on the dollar value of final production.
-
General aviation includes all aircraft not operated by commuter or airline service providers and excludes business jets and helicopters.
Aerospace Defence
In 2022Footnote 11, the Canadian aerospace defence segment was composed of a diversified mix of goods and services
Figure 9: Aerospace Defence Segment Revenues by Goods and Services Category, 2022

- In 2022, Canadian aerospace defence revenues represented 17% of overall aerospace revenues, compared to 13% in the pre-pandemic periodFootnote 12
- This growth was driven by the “Aircraft, Helicopters and/or Components,” and “MRO and Related Services” categories
- Footnote
-
2022 is the latest available year for Canadian aerospace defence segment data.
-
Based on the latest (2018) findings of the Canadian Defence, Aerospace, Marine and Cybersecurity Industries Survey before the onset of the pandemic. See Annex 6 for a detailed breakdown of Canadian aerospace defence industry revenues by goods and services category from 2018 to 2022.
Export Products
In 2024, close to 50% of aerospace manufacturing exports were supply chain-related
Figure 10: Canadian Aerospace Industry Exports by Product Category, 2024

Key Findings
In 2024, the Canadian aerospace industry:
- Contributed $34.2B to GDP and 225,000 jobs to the Canadian economy
- Employed a workforce that was innovation-focused and earned close to 25% more than the Canadian manufacturing average
- Maintained its #1 R&D ranking among all Canadian manufacturing industries
- Ranked in the global top 5 across civil flight simulators, engines, and aircraft segments
- Featured a diversified and growing aerospace defence segment
- Actively participated in global supply chains
Annexes
Annex 1: Economic Impact Detailed Methodology Principles
- Aerospace industry foundational data is compiled from government agencies, such as Statistics Canada and the Canada Revenue Agency, and international independent subject matter expert databases, with firm-level adjustments to include key manufacturers of avionics, flight simulators, and space-related products as well as providers of aerospace MRO services.
- ISED’s model measures Canada’s economic structure through Statistics Canada’s latest (2021) Input-Output (I/O) economic impact multipliers.
- Aerospace activities have been linked to the closest related specific economic impact multiplier.
- BS336400 Aerospace product and parts manufacturing
- BS488100 Support activities for air transportation
- Aerospace activities have been linked to the closest related specific economic impact multiplier.
- Total economic impact includes industrial activities performed by the Canadian value chain, which is specifically comprised of the aerospace industry (direct economic impact from enterprises for which aerospace is the main activity) and their Canadian suppliers (indirect economic impact from enterprises for which aerospace is not the main activity), and consumer spending by associated employees (induced economic impact) across the Canadian economy.
- GDP impact is reported on an annual basis.
- Jobs impact is reported on an annual basis and is measured in terms of full-time equivalent (FTE) employment.
- Jobs cannot be additive as they are maintained for an extended period after creation.
- Economic impact estimates are reported at the national level and cannot be broken down at the regional level.
- Economic impact estimates are not comparable to older estimates reported in previous publications as past foundational data from government agencies and international subject matter experts are regularly revised and updated.
- All totals are in Canadian dollars.
Annex 2: Main Activities Associated with Canadian Aerospace Manufacturing and MRO Services
Aerospace Manufacturing
Main activities:
- Aircraft assemblies, subassemblies and parts
- Aircraft engines and engine parts
- Aircraft fuselage, wing, tail and similar assemblies
- Tail and wing assemblies and parts (empennage)
- Flight simulators
- Aerospace product prototypes
- Space systems
- Telecommunication satellites and components
- Avionics
- Helicopters, propellers and parts
Aerospace MRO ServicesFootnote 13
Main activities:
- Aircraft heavy maintenance, servicing and repairing
- Aircraft engines maintenance, servicing and repairing
- Aircraft components and other systems maintenance, servicing and repairing
- Aircraft line maintenance (aircraft servicing at airports – excluding sales of fuel revenues)
- Aircraft ferrying services
- Aircraft inspection services
- Aircraft testing services
- Aircraft upholstery repair
- Footnote
-
Excludes MRO activities performed by manufacturers and airlines.
Annex 3: Canadian Aerospace Industrial Indicators (2019–2024)
| Indicator |
Sector |
2019 |
2020 |
2021 |
2022 |
2023 |
2024 |
% Change |
% Change |
|---|---|---|---|---|---|---|---|---|---|
|
Revenues |
Aerospace Manufacturing |
$32.7 |
$24.2 |
$23.1 |
$27.2 |
$33.5 |
$39.6 |
18% |
21% |
|
Aerospace MRO |
$4.2 |
$3.6 |
$3.9 |
$4.7 |
$5.1 |
$5.6 |
10% |
33% |
|
|
Aerospace Total |
$36.9 |
$27.8 |
$27.0 |
$31.9 |
$38.6 |
$45.2 |
17% |
22% |
|
|
GDP |
Aerospace Manufacturing |
$13.1 |
$9.6 |
$9.9 |
$10.1 |
$10.6 |
$10.8 |
2% |
−18% |
|
Aerospace MRO |
$4.9 |
$3.3 |
$3.4 |
$4.1 |
$4.5 |
$4.8 |
7% |
−2% |
|
|
Aerospace Total |
$18.0 |
$12.9 |
$13.3 |
$14.2 |
$15.1 |
$15.6 |
3% |
−13% |
|
|
Jobs |
Aerospace Manufacturing |
60.0 |
57.5 |
54.4 |
56.2 |
56.6 |
57.7 |
2% |
−4% |
|
Aerospace MRO |
32.7 |
26.4 |
25.6 |
29.4 |
32.3 |
34.8 |
8% |
6% |
|
|
Aerospace Total |
92.7 |
83.9 |
80.0 |
85.6 |
88.9 |
92.5 |
4% |
−0.2% |
|
|
R&D |
Aerospace Manufacturing |
$1,151 |
$958 |
$991 |
$893 |
$1,086 |
$1,160 |
7% |
1% |
|
Aerospace MRO |
$43 |
$34 |
$33 |
$38 |
$42 |
$45 |
7% |
5% |
|
|
Aerospace Total |
$1,194 |
$992 |
$1,024 |
$931 |
$1,128 |
$1,205 |
7% |
1% |
Annex 4: Canadian Aerospace Industry Economic Impact (2024)
|
Indicator |
Source of Industrial Activity |
Aerospace Manufacturing |
Aerospace MRO |
Aerospace Industry Total |
|
GDP Economic Impact |
Aerospace Industry |
$10.8 |
$4.8 |
$15.6 |
|
Canadian Suppliers to the Aerospace Industry |
$6.2 |
$5.1 |
$11.3 |
|
|
Aerospace Industry and Value Chain |
$17.0 |
$9.9 |
$26.9 |
|
|
Consumer Spending by Associated Employees |
$4.6 |
$2.7 |
$7.3 |
|
|
Total |
$21.6 |
$12.6 |
$34.2 |
|
|
Jobs Economic Impact |
Aerospace Industry |
57,700 |
34,800 |
92,500 |
|
Canadian Suppliers to the Aerospace Industry |
40,300 |
41,500 |
81,800 |
|
|
Aerospace Industry and Value Chain |
98,000 |
76,300 |
174,300 |
|
|
Consumer Spending by Associated Employees |
30,500 |
20,200 |
50,700 |
|
|
Total |
128,500 |
96,500 |
225,000 |
Annex 5: Share of Canadian Aerospace Industry Employment by Region (2023 vs. 2024)
|
Region |
Aerospace Manufacturing |
Aerospace MRO |
||
|---|---|---|---|---|
|
2023 |
2024 |
2023 |
2024 |
|
|
Western Canada and Northern Canada |
12% |
12% |
38% |
39% |
|
Ontario |
24% |
23% |
35% |
35% |
|
Quebec |
61% |
61% |
21% |
20% |
|
Atlantic Canada |
3% |
4% |
6% |
6% |
Annex 6: Canadian Aerospace Defence Segment Revenues (2018–2022) by Goods and Services Category
|
Short Title |
Aerospace Defence Goods and Services Category |
2018 |
2020 |
2022 |
% Change, |
|
MRO Services |
Military Aircraft Maintenance, Repair, Overhaul, Modernization or Upgrade Services |
$1,203,557,655 |
$1,339,505,777 |
$2,079,143,232 |
73% |
|
Aircraft, Helicopters, and/or Components |
Aircraft Fabrication, Structures and Components |
$738,691,929 |
$1,416,086,478 |
$1,445,924,277 |
96% |
|
Mission Systems |
Primarily Airborne Electro-Optical, Radar, Sonar and Other Sensor/Information Collection Systems; Fire Control, Warning and Countermeasures Systems and Related Components |
$843,888,515 |
$994,181,470 |
$1,071,151,042 |
27% |
|
Primarily Airborne Communications and Navigation Systems; and Other Information Systems (Including Processing and Dissemination), Software, Electronics and Components |
$516,207,452 |
$377,610,671 |
$375,868,525 |
-27% |
|
|
Simulation Systems |
Simulation Systems for Aircraft |
$324,694,686 |
$235,430,669 |
$238,783,900 |
-26% |
|
Unmanned Aerial Systems/Vehicles |
Unmanned Aerial Systems/Vehicles (UAS/V) and Components |
$87,304,058 |
$63,556,985 |
$168,930,867 |
93% |
|
Space Systems |
Military Systems Deployed in Space, Space Launch Vehicles, Land-based Systems for the Operation, Command and Control of Space Launch Vehicles or Systems Deployed in Space and Related Components |
$81,824,130 |
$70,704,636 |
$73,943,779 |
-10% |
|
Total Revenues |
$3,796,168,425 |
$4,497,076,686 |
$5,453,745,622 |
44% |
|
Data Sources
- Economic Impact
- ISED estimates based on latest revised data from Statistics Canada Table 36-10-0434-03 (2019–2024), 2025
- ISED estimates based on latest revised data from Statistics Canada Table 14-10-0220-01 (2019–2024), 2025
- ISED economic model estimates based on Statistics Canada Table 36-10-0594-01 (2021), 2025
- Employment Trends
- See 1(b)
- Regional Breakdown
- Statistics Canada Table 14-10-0202-01 (2023–2024), 2025
- Employment Characteristics
- Statistics Canada’s Labour Force Survey (2024), 2025
- Statistics Canada National Occupational Classification (NOC) 2021 Version 1.0, 2025
- See 1(b)
- Innovation
- ISED estimates based on latest revised data from Statistics Canada Table 27-10-0333-01 and firm administrative data (2019–2024), 2025
- See 1(a-b)
- Civil Aerospace Global Rankings
- FlightGlobal Civil Simulator Census 2021, 2025
- Forecast International Dynamic Workbook for Custom Charts (Civil Aircraft, Rotorcraft, Aviation Gas Turbines) (2024), 2025
- Teal Group Market History (2024), 2025
- Aerospace Defence
- Statistics Canada’s Canadian Defence, Aerospace, Marine and Cybersecurity Industries Survey (2018, 2022), 2025
- Exports Products
- S&P Global, Global Trade Atlas (2024), 2025
- Annex 2
- Statistics Canada North American Industry Classification System (NAICS) Canada 2022 Version 1.0, 2025
- Annex 3
- ISED estimates based on latest revised data from Statistics Canada Table 16-10-0047-01 (2019–2024), 2025
- See 1(a-b)
- See 5(a)
- Annex 4
- See 1(a-c)
- Annex 5
- See 3(a)
- Annex 5
- See 7(a)