
This publication is also available online in HTML in print-ready format at canada.ca/csbfp.
Aussi offert en français sous le titre Loi sur le financement des petites entreprises du Canada - Rapport d'examen détaillé 2014-2019.
To obtain a copy of this publication or an alternate format (Braille, large print, etc.), please fill out the Publication Request form or contact:
Web Services Centre
Innovation, Science and Economic Development Canada
C.D. Howe Building
235 Queen Street
Ottawa, ON K1A 0H5
Canada
Telephone (toll-free in Canada): 1-800-328-6189
Telephone (Ottawa): 613-954-5031
TTY (for hearing-impaired): 1-866-694-8389
Business hours: 8:30 a.m. to 5:00 p.m. (Eastern Time)
Email: ised@canada.ca
Permission to Reproduce
Except as otherwise specifically noted, the information in this publication may be reproduced, in part or in whole and by any means, without charge or further permission from the Department of Industry, provided that due diligence is exercised in ensuring the accuracy of the information reproduced; that the Department of Industry is identified as the source institution; and that the reproduction is not represented as an official version of the information reproduced, or as having been made in affiliation with, or with the endorsement of, the Department of Industry. For permission to reproduce the information in this publication for commercial purposes, please fill out the Application for Crown Copyright Clearance or contact the Web Services Centre (see contact information above).
© Her Majesty the Queen in Right of Canada, as represented by the Minister of Industry, 2020
Table of contents
1. Preface
Small Business Financing Program (CSBFP) is a statutory program designed to facilitate access to financing for Canadian small businesses. Established in 1999, it is governed by the Canada Small Business Financing Act (CSBFA) and administered by Innovation, Science and Economic Development Canada (ISED). As legislated by the CSBFA, the program operates on a statutory five-year review cycle. This report covers the fourth such review period from April 1, 2014, to March 31, 2019.
Please note that this report was developed and finalized during the past year, prior to the COVID-19 pandemic. We acknowledge that the pandemic has had a significant impact on small businesses and the Canadian economy. While the report does not address pandemic-related issues, its recommendations are still largely relevant and timely as a means of seeking to improve access to affordable financing for small businesses in Canada.

2. Executive Summary
The overall purpose of this review is to examine the extent to which the CSBFP has been successful, during the past five years of operation, in facilitating small businesses' access to financing. Specifically, the review considers the degree to which the program has achieved its objectives of:
- helping new businesses get started and established firms to make improvements, modernize and expand, as per the CSBFA; and
- improving small businesses' access to loans that would not otherwise be available or would only be available under less favourable conditions.
A number of background studies were undertaken in support of this review, including an independent program evaluation conducted by ISED's Audit and Evaluation Branch. Key findings of this comprehensive review report follow.
Program Rationale
- The CSBFP continues to be an important, efficient and effective program in helping small businesses, especially younger, smaller and higher risk businesses, access financing that may otherwise have been unavailable.
- There was consensus among stakeholders, which included financial institutions and the small business community at large, that there is a continuing need for a program like the CSBFP.
- The CSBFP is the only national loan loss-sharing program that is accessible across Canada to small businesses in all sectors (except agriculture).
Program Activity and Benefits
- During the review period, the CSBFP facilitated access to over 27,000 loans worth $5.15 billion. Each year, CSBFP lending represents close to 5 percent of all new small business lending in Canada.
- Although program lending levels have declined for over a decade, this trend reversed somewhat during the review period, with increased lending levels in recent years.
- Loans made under the CSBFP are highly incremental. Without the program, over 80 percent of all CSBFP loans would have been denied or only approved under less favourable conditions.
- More than 60 percent of program loans (by value) go to start-up firms less than one year old.
- Cost-benefit and economic impact analyses found that the program has a positive economic impact and that the social benefits generated by the program exceed its social costs.
- Of all businesses included on the PROFIT 500 ranking of Canada's fastest growing companies for 2015 to 2017, approximately 59 companies, or 6 percent, were former CSBFP borrowers.
Revenues and Expenses
- During the 201419 period, 4,359 claims for loss, valued at $280 million, were paid,Footnote 1 while $286 million in fees were collected on all new and outstanding CSBFP loans.
- For the first time, the CSBFP is expected to be fully cost recoverable for loans made during the 201419 review period. As of March 31, 2019, the net surplus to government of program loans made from 201419 is estimated to be $25.6 million over the maximum 1015 year life of the loans.
Program Changes and Design
- In 2014, regulatory amendments were made to reduce the administrative burden of the program and better align the program with conventional lending practices.
- In 2015 and 2016, legislative and regulatory amendments were implemented to increase the maximum loan amount for real property from $500,000 to $1 million, expand program eligibility to small businesses with up to $10 million in gross annual revenues, increase the maximum term for real property loans from 10 to 15 years and further reduce the administrative burden of the program.
- While stakeholders are generally satisfied with program parameters, lower levels of satisfaction were expressed towards the documentation requirements of the program and the $350,000 limit for equipment and leasehold improvement loans.
- Small business support organizations have recommended that borrower eligibility, which is currently restricted to for-profit small businesses, be expanded to include not-for-profit and charitable social enterprises.
- Many stakeholders, including financial institutions, noted that small businesses have an increasing need for flexible cash flow financing for intangible assets and day-to-day expenses, which is not addressed by the current design of the CSBFP.
Program Administration
- The CSBFP is currently delivered by banks, credit unions and caisses populaires. Moving forward, there may be an opportunity to expand this distribution network, without changing key program parameters, to include Fintech platforms and Aboriginal Financial Institutions.
- From an awareness perspective, the majority of loan officers are aware of the CSBFP (98 percent); however, awareness of the program remains very low among small businesses (10 percent).
- By the end of 201819, over 97 percent of CSBFP loans were registered using the online loan registration system (compared with 65 percent at the end of 201314) and 100 percent of claim payments were being paid electronically (compared with only 9 percent at the end of 201314).
Governance and International Programs
- The CSBFP is a public guarantee program that is administered by ISED and the Minister of Small Business, Export Promotion and International Trade, and delivered in partnership with private sector financial institutions. However, more work could be done to increase engagement of public and private sector stakeholders in a systemic way.
- All G7 countries have loan guarantee programs, like the CSBFP, to improve access to small business financing. Aside from the United Kingdom, Canada's loan guarantees for small businesses represent the lowest level of support in both absolute dollars and relative to gross domestic product (GDP).
- With the exception of Canada, all G7 programs offer multiple debt-financing products, such as lines of credit, and many allow financing to be used to fund working capital.
Conclusions and Future Directions
- Going forward, it is important that the CSBFP continues to evolve to meet the current economic environment and changing needs of small businesses.
- This review recommends that consideration be given to making changes to the following areas:
- Increase the maximum loan amount for equipment and leasehold improvements;
- Expand the list of eligible loan classes to include intangible assets and start-up costs;
- Broaden business eligibility to include not-for-profit and charitable social enterprises;
- Add a variable debt product, such as a line of credit, to help finance short-term working capital requirements;
- Expand the lender distribution channel to include organizations such as Aboriginal Financial Institutions and Fintech platforms;
- Increase program awareness and knowledge among lenders and borrowers;
- Advance the CSBFP information technology systems infrastructure;
- Reduce the administrative burden and complexity of the program; and
- Enhance stakeholder engagement in evaluation and review of the CSBFP.
3. Overview of the Canada Small Business Financing Program and Financing Challenges for Small Businesses
3.1 Program Description
The CSBFP is a statutory program that aims "to increase the availability of financing for the establishment, expansion, modernization and improvement of small businesses."Footnote 2 It is governed by the CSBFA and administered by ISED. The CSBFP was established in 1999 to replace the Small Business Loans Program, which began in 1961.
The Government of Canada recognizes the need for small and medium-sized enterprises (SMEs) to have access to financing. The objective of the CSBFP is to facilitate small businesses' access to affordable financing that would not otherwise be available to them or would only be available under less favourable conditions. Specifically, the Government of Canada partners with private sector lenders to share the risk of lending to help fill gaps in the credit market for SMEs. The increase in the amount of financing extended to small businesses under the program is expected to ultimately stimulate economic activity and create jobs for Canadians.
Under the CSBFP, Canadian small businesses with gross annual revenues of up to $10 million can receive term loans to finance real property, equipment and leasehold improvements. Farming,Footnote 3 not-for-profit, charitable and religious organizations are not eligible. Borrowers can finance up to $1 million, of which a maximum of $350,000 can be used for equipment and leasehold improvements. The maximum government coverage period is 15 years for real property and 10 years for equipment and leasehold improvements. Furthermore, the maximum allowable interest rate under the program is the prime (or residential mortgage) rate plus 3 percent. See Appendix A for key CSBFP parameters.
The CSBFP is a national program and is available in all provinces and territories. To access the program, small businesses apply directly to the lender of their choice. Financial institutions, which include banks, credit unions and caisses populaires, are responsible for all credit decisions and for applying the same due diligence to CSBFP loans as they do for conventional loans. Once the loan is approved, the borrower receives the funds from the lender, not the government, and the lender registers the loan with ISED. In the event of a default, lenders must realize on all securities and guarantees to reduce the loss before submitting a final claim for payment, along with all necessary documentation, to ISED. ISED reviews all claims and pays the lender up to 85 percent of eligible losses.
3.2 Small Business and the Financial Marketplace
Small businesses account for the majority of enterprises in Canada and drive job creation, productivity and growth in the economy. As of December 2017, there were 1.18 million employer establishments in Canada, 97.9 percent of which were small businesses (i.e., fewer than 100 employees).Footnote 4 These small businesses employed more than 8.3 million people, or close to 70 percent of the private sector labour force. Small businesses are also key drivers of job creation, accounting for 67.5 percent of net employment growth between 2013 and 2017.
Small businesses must have access to capital to start up, expand and modernize. In 2017, new small business credit disbursements (i.e., lending under $1 million) accounted for $25.2 billion.Footnote 5 The value of CSBFP lending in the same year (201718) was $1.2 billion, which represents close to 5 percent of all new small business lending in Canada.
In 2017, approximately 47 percent of SMEs in Canada requested external financing.Footnote 6 About one quarter sought debt financing (e.g., mortgages, term loans, lines of credit or credit cards), while the remainder sought trade credit, leasing and equity financing. Of those small businesses that did not seek any type of financing, 91 percent reported that financing was not needed.
In terms of how firms plan to use borrowed funds, most SMEs stated that they intended to use the funds to support working and operational capital expenditures (62 percent), to purchase machinery/equipment (25 percent) and to purchase land/buildings (15 percent).Footnote 7 While purchases of equipment and property have remained fairly stable since 2011 (26 percent and 17 percent respectively), the percentage of businesses indicating that financing was to be used for working capital has grown (51 percent in 2011), signifying that there is an increasing need for financing to cover day-to-day operating expenses.
3.3 Challenges in Accessing Financing
The credit market for business financing in Canada has been strong for the past several years according to available data; however, stakeholders have indicated that it remains difficult for some small businesses, particularly younger and smaller businesses, to access the financing they need to start, expand and modernize. The main reason that SMEs experience more difficulty in obtaining credit is "information asymmetry" — SMEs are unable to provide detailed information on their creditworthiness as they lack collateral and a credit history.Footnote 8 This lack of information creates reluctance among financial institutions to lend as there is uncertainty about the integrity of the borrower and potential future returns. In addition, small businesses tend to have a higher mortality rate and are more vulnerable to changes in economic conditions than medium-sized and large businesses, which also factor into a lender's decision regarding whether or not to approve financing requests.Footnote 9 The combination of these factors leads to a difference between the demand for financing and the supply of funds, which is referred to as the "financing gap for SMEs."Footnote 10
Over the past nine years, approximately 24 percent of Canadian small businesses, on average, request debt financing each year. Of those that request financing, 85 percent are approved and 15 percent are not approved. Those that are approved receive approximately 87 percent of the amount requested. These statistics have been fairly stable over the past nine years (Table 1). The main reasons given by lenders for not approving debt-financing requests were insufficient sales or cash flow (41 percent), insufficient collateral (32 percent), project too risky (29 percent) and poor or lacking credit history (28 percent).Footnote 11 While there is likely a small portion of requests that will be denied due to poor business plans, there is also a small share of "discouraged borrowers" with good business plans that may not request financing due to the cost and difficulty of obtaining it or the belief that their request would be turned down.
| Year | Request rate (%) | Approval rate (%) | Authorized-to-requested ratio (%) |
|---|---|---|---|
| 2009 | 14 | 79 | 72 |
| 2010 | 18 | 88 | 88 |
| 2011 | 25 | 88 | 90 |
| 2012 | 26 | 89 | 90 |
| 2013 | 30 | 85 | 89 |
| 2014 | 28 | 81 | 83 |
| 2015 | 23 | 88 | 93 |
| 2016 | 26 | 82 | 86 |
| 2017 | 26 | 87 | 93 |
| Sources: Industry Canada / Innovation, Science and Economic Development Canada, Credit Conditions Survey (2009, 2010, 2012, 2013, 2015, 2016) and Statistics Canada, Survey on Financing and Growth of Small and Medium Enterprises (2011, 2014, 2017). | |||
The data indicate that while small businesses in Canada are generally successful at raising necessary funds, certain categories of small businesses continue to face difficulties accessing financing. Various business characteristics, such as size, age and industry, impact the ability of a small business to access financing due to the risk level associated with each of these factors. See Appendix B for approval rates for debt financing in Canada categorized by business characteristics.
Larger (i.e., more employees) and older businesses, on average, tend to have higher approval rates and receive loans closer to their full requested amount when compared with smaller and younger businesses.Footnote 12 Small start-ups are often deemed to be riskier due to their lack of credit history, managerial experience and collateral, which makes it difficult for them to access financing. In fact, of businesses two years old and younger that were denied debt financing, 64 percent indicated that a lack of credit history was the reason given for the refusal.Footnote 13 This is a key gap in financing as start-ups represent about 10 percent of SMEs within Canada.Footnote 14
While financing request rates are similar across industries, approval rates and loan terms vary by sector. The highest approval rates, on average, over the past nine years are in the agriculture, forestry and mining sectors (92 percent) and the construction sector (90 percent). In contrast, the lowest approval rates are in the accommodation and food services sector (80 percent), followed by the retail trade sector (83 percent) and the transportation and warehousing sector (85 percent).
Overall, while Canada has a good credit market and good conditions for business, some small businesses have more difficulty accessing financing than others due to their characteristics, sectors and regions. Certain firms face greater challenges because of more volatile sales and earnings, higher loan default rates, fewer assets to pledge as collateral and shorter credit histories. In addition, an imbalance of information and a lack of understanding about a small business' operations can make it difficult for lenders to assess the financial and operational risk of the business.Footnote 15 In these situations, lenders often charge higher interest rates, offer lower loan amounts or demand more collateral to cover potential losses. Many young and small businesses are often unable to afford these terms or do not have any collateral to offer, so they find themselves unable to access financing. Due to these gaps, governments at various levels have introduced programs and initiatives to provide federal/provincial support and encourage private sector lending to small businesses.
4. Changes to the Canada Small Business Financing Program
4.1 Comprehensive Review Report 20092014
The Comprehensive Review Report 20092014 revealed a number of key findings:
- The CSBFP remained an important program in helping small businesses, particularly higher risk businesses (e.g., start-ups), access financing that may otherwise have been denied.
- The CSBFP registered nearly 34,000 loans, with a value of $4.7 billion, from 200914. However, program usage declined from over 48,000 loans registered, worth more than $5 billion, from 200409.
- CSBFP loans were highly incremental, with approximately 58 percent of loans (by value) going to start-up firms less than one year old.
- Cost recovery improved, with fee revenues expected to offset 82 percent of the cost of claims for loss, for CSBFP loans made from 200914.
- Program awareness remained low among small businesses.
In response to stakeholder concerns raised in the 200914 report, a package of regulatory amendments was developed during the review period and implemented on April 1, 2014. These changes sought to improve program uptake by lenders by addressing program irritants, such as administrative burden, and better aligning the CSBFP with conventional lending practices. Specifically, some of the changes included allowing lenders to charge conventional lending fees, reducing the amount of proof of purchase documentation required during claims procedures and deregulating the maximum financing percentage.
In terms of program design, stakeholders stated (through interviews and roundtable discussions) that they were generally satisfied with the program, but that certain parameters, such as the $500,000 limit on lending for real property and the $5 million revenue cap for program eligibility, may no longer be appropriate for current market conditions. Small businesses also expressed a need for flexible cash flow financing to help them start and grow their business, which is currently not met by the fixed-term asset-based financing option under the CSBFP.
4.2 Legislative and Regulatory Amendments
Following an announcement in Budget 2015, program officials developed a package of amendments to the CSBFA and its regulations. The purpose of these amendments was to increase the amount of financing available, allow more small businesses to apply for CSBFP loans and further reduce the administrative burden of the program.
On June 23, 2015, legislative amendments were implemented to:
- increase the maximum loan amount for real property from $500,000 to $1 million; and
- expand program eligibility to small businesses with gross annual revenues of $10 million or less, up from $5 million or less.
In addition, regulatory changes, which were developed to go hand-in-hand with the legislative amendments, came into force on February 19, 2016. Key changes included:
- increasing the maximum term for real property loans from 10 to 15 years;
- extending the claim submission period from 36 to 60 months; and
- removing the requirement for leasehold improvements to be secured by a mortgage where the borrower and landlord are not at arm's length.
5. Performance Review
5.1 Approach
A number of research studies and ongoing internal analyses were carried out to inform the review of the CSBFP. They can be grouped into the following categories:
Program evaluation
An independent program evaluation was conducted by ISED's Audit and Evaluation Branch based upon a performance measurement strategy that the Treasury Board of Canada Secretariat recommends be used for assessing major policies, programs and initiatives.Footnote 16
Stakeholder discussions and surveys
Awareness and satisfaction surveys of lenders, small businesses and CSBFP borrowers were conducted. Interviews with ISED officials, financial institutions (including both frequent and less frequent users of the program), small business associations and support organizations, and academic experts were conducted as part of the program's evaluation and this review.
Economic impact and benefits analyses
Studies were undertaken on the program's incrementality, economic impact and benefit-cost ratio.Footnote 17
Cost recovery analysis
Lending, default and claim experiences under the CSBFP were examined and cost recovery forecasts were developed based upon various statistical models.
5.2 Program Activity
The CSBFP has successfully helped many new businesses get started and established firms make improvements and expand. Over the 201419 review period, the CSBFP facilitated access to over 27,000 loans to small businesses, representing $5.15 billion. The average loan size during this period was about $188,000.
The profile of CSBFP loans over the 201419 period had the following characteristics:
- Start-up businesses, less than a year old, were the primary recipients of CSBFP lending, receiving $3.2 billion (62 percent of total loan value);
- The majority of businesses had gross annual revenues of $1 million or less (73 percent);
- Loans were used for leasehold improvements (41 percent), equipment (34 percent) and real property (25 percent);
- Most lending (by value) went to small businesses in the accommodation and food services (39 percent), retail trade (13 percent) and transportation and warehousing (6 percent) sectors; and
- From a geographic perspective, lending under the program generally mirrored the population distribution of SMEs by province and territory, with the exception of British Columbia, with the majority of lending going to borrowers in Ontario and Quebec (Figure 1).
Figure 1: Percentage distribution of CSBFP borrowers (201419) versus the Canadian SME population by region (2017)
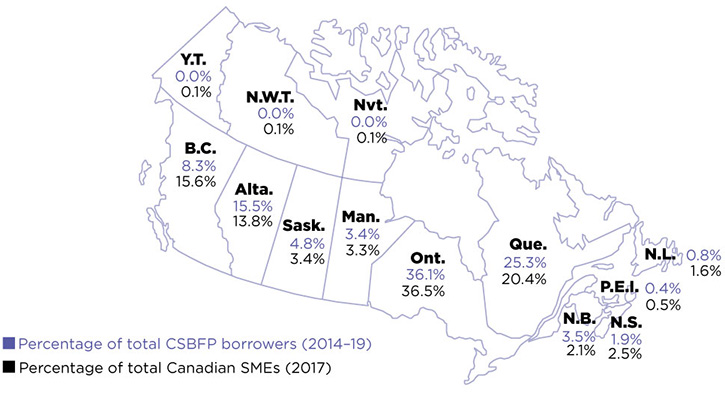
The CSBFP is demand-driven and does not target any particular region or sector. As such, any variations in program uptake reflect choices made by lenders and borrowers.
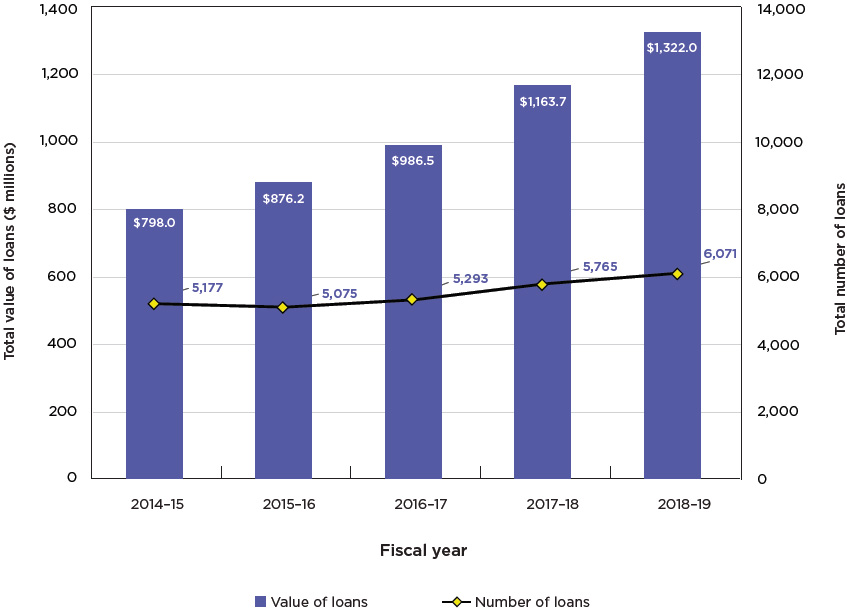
While overall program loan values were in decline for over a decade from 200405 to 201415, this trend has reversed as lending levels have increased in recent years (see Figure 2). For instance, in 201819, the CSBFP facilitated 6,071 loans worth over $1.3 billion in new lending, which represents an increase of 66 percent in total loan value from 201415. This increase is mainly due to the legislative and regulatory changes made in 2015 and 2016 that increased the maximum loan amount for real property from $500,000 to $1 million and the associated maximum coverage period from 10 to 15 years. However, although the value of lending has increased, the number of businesses that received program loans has decreased by 19.5 percent when compared with the 200914 review period. There are several possible reasons for this trend — small businesses do not know about the program as awareness remains low, lenders do not use the program if they perceive the administrative burden is too high or the profitability is too low, or the program is becoming less relevant as eligible loan classes are not keeping pace with the financing needs of modern and innovative small businesses, which increasingly require financing for intangible assets and working capital.
Figure 2: Number and Value of CSBFP Loans, 2014–19
5.3 Incrementality
The program's primary objective is to facilitate lending to small businesses by extending financing that would not otherwise be available to them (full incrementality) or would only be available under less favourable conditions, such as higher interest rates, lower loan amounts, shorter loan terms, additional collateral requirements and more borrower equity (partial incrementality).
ISED employs two separate studies to estimate the level of incrementality of the CSBFP: the Incrementality Study of the CSBFP and the Lender Awareness and Satisfaction Study. The incrementality study only examined full incrementality and found that the CSBFP is 69 percent fully incremental.Footnote 18 In other words, over two thirds of debt-financing requests from small businesses receiving CSBFP loans would have been denied without the existence of the program, which is consistent with results from previous studies. This methodology was repeated using different threshold approaches to determine whether CSBFP borrowers would have been approved or rejected without the program and findings revealed that full incrementality ranged from 50 to 70 percent.
The lender awareness and satisfaction study examined levels of both full and partial incrementality of the CSBFP. Using survey responses from lenders who had direct experience with the program, the study found that half of all loans (51 percent) would not have been approved without the program and another third (30 percent) would only have been approved under less favourable conditions.Footnote 19 Lenders indicated that the less favourable conditions would have included smaller loan amounts, increased borrower equity, greater collateral requirements, shorter amortization periods and/or higher interest rates. These results are consistent with findings from the 2014 Lender Awareness and Satisfaction study.Footnote 20
When both studies are taken into consideration, the overall level of incrementality of the CSBFP (both full and partial) is estimated to be over 80 percent.
5.4 Economic Benefits
The goal of loan guarantee schemes around the world is to facilitate access to financing for credit-constrained businesses and improve overall credit conditions. The expectation is that extending financing that would not otherwise have been approved (i.e., incrementality) will provide firms with necessary capital while also generating direct and indirect economic and social benefits for the recipient businesses, such as employment and production, and benefits to the overall economy. To determine the CSBFP's effectiveness and efficiency, an economic impact analysis and a cost-benefit analysis are conducted every few years to inform the evaluation and comprehensive review of the program.
The economic impact analysis of the CSBFP found that program borrowers, when compared with similar non-borrowers, experienced greater economic growth in terms of revenues, profits and employment.Footnote 21 CSBFP participants also had a higher two-year firm survival rate compared with their counterparts. However, these estimates should not simply be interpreted as causal because there may be other factors related to growth that are not controlled for. Therefore, it cannot be concluded from the results that CSBFP borrowers grew faster because they received program loans; rather the results indicate that CSBFP borrowers grew faster, controlling for many, but likely not all, factors related to firm growth.
Results from the cost-benefit analysis indicate that the social benefits of the CSBFP exceed the social costs. The results are driven largely by the estimated GDP impacts of the program, which arise when CSBFP borrowers receive incremental loans through the program and use these loans to finance investments that would not otherwise be possible. When GDP impacts are taken into consideration, it is estimated that the program's net social benefits exceeded social costs by nearly $4 billion over the nine-year evaluation period, or $350 million or more annually.Footnote 22 In other words, every dollar spent on program costs contributes an additional five dollars of benefits (i.e., a 5:1 benefit-cost ratio). When these GDP impacts are excluded, the net social benefit is still positive, though more modest, with benefits exceeding social costs by nearly $900 million over the nine-year evaluation period, or an average of roughly $100 million per year. Therefore, every dollar spent on program costs contributes an additional two dollars of benefits (i.e., a 2:1 benefit-cost ratio).
The findings of these studies are further corroborated through evidence from the CSBFP's awareness and satisfaction study. The study asked borrowers if the CSBFP loan they received impacted their business positively, negatively or not at all. Specifically, borrowers were asked to examine the impact the loan had on the business' ability to start up, grow, increase sales and/or profits, increase productivity or efficiency, increase employment levels and stay in business. In each case, the majority of borrower respondents indicated that the loan they received from the CSBFP had a positive impact on their business, most noticeably on their businesses' ability to start up (81 percent), grow (75 percent) and stay in business (72 percent).Footnote 23
Finally, ISED compared borrowers in the CSBFP database with the PROFIT 500 ranking of Canada's fastest growing companies for 2015 to 2017. Of the 975 unique businesses captured on the PROFIT 500 rankings for all three years, approximately 59 companies, or 6 percent, were identified as former CSBFP borrowers.
5.5 Revenues and Expenses
The main expenses of the program are claim payments made by ISED to lenders when a loan defaults. Loans made in any given year, however, can default at any time over the potential 1015 year term of loans. To help offset these costs, the CSBFP collects an upfront 2-percent registration fee and an annual 1.25-percent administration fee on all loans. As the CSBFP is a statutory program, all fee revenues and claims for loss flow directly in and out of the Consolidated Revenue Fund.
Claim Expenses
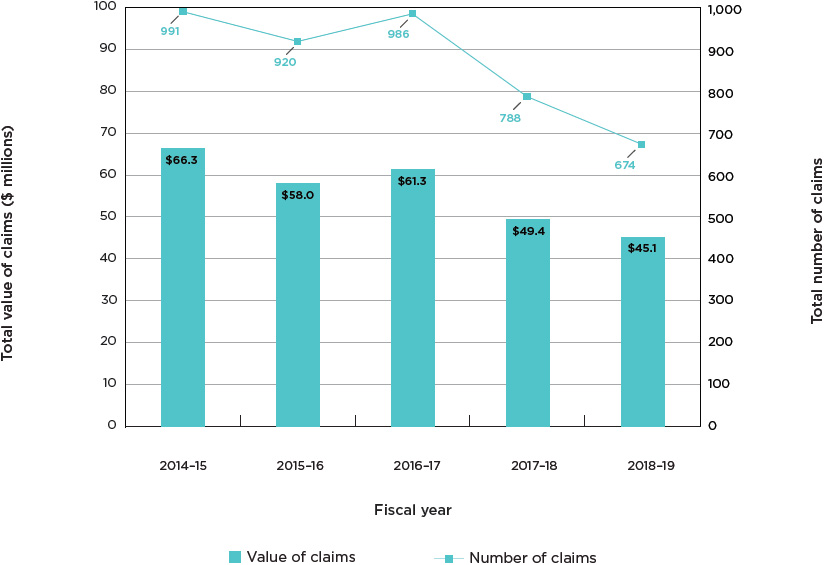
From 201419, 4,359 claims (valued at $280 million) were paid to lenders, averaging $64,246 per claim (Figure 3). These claim payments reflect losses that were incurred during the review period on defaulted CSBFP loans made since 2004. To protect the government from unexpected expenses, a cap is placed on claims paid, which is based upon the total value of loans registered by each lender within a five-year period. For most lenders, the cap is approximately 12 percent of their CSBFP loan portfolio. The current cap appears to be set at an appropriate level as no lenders are expected to reach their cap for this review period. To a large extent, this is due to a positive economic environment, which has resulted in reduced claims during this review period.
Figure 3: Number and Value of CSBFP Claims (2014–19)
Operating Costs
In addition to paying claims for losses, the program's operating costs are approximately $2.4 million annually for a staff of 23. The program facilitated over $1 billion annually in financing for small businesses over the 201419 period.
Fee Revenues
Over the 201419 period, $286 million in program fees were collected. These fees include the 2-percent registration fees ($101 million) collected on loans made during the review period and the 1.25-percent annual administration fees ($185 million) collected during the review period on all outstanding CSBFP loans made since 2004.
Cost Recovery
Cost recovery under the CSBFP refers to the extent to which program revenues from fees help to offset program expenses from claims. The importance of carefully monitoring the financial performance of the loan portfolio and regularly updating the program's cost recovery model has been reinforced by the Office of the Auditor General.
To estimate the level of cost recovery, ISED, in conjunction with academics, has developed forecasting models that use multivariate analysis of claims received in a given month combined with statistical and econometric-based models to project future claims against forecasted revenues. ISED updates its forecasting models on a regular basis to ensure they reflect the most recent economic conditions and they are vetted by the Office of the Auditor General.
As of March 31, 2019, the CSBFP, for the first time, is expected to be fully cost recoverable for loans made during the 201419 review period over the potential 1015 year life cycle of the loans. Specifically, it is estimated that the program will be 108 percent cost recoverable, with a net surplus of almost $26 million on $5.15 billion of lending to SMEs. As a percentage of total lending, this represents a net cost to government of -0.5 percent. Taking into consideration the time value of money, on a net present value (NPV) basis, the program is expected to be 119 percent cost recoverable for the 201419 lending period, with a net surplus of almost $48 million. However, it is important to note that this is not a permanent state as cost recovery is variable and depends upon a variety of factors (e.g., state of the economy, type of lending, level of defaults, etc.).
See Appendix D for more information on cost recovery of the CSBFP.
5.6 Program design and administration
Program Design
In terms of the overall design and administration of the CSBFP, lenders have expressed high levels of satisfaction with the program's policies and services provided by ISED.Footnote 24 Small business borrowers also reported being generally satisfied with the program and almost all (90 percent) said that they would consider using the program again.Footnote 25
Stakeholder feedback, however, revealed some areas for improvement. Some lenders expressed dissatisfaction with the administrative burden of the program, particularly the documentation required and difficulty associated with completing forms. In addition, both lenders and small businesses recommended increasing the $350,000 maximum loan amount for equipment and leasehold improvements. The $350,000 limit has not been changed since 2009 and it may no longer reflect current costs of equipment and leasehold improvements.
Another recommendation that arose was to broaden borrower eligibility under the CSBFP, which is currently limited to for-profit small businesses, to include not-for-profit and charitable social enterprises. This recommendation was made by small business support organizations and included in the federal government's Social Innovation and Social Finance Strategy as a means to improve social purpose organizations' access to federal business support programs.
Furthermore, the CSBFP is currently restricted to providing term loans for fixed asset loan classes (real property, equipment and leasehold improvements) and does not offer a variable debt product, such as a line of credit, to address cash flow financing needs. When surveyed, less than half of program borrowers found it reasonable that the CSBFP solely offers term loans and restricts lending to the above-mentioned loan classes.Footnote 26 Lenders also expressed a need to expand the program to include additional loan classes as businesses increasingly require financing for expenses beyond "brick and mortar" assets. Specifically, stakeholders identified that modern and innovative small businesses need help accessing funding to purchase intangible assets, including intellectual property, and cover start-up costs and working capital, including expenses related to inventory, supplies and marketing. This sentiment was reflected in the Comprehensive Review Report 20092014, with small businesses expressing a need for flexible cash flow financing to help them start and grow their business, which is currently not met by the asset-based financing options under the CSBFP.
Overall, while the majority of lenders and small business borrowers continue to express high levels of satisfaction with the design of the CSBFP, there are areas of improvement that could be explored, moving forward, to ensure that the program is delivered efficiently to continue to fulfill its mandate and help Canadian small businesses adapt to the realities of the digital economy.
Awareness of Program
Program awareness among loan officers in financial institutions is very high, with the vast majority (98 percent) reporting that they have heard of the CSBFP.Footnote 27 Their level of awareness and knowledge of the program's specific terms and conditions, however, such as eligibility criteria, maximum loan amounts and the percentage covered by the government in the event of loan defaults, was lower overall, highlighting an area for improvement.
In contrast, CSBFP awareness continues to remain very low among small businesses in general (10 percent in 2018 compared with 12 percent in 2013) and even among those small businesses that have previously obtained a loan under the program (29 percent in 2018 compared with 41 percent in 2013).Footnote 28 As small business borrowers must apply directly to lenders to access the CSBFP, financial institutions are the front-facing service delivery channel of the program, so borrowers do not interact directly with ISED. As such, small business borrowers may not realize that their loan is part of a government program despite completing an application process that includes a CSBFP registration form.
Delivery Channels
The CSBFP is delivered by private sector lenders in every province and territory across Canada. The CSBFA defines a "lender" for the purposes of the program as a member of the Canadian Payments Association or any other organization designated by the Minister of Small Business, Export Promotion and International Trade. For situations where a lender requires designation from the Minister, the program has a "Policy Respecting Designation of Lenders," which outlines six specific criteria that should be taken into consideration before designating a lender.Footnote 29
Program lenders are currently limited to banks, credit unions and caisses populaires, which allows them to offer program loans to Canadian small businesses, register the loans with ISED and submit claims for payment in the event of loan defaults. The online alternative finance market, however, which is delivered by Fintech platforms, has emerged in recent years to complement traditional sources of financing and is rapidly expanding as they are able to offer efficient financing options to small businesses through the use of online applications.Footnote 30 In addition, Aboriginal Financial Institutions, which are autonomous, Indigenous-controlled, community-based financial organizations, are also a key source of financing for First Nations, Métis and Inuit businesses and are available in all provinces and territories. While Fintech platforms and Aboriginal Financial Institutions are becoming important providers of SME financing in Canada, they are not currently considered lenders under the CSBFP. To be allowed to offer program loans to small businesses, individual Fintech platforms and Aboriginal Financial Institutions would have to apply to the CSBFP for an assessment to determine if they meet the criteria to be designated a lender by the Minister of Small Business, Export Promotion and International Trade.
Advancing CSBFP Information Technology Systems Infrastructure
During the previous lending period (200914), ISED launched the CSBFP Online Loan Registration Application to increase efficiency and reduce administrative burden by enabling participating lenders to electronically transfer/receive loan registrations, program fees and claim payments. This joint venture with Agriculture and Agri-Food Canada's (AAFC) Canadian Agricultural Loans Act (CALA) Program, a loan guarantee program similar to the CSBFP that targets the farming sector, led the way for innovation in the delivery of services to Canadians. It transformed what were once manual paper-based/cheque-based processes for administering the program into a completely electronic front-end solution that is easier, faster and less expensive for both government and financial institutions.
Some of the benefits of the initiative include:
- Increased efficiency: electronic transmission means quicker processing of loan registrations (reducing 35 days to register a loan to seconds);
- Reduced administrative burden and costs: reduction in manual processes, paper, cheques and costs for financial institutions and the CSBFP (reducing 5,0007,000 paper registrations/cheques per year to less than 300);
- Improved service delivery: improvements to data integrity, with fewer errors and less time spent on follow-up calls; and
- Common platform: the same platform is used for both ISED's CSBFP and AAFC's CALA Program (reducing maintenance costs for government by $400,000 per year), thereby reducing time and effort spent by financial institutions on adopting, integrating and operating two different systems.
The Comprehensive Review Report 2009 2014 specifically indicated that ISED should continue to assist lenders in taking advantage of the CSBFP Online Loan Registration Application to transfer loans, fees and claim payments electronically. As of March 31, 2019, most major lenders were using the application:
- 97 percent of loan registrations and fees were being transferred electronically to the CSBFP (up from 65 percent at the end of 201314); and
- 100 percent of claim payments were being transferred electronically to lenders (up from 9 percent at the end of 201314).
Going forward, there may be opportunities to further increase efficiency, improve service delivery and reduce administrative burden by enabling lenders to electronically submit claim applications in a secure document transfer environment.
6. Governance and International programs
Loan loss-sharing programs like the CSBFP, also known as credit guarantee schemes, are a popular tool used by governments around the world to facilitate the availability of financing for small businesses. However, governance structures, policies, products and level of government involvement vary greatly between programs. The following examines different types of loan loss-sharing programs and international best practices.
6.1 Governance Structures
The Organisation for Economic Co-operation and Development (OECD) has defined three different credit guarantee scheme structures: public, publicprivate and private.Footnote 31 The CSBFP was established and continues to be administered as a public guarantee scheme, which means that it is a direct government initiative and the guarantee is publicly funded. Another example of a public guarantee scheme is the U.S. Small Business Administration (SBA) 7(a) loan program, which is the equivalent of the CSBFP. In contrast, some countries, such as France, have publicprivate guarantee schemes in which the private sector is more involved in the program, but the public sector remains the majority shareholder.
Although the CSBFP is categorized as a public guarantee scheme based upon the OECD definition, the private sector does play a role. Specifically, the program is delivered in close partnership with the private sector. The federal government, through ISED, is responsible for administering the program, including legislation, regulations, policy and program guidelines; loan registrations; and claims processing. In addition, the government covers 85 percent of losses when a loan defaults, which are offset by registration and administration fees. Private sector financial institutions, on the other hand, are responsible for all credit assessments and decisions, funding loans, and realizing on all assets and guarantees to reduce the loss when a loan defaults. Lenders also carry some financial risk as they are responsible for 15 percent of the loss in the event of a default.
From a governance perspective, the CSBFP is delivered and administered by the federal department of ISED, as opposed to a separate agency or development bank, and there is no board of directors. Policy decisions and operational management are carried out internally and overseen by the Minister of Small Business, Export Promotion and International Trade. This is similar to its SBA counterpart in the United States. France's loan guarantee program, on the other hand, is delivered by its public development bank, known as Bpifrance, which operates under the guidance of a board of directors.
While the CSBFP does not have a board of directors, it does consult extensively with stakeholders through surveys, discussions and interviews, and their input informs the program evaluation and the comprehensive review, including recommendations for future directions. However, more effort could be made to increase involvement of both public and private stakeholders in overseeing the CSBFP on a systemic basis as they offer important perspectives that are beneficial to management of the program.
6.2 Comparison of the Canada Small Business Financing Program with other International Programs
In addition to Canada, all G7 countries have one or more credit guarantee programs to help small businesses access financing. Table 2 illustrates the value of new government loan guarantees in each G7 country, as well as the proportion of loan guarantees in relation to each countries' GDP and total outstanding SME business loan balance. It is noteworthy that, with the exception of the United Kingdom, Canada's loan guarantees for small businesses represent the lowest level of support of all G7 countries reporting in both absolute dollar terms and relative to GDP and total outstanding SME business loans.
| Country | Government loan guarantees for SMEs (2017) | Conversion to Canadian dollars ($ billions) | Loan guarantees as a percentage of GDP (2017) | Loan guarantees as a percentage of outstanding SME loans (2017) |
|---|---|---|---|---|
Sources: Organisation for Economic Co-operation and Development, Financing SMEs and Entrepreneurs 2019: An OECD Scoreboard, 2019; and OECD Data, Gross domestic product (GDP). | ||||
| CanadaFootnote * | CAD 1.4B | 1.4 | 0.06 | 1.4 |
| France | EUR 8.9B | 13.0 | 0.32 | 3.7 |
| GermanyFootnote ** | Unavailable | |||
| Italy | EUR 17.5B | 25.7 | 0.76 | 10.3 |
| Japan | JPY 22.2T | 278.1 | 3.8 | 8.1 |
| United Kingdom | GBP 0.22B | 0.36 | 0.01 | 0.2 |
| United States | USD 32B | 42.7 | 0.16 | 5.2 |
International credit guarantee schemes also vary greatly in their scope and parameters, and they are continually being revised to keep up with shifting needs of small businesses in their respective countries. While the CSBFP is restricted to term loans for real property, equipment and leasehold improvements, many other international programs allow guaranteed funds to be used to purchase intangible assets and to cover operational costs. Almost all G7 countries, with the exception of Canada, offer additional debt-financing products, such as lines of credit in addition to term loans, with a view to better assist SMEs with their day-to-day expenses. For example, the SBA's 7(a) loan program provides guarantees on small business loans that can be used to fund property, equipment, working capital, business acquisition or debt refinancing. Under the umbrella of the 7(a) loan program, the SBA also offers a CAPLines program that allows small businesses to access fixed or revolving lines of credit for cyclical or short-term working capital needs. These international programs provide interesting models that the CSBFP could consider adopting, such as working capital financing and lines of credit, to ensure that the program evolves to meet various financing needs of small businesses in Canada.
7. Conclusions and Future Directions
The CSBFP is a federal program designed to improve access to financing for Canadian small businesses to help them start up, expand, modernize and improve. Loan guarantee programs, such as the CSBFP, are widely used around the world to help small businesses as they often have difficulty accessing financing due to a lack of credit history, collateral and detailed financial statements.
While credit markets and economic conditions in Canada have been fairly good in recent years, there is evidence that a significant number of Canadian small businesses still face challenges accessing debt financing. These businesses include younger businesses (i.e., start-ups and businesses less than 3 years old), smaller businesses (i.e., fewer than 20 employees), businesses with little/no collateral and businesses with little/no credit history. Also included are businesses in riskier industry sectors and businesses requiring financing for less tangible assets. In addition, some small businesses choose not to apply for financing because they think they will be turned down, applying is too difficult and the cost of financing is too high.
SMEs are an essential part of the Canadian economy and require financing to start up, survive and grow. To help fill the credit gap for higher risk small businesses and encourage financial institutions to lend to these businesses, governments have federal and provincial programs in place to help small businesses gain access to financing. The CSBFP, however, is unique in that it is the only loan loss-sharing program that operates in all provinces and territories, is open to all sectors (except agriculture) and leverages financial institutions to fund loans that would otherwise be unavailable. Studies have shown that CSBFP loans are over 80 percent incremental when both full and partial incrementality are taken into account. This means that in the absence of the program, financing would not have been approved or would only have been approved under less favourable terms. This financing is being provided at very little cost to government and has been shown to have positive benefits and impacts on the Canadian economy.
This comprehensive review of the CSBFP from 201419 has demonstrated that the program continues to be a successful and efficient mechanism to assist Canadian small businesses, particularly start-ups, with accessing debt financing. The recent evaluation of the CSBFP also concluded that the program addresses "a demonstrable need to facilitate SME access to financing" and there continues to be a "need for a program that shares the risk of lending to higher risk SMEs."Footnote 32 Despite its sustained relevance, however, the Government of Canada recognizes that in order to remain relevant and better meet the needs of modern and innovative Canadian small businesses, the CSBFP must continue to evolve and modernize.
Based upon feedback from program stakeholders and recommendations from the program evaluation, this review recommends that consideration be given to making changes to program parameters in the following areas:
Increase the Maximum Loan Amount for Equipment and Leasehold Improvements
Consideration could be given to adjusting the maximum loan amount for equipment and leasehold improvements, which is currently $350,000. Lenders have identified that the current limit is too low and does not account for the rising costs of these assets. In terms of risks, higher loan amounts generally lead to higher claim amounts. However, the overall percentage of claim values in relation to overall loan values is not expected to change and fees would help to offset some losses. If the maximum loan amount is increased, the maximum coverage period may also need to be increased to ensure that loans remain affordable for borrowers.
Expand Eligible Loan Classes
In line with recent OECD recommendations and feedback from both financial institutions and Canadian SMEs,Footnote 33 consideration could be given to expanding eligible loan classes to include intangible assets, such as intellectual property (IP)Footnote 34 (e.g., patents, copyrights, trademarks) rights and assets, and start-up costs (e.g., marketing, inventory, franchise fees). This change would allow the program to better meet changing needs of small businesses, particularly innovative and growth-oriented SMEs, which often require financing for intangibles and start-up costs, rather than solely tangible assets. In terms of risks, intangible assets and costs are not expected to perform as well as current loan classes as they are more difficult to realize on in the event of a default than real property and equipment. As such, the loss-sharing ratio may also need to be re-examined.
Broaden Business Eligibility to Include Not-for-Profit and Charitable Social Enterprises
CSBFP eligibility, which is currently limited to for-profit businesses, could be opened up to include not-for-profit and charitable social enterprises. This change would eliminate an unnecessary program restriction and improve social purpose organizations' access to federal business development programs. There are no additional anticipated risks with this proposed change as loans to not-for-profit and charitable social enterprises are expected to perform as well as loans to for-profit small businesses.
Add a Variable Debt Product
The CSBFP could explore adding a variable debt product, such as a line of credit, to its product offerings to better meet the working capital needs of small businesses. Through past consultations, small businesses have highlighted the need for line of credit financing and lenders have identified that they are interested in offering this product. In addition, this would align with the financing tools offered by other international loan guarantee programs, such as the SBA CAPLines program in the United States. Variable debt products are considered riskier than term loans as there are generally lower recoveries during the realization process in the event of a default. To mitigate some of the risk, the program may explore a different maximum lending amount, fee structure, interest rate or loss-sharing ratio for these lending products.
In addition, ISED officials will continue to strengthen relationships with stakeholders in the following areas:
Expand the Lender Distribution Channel
The CSBFP will consider designating Aboriginal Financial Institutions and individual Fintech platforms as lenders under the program provided that they are able to meet all program parameters to provide businesses with more options for accessing affordable financing through program loans. Initial research indicates that some institutions and platforms already have an established track record and seem to be able to meet the requirements of the program. No additional risks are anticipated regarding this proposed change.
Increase Program Awareness and Knowledge among Lenders and Borrowers
While lenders are generally aware of the CSBFP, they may be more inclined to use it if they were more knowledgeable of the specific parameters of the program. ISED officials will continue working with financial institutions to increase their familiarity with the program.
To raise awareness among small business borrowers about the existence of a program of this nature within Canada, ISED will increase efforts to promote the program within the small business community.
Advance the CSBFP Information Technology Systems Infrastructure
ISED will continue to pursue the possibility of enabling lenders to submit claims electronically as part of the online administration of the program. In addition to already enabling digital transmission of loan registrations, program fees and claim payments, the main elements of this initiative would include allowing financial institutions to submit claim documentation electronically. It is expected that this initiative would further increase efficiency, improve service delivery, and reduce the paperwork burden and manual processes associated with the CSBFP.
Reduce Administrative Burden and Complexity
Despite continuous efforts to improve the administrative efficiency of the program, lenders have suggested that the administrative burden and complexity surrounding the program could be reduced. The program will undertake a review of all administrative processes with an aim to making improvements in this area, while maintaining the integrity of the program and being good stewards of public funds.
Enhance Stakeholder Engagement in Evaluation and Review of the CSBFP
Over the next review period, the CSBFP will work to increase involvement of both public and private stakeholders to ensure their perspectives are more effectively incorporated into program evaluation and review. This change could be achieved at a relatively low cost without major changes to how the program is administered.
Bibliography
EKOS Research Associates Inc. Canada Small Business Financing Program (CSBFP) Lender Awareness and Satisfaction Study, 2018.
Employment and Social Development Canada. Social Innovation and Social Finance Strategy, 2018.
Huang, L. and P. Rivard. Canada Small Business Financing Program: Cost-Benefit Analysis, Innovation, Science and Economic Development Canada, 2019.
Huang, L. and P. Rivard. Canada Small Business Financing Program: Economic Impact Analysis, Innovation, Science and Economic Development Canada, 2019.
Industry Canada. Comprehensive Review Report 2009 - 2014: Canada Small Business Financing Act, 2015.
Innovation, Science and Economic Development Canada. Policy Respecting Designation of Lenders, 2016.
Innovation, Science and Economic Development Canada. Biannual Survey of Suppliers of Business Financing — Data Analysis, First Half 2017, 2018.
Innovation, Science and Economic Development Canada. Evaluation of the Canada Small Business Financing Program, 2019.
Innovation, Science and Economic Development Canada. Key Small Business Statistics, January 2019.
Organisation for Economic Co-operation and Development. Facilitating Access to Finance: Discussion Paper on Credit Guarantee Schemes, 2010.
Organisation for Economic Co-operation and Development. SME and Entrepreneurship Financing: The Role of Credit Guarantee Schemes and Mutual Guarantee Societies in Supporting Finance for Small and Medium-Sized Enterprises, 2013.
Organisation for Economic Co-operation and Development. Evaluating Publicly Supported Credit Guarantee Programmes for SMEs, 2017.
Organisation for Economic Co-operation and Development. SME and Entrepreneurship Policy in Canada, 2017.
Organisation for Economic Co-operation and Development. Financing SMEs and Entrepreneurs 2019: An OECD Scoreboard, 2019.
R.A. Malatest & Associates Ltd. Canada Small Business Financing Program (CSBFP) Lender Awareness and Satisfaction Study, 2014.
R.A. Malatest & Associates Ltd. Canada Small Business Financing Program (CSBFP) Awareness and Satisfaction Study, 2018.
Rivard, P. Incrementality Study of the Canada Small Business Financing Program, Innovation, Science and Economic Development Canada, 2018.
Statistics Canada. Survey on Financing and Growth of Small and Medium Enterprises, 2017.
Appendix A: Key Canada Small Business Financing Program Parameters
| Parameters | Loan requirements |
|---|---|
| Small business eligibility |
|
| Assets financed | Loans are restricted to financing the following:
|
| Maximum financing amount | A borrower can finance up to $500,000 (of which a maximum of $350,000 can be used to finance the purchase or improvement of equipment or make leasehold improvements). These limitations apply to a borrower's total loans outstanding under the CSBFP. |
| Maximum interest rate |
|
| Length of term | The maximum term for any loan is 10 years from the scheduled date of the first payment of principal and/or interest. |
| Fees paid by lenders |
|
| Loss-sharing ratio | Eligible losses on loans are shared as follows: 85 percent government and 15 percent lender. |
| Cap on claims | For each five-year period (e.g., 2009–14), Industry Canada's obligation to an individual lender is to pay eligible claims (i.e., 85 percent of the eligible losses) on defaulted loans up to a maximum of the aggregate of:
|
Appendix B: Approval Rates (%) for Debt Financing in Canada by Business Characteristics
| 2009 (%) | 2010 (%) | 2011 (%) | 2012 (%) | 2013 (%) | 2014 (%) | 2015 (%) | 2016 (%) | 2017 (%) | |
|---|---|---|---|---|---|---|---|---|---|
| All SMEs | 79 | 88 | 88 | 89 | 85 | 81 | 88 | 82 | 87 |
| Number of employeesFootnote * | |||||||||
| 14 | 70 | 84 | 88 | 85 | 81 | 81 | 83 | 82 | 85 |
| 59 | 89 | 88 | 89 | 92 | 83 | 81 | 89 | 76 | 86 |
| 1019 | 85 | 93 | 90 | 86 | 89 | 83 | |||
| 2099 | 79 | 97 | 97 | 91 | 93 | 86 | 97 | 92 | 92 |
| 100499 | - | - | 98 | - | - | 96 | - | - | 98 |
| Age of business | |||||||||
| 3 years and youngerFootnote ** | 44 | 88 | 76 | 82 | 83 | 75 | 76 | 86 | 82 |
| 410 years | 85 | 85 | 85 | 88 | 82 | 78 | 84 | 74 | 82 |
| More than 10 years | 82 | 90 | 93 | 90 | 86 | 84 | 91 | 91 | 90 |
| Industry | |||||||||
| Accommodation and Food Services | 81 | 84 | 86 | 79 | 75 | 75 | 79 | 80 | 81 |
| Construction | 99 | 95 | 90 | 88 | 88 | 83 | 96 | 87 | 84 |
| Manufacturing | 87 | 88 | 94 | 81 | 89 | 84 | 83 | 85 | 88 |
| Agriculture and Fishing, Forestry and Oil and Mining | 86 | 100 | 97 | 94 | 93 | 93 | 85 | 81 | 96 |
| Professional Services | 76 | 86 | 87 | 84 | 89 | 83 | 93 | 84 | 86 |
| Transportation and Warehousing | 79 | 81 | 89 | 91 | 80 | 81 | 89 | 89 | 83 |
| Retail Trade | 70 | 88 | 91 | 89 | 83 | 80 | 85 | 81 | 84 |
| RegionFootnote *** | |||||||||
| Atlantic | 99 | 97 | 89 | 96 | 89 | 86 | 94 | 80 | 88 |
| Quebec | 79 | 87 | 89 | 90 | 87 | 85 | 86 | 80 | 91 |
| Ontario | 77 | 86 | 86 | 83 | 80 | 80 | 89 | 85 | 85 |
| Manitoba | 87 | 100 | 98 | 97 | 90 | 91 | 97 | 81 | 80 |
| Saskatchewan | 95 | 89 | 91 | ||||||
| Alberta | 71 | 90 | 93 | 88 | 85 | 82 | 81 | 78 | 84 |
| British Columbia and Territories | 81 | 83 | 94 | 94 | 86 | 76 | 91 | 86 | 85 |
| Sources: Industry Canada / Innovation, Science and Economic Development Canada, Credit Conditions Survey (2009, 2010, 2012, 2013, 2015, 2016) and Statistics Canada, Survey on Financing and Growth of Small and Medium Enterprises (2011, 2014, 2017). | |||||||||
Appendix C: Canada Small Business Financing Program Activity Review
Figure C-1: Number and Value of CSBFP Loans and Claims, 201419
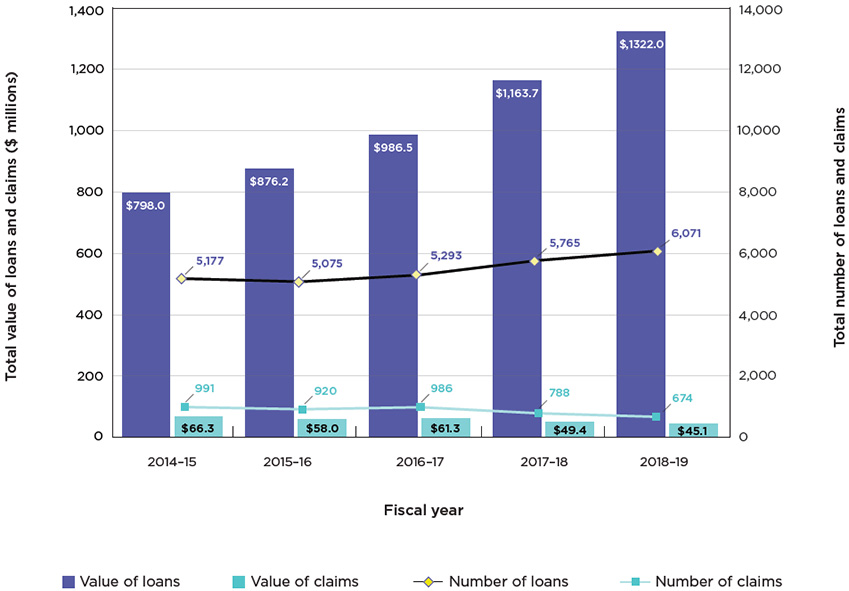
CSBFP lending has increased by 17.3 percent from 5,177 loans in 201415 to 6,071 loans in 201819. The value of lending has also increased by 63 percent from $798 million to $1.3 billion over the same period. The average loan value has increased from $154,100 in 201415 to $217,700 in 201819.
CSBFP overall claims have decreased by 32 percent from 991 claims in 201415 to 674 claims in 201819. The value of claims has also decreased by 32 percent from $66.3 million to $45.1 million over the same period. The average claim size remained stable at $66,854 in 201415 and $66,858 in 2018–19.
Figure C-2: Percentage of Total Value of CSBFP Loans by Age of Borrower Firm, 201419
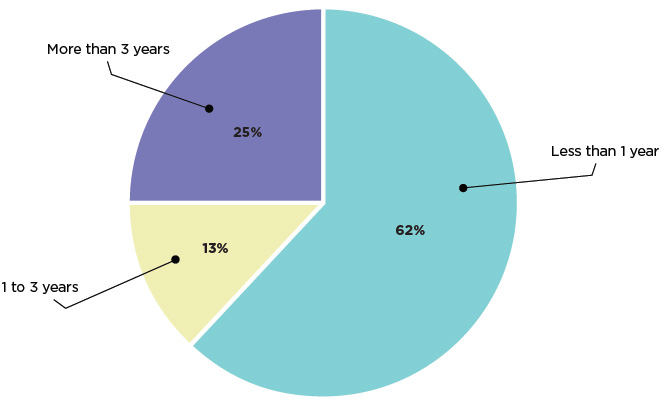
Approximately 62 percent of the value of CSBFP loans went to start-ups and businesses that were less than one year old.
Figure C-3: Percentage of Total Value of CSBFP Loans and Claims by Industry Sector, 201419
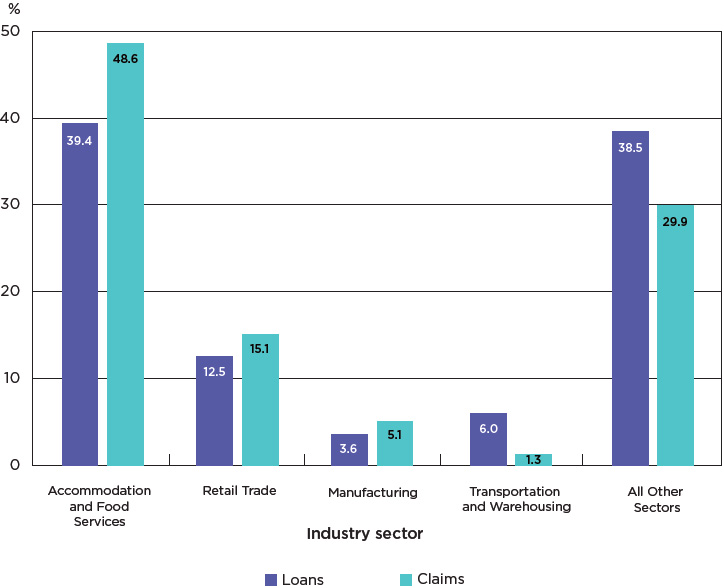
Four industry sectors (accommodation and food services, retail trade, manufacturing, and transportation and warehousing) accounted for 62 percent of the value of loans and 70 percent of the value of claims.
"All other sectors" includes every other industry sector that accounted for less than 3.6 percent of the value of loans. Examples of these sectors include construction; wholesale trade; health care and social assistance; arts, entertainment and recreation; administration and support, waste management and remediation services; educational services; and professional, scientific and technical services.
Figure C-4: Percentage of Total Value of CSBFP Loans and Claims by Asset Type, 201419
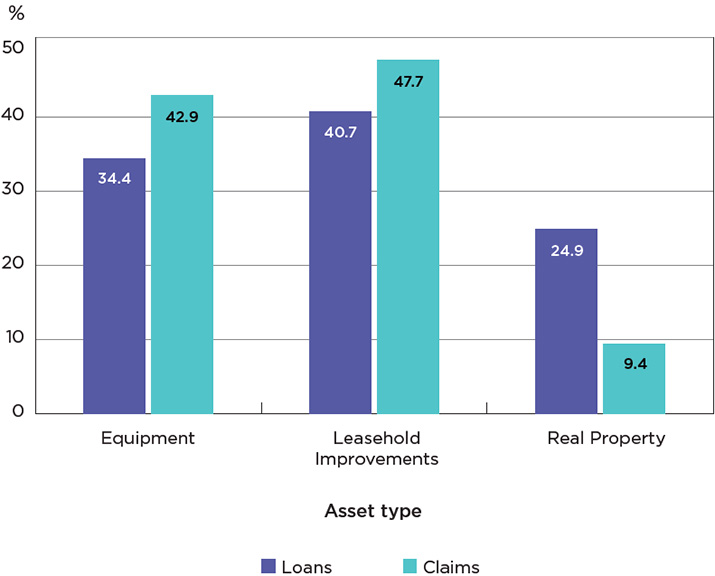
Over the review period, equipment loans accounted for 34 percent of the value of loans and 43 percent of the value of claims. Leasehold improvements accounted for 41 percent of the value of loans and 48 percent of the value of claims. Real property accounted for 25 percent of the value of loans and 9 percent of the value of claims.
For more detailed information on CSBFP activity, visit the Open Government portal page.
Appendix D: Canada Small Business Financing Act Background on Cost Recovery
The importance of carefully monitoring the financial performance of the loan portfolio and regularly updating the program's cost recovery model has been reinforced by the Office of the Auditor General.
Methodology
Forecasting program revenues and expenses can be a complex task for several reasons. Firstly, given that loans can have a term of 1015 years, cost recovery models must cover the entire life of loans made in a given year. Secondly, there is significant lag time between receipt of revenues and payment of claims. Revenues are generally received early on and claims are paid later. Thirdly, lenders are allowed up to five years after a default to submit a claim for loss, so the period can be extended to as much as 20 years. Finally, sufficient data on loan risk and lender behaviour take nearly four years to accumulate from the time of a parameter change, which is essential to a forecasting model. As a result, revenues and expenses need to be forecasted long into the future, which makes estimating cost recovery difficult and subject to variance according to economic conditions and other factors.
To estimate the level of cost recovery, ISED, in conjunction with academics, has developed forecasting models that use multivariate analysis of claims received in a given month combined with statistical and econometric-based models to project future claims against forecast revenues. ISED updates its forecasting models on a regular basis (at least annually) to ensure they reflect the most recent activity and economic conditions and they are vetted by the Office of the Auditor General.
Findings
Table D-1 illustrates current cost recovery forecasts for the four lending periods of the CSBFP (19992004, 200409, 200914 and 201419). This table provides a summary of the revenue and expense streams associated with each of the aforementioned annual cohorts.
In aggregate, for the five years of lending under the current review period:
- Revenues (registration and administration fees) are expected to reach approximately $336 million.
- Expenses (claims) are expected to be approximately $311 million, for a net surplus of $25.6 million.
- Revenues are expected to offset expenses by 108.2 percent, which is up from 82.1 percent expected for the previous (200914) period.
- The net cost to government for this five-year lending period is expected to be -0.5 percent of total loans made, down from 1.3 percent for loans made during the previous (200914) period.
| Cohort | Revenues and Expenses ($ millions) | Percentage cost recoveryFootnote 1 | Net cost/loans | ||||
|---|---|---|---|---|---|---|---|
| Loans | Registration fees | Administration fees | Claims | Net cost | |||
| 1999–00 | 1,352.3 | 26.8 | 48.4 | −115.5 | −40.3 | 65.1 | −3.0% |
| 2000–01 | 1,159.0 | 22.9 | 41.8 | −100.2 | −35.4 | 64.7 | −3.1% |
| 2001–02 | 899.2 | 17.8 | 31.5 | −65.1 | −15.8 | 75.7 | −1.8% |
| 2002–03 | 951.2 | 18.8 | 31.6 | −64.6 | −14.2 | 78.0 | −1.5% |
| 2003–04 | 999.9 | 19.8 | 31.0 | −77.3 | −26.5 | 65.7 | −2.6% |
| Total (1999–04) | 5,361.6 | 106.1 | 184.3 | −422.7 | −132.2 | 68.7 | −2.5% |
| 2004–05 | 1,041.1 | 20.6 | 38.9 | −81.9 | −22.5 | 72.6 | −2.2% |
| 2005–06 | 1,087.7 | 21.5 | 38.8 | −105.1 | −44.8 | 57.3 | −4.1% |
| 2006–07 | 1,024.5 | 20.2 | 33.8 | −100.0 | −46.0 | 54.0 | −4.5% |
| 2007–08 | 987.7 | 19.5 | 30.0 | −97.8 | −48.3 | 50.6 | −4.9% |
| 2008–09 | 901.1 | 17.8 | 24.5 | −63.5 | −21.2 | 66.6 | −2.4% |
| Total (2004–09) | 5,042.1 | 99.6 | 165.9 | −448.4 | −182.8 | 59.2 | −3.6% |
| 2009–10 | 952.9 | 18.8 | 39.1 | −72.2 | −14.3 | 80.2 | −1.5% |
| 2010–11 | 1,015.1 | 20.0 | 42.3 | −73.2 | −10.9 | 85.2 | −1.1% |
| 2011–12 | 978.3 | 19.3 | 39.8 | −64.4 | −5.3 | 91.8 | −0.5% |
| 2012–13 | 899.7 | 17.8 | 35.7 | −68.9 | −15.4 | 77.6 | −1.7% |
| 2013–14 | 854.6 | 16.9 | 33.0 | −65.9 | −16.0 | 75.8 | −1.9% |
| Total (2009–14) | 4,700.5 | 92.8 | 190.0 | −344.6 | −61.8 | 82.1 | −1.3% |
| 2014–15 | 798.0 | 15.8 | 34.6 | −53.9 | −3.5 | 93.5 | −0.4% |
| 2015–16 | 876.2 | 17.2 | 38.7 | −57.1 | −1.2 | 98.0 | −0.1% |
| 2016–17 | 986.5 | 19.4 | 44.2 | −63.2 | 0.4 | 100.7 | 0.0% |
| 2017–18 | 1,163.7 | 22.9 | 54.4 | −66.1 | 11.2 | 116.9 | 1.0% |
| 2018–19 | 1,320.6 | 26.0 | 62.9 | −70.3 | 18.7 | 126.6 | 1.4% |
| Total (2014–19) | 5,144.8 | 101.3 | 234.8 | −310.5 | 25.6 | 108.2 | 0.5% |
| Note: Figures in italics are estimates. | |||||||
The level of cost recovery for the current review period improves if the time money is received is taken into consideration given that revenues under the CSBFP are received early in the life cycle of loans, whereas loan defaults and subsequent claim payments occur later (i.e., $1 received/paid today is worth more than $1 received/paid 5 or 10 years out).
Table D-2 presents the same summary of revenue and expense streams associated with each of the CSBFP annual cohorts. This table takes into consideration when revenues are received and when expenses are paid (i.e., net present value (NPV) basis).
In aggregate, for the five years of lending under the current review period, on a NPV basis:
- Revenues (registration and administration fees) are expected to reach approximately $298 million over the life of loans.
- Expenses (claims) are expected to be approximately $250 million, for a net surplus of $47.5 million over the life of loans.
- Revenues are expected to offset expenses by 119 percent on a NPV basis, up from 89.7 percent for the previous (200914) period.
- The net cost to government for this five-year lending period is expected to be -0.9 percent of loans made, down from 0.6 percent for loans made during the previous (200914) period.
| Cohort | Revenues and expenses ($ millions) | Percentage cost recoveryFootnote 3 | Net cost/loans | ||||
|---|---|---|---|---|---|---|---|
| Loans | Registration fees | Administration fees | Claims | Net cost | |||
| 1999–00 | 1,352.3 | 26.1 | 41.9 | -96.9 | -29.0 | 70.1 | -2.1% |
| 2000–01 | 1,159.0 | 22.4 | 36.4 | -83.8 | -24.9 | 70.2 | -2.2% |
| 2001–02 | 899.2 | 17.4 | 27.5 | -54.5 | -9.6 | 82.3 | -1.1% |
| 2002–03 | 951.2 | 18.3 | 27.6 | -54.0 | -8.1 | 85.0 | -0.9% |
| 2003–04 | 999.9 | 19.3 | 27.1 | -64.7 | -18.3 | 71.7 | -1.8% |
| Total (1999-04) | 5,361.6 | 103.4 | 160.5 | -353.9 | -89.9 | 74.6 | -1.7% |
| 2004–05 | 1,041.1 | 20.1 | 33.9 | -69.0 | -15.0 | 78.2 | -1.4% |
| 2005–06 | 1,087.7 | 20.9 | 34.0 | -89.0 | -34.1 | 61.7 | -3.1% |
| 2006–07 | 1,024.5 | 19.7 | 29.8 | -85.5 | -36.0 | 57.9 | -3.5% |
| 2007–08 | 987.7 | 19.0 | 26.6 | -84.4 | -38.8 | 54.0 | -3.9% |
| 2008–09 | 901.1 | 17.4 | 21.7 | -54.8 | -15.7 | 71.3 | -1.7% |
| Total (2004–09) | 5,042.1 | 97.1 | 145.9 | -382.7 | -139.7 | 63.5 | -2.8% |
| 2009–10 | 952.9 | 18.3 | 33.7 | -59.9 | -8.0 | 86.7 | -0.8% |
| 2010–11 | 1,015.1 | 19.5 | 36.5 | -60.3 | -4.3 | 92.8 | -0.4% |
| 2011–12 | 978.3 | 18.8 | 34.4 | -52.8 | 0.4 | 100.7 | 0.0% |
| 2012–13 | 899.7 | 17.3 | 30.8 | -56.7 | -8.5 | 85.0 | -0.9% |
| 2013–14 | 854.6 | 16.5 | 28.5 | -53.8 | -8.8 | 83.7 | -1.0% |
| Total (2009–14) | 4,700.5 | 90.4 | 163.8 | -283.4 | -29.2 | 89.7 | -0.6% |
| 2014–15 | 798.0 | 15.3 | 29.7 | -43.4 | 1.7 | 103.9 | 0.2% |
| 2015–16 | 876.2 | 16.8 | 33.1 | -45.8 | 4.1 | 109.0 | 0.5% |
| 2016–17 | 986.5 | 18.9 | 37.6 | -50.9 | 5.6 | 111.1 | 0.6% |
| 2017–18 | 1,163.7 | 22.3 | 45.8 | -53.2 | 14.9 | 128.0 | 1.3% |
| 2018–19 | 1,320.6 | 25.3 | 52.6 | -56.8 | 21.2 | 137.3 | 1.6% |
| Total (2014–19) | 5,144.8 | 98.7 | 198.9 | -250.1 | 47.5 | 119.0 | 0.9% |
| Note: Figures in italics are estimates. | |||||||
Comparison of results for the first four lending periods of the CSBFP indicates that, during the current review period, the program is forecasted to be fully cost recoverable for the first time. The overall improvement in the CSBFP's cost recovery level is attributable to a stronger Canadian economy and a slight decrease in the overall risk associated with the CSBFP portfolio. As a result of legislative and regulatory changes in 2015 and 2016, which increased the maximum loan amount from $500,000 to $1,000,000 and coverage period for real property loans from 10 years to 15 years, there has been a shift in terms of what borrowers are financing with CSBFP loans. In 201415, real property loans accounted for 20 percent of lending, but this proportion has increased to 26 percent in 201819. More real property lending impacts the program's cost recovery in two important ways. Firstly, real property loans are generally for higher amounts, which enables the program to collect more revenues over a longer period of time as registration and administration fees are based upon a percentage of the original and outstanding loan amounts. Secondly, real property loans are typically less risky than loans for equipment and leasehold improvements as real property is easier to secure and realize on in the event of a default. Therefore, a higher proportion of real property loans generally results in higher revenues and fewer/smaller claims, which improves the program's overall level of cost recovery. That being said, the current outlook could change in the event of an economic downturn.