
A report submitted to Industry Canada
Allan Riding
Miwako Nitani
PDF version
Key Risk Factors in the CSBF Portfolio
259 KB, 14 pages
Table of contents
Introduction
The Canada Small Business Financing (CSBF) program facilitates commercial loans to small- and medium-sized enterprises (SMEs) by providing a federal government partial guarantee to banks on behalf of eligible borrowers. In delivering this program, Industry Canada seeks to facilitate incremental funding at a reasonable cost. It is therefore important to set the parameters of the CSBF program such that a desirable balance is achieved. To do so, it is essential to understand clearly the relationships among the program parameters, borrower attributes and their respective impacts on the risk associated with the program. Improved design of the program parameters can only be achieved by arriving at a yet better understanding of how combinations of attributes of borrowers, attributes of loans, and the nature of program collectively relate to program outcomes. This document reports on the findings of research that seeks to accomplish these tasks.
Scope and Objective
Historically, the goal of the CSBF program has been to increase the availability of loans "for the establishment, expansion, modernization and improvement of SMEs". To do so, the program provides comfort to lenders by sharing losses on loans advanced under the terms of the CSBFP. The Government pays lenders up to 85 percent of eligible losses incurred on loans that have defaulted, after lenders' cost-recovery efforts. In return, the borrower pays an up-front registration fee of two percent of the amount financed, and an annual fee of 1.25 percent of the outstanding loan amount. Commercial lenders are responsible for credit decisions, subject to eligibility requirements as specified by the Government of Canada. The Government maintains control of key program parameters and eligibility requirements that include fees, maximum interest rates, maximum loan size, guarantee percentage, liability ceilings, size/age of business, and industry sector. Therefore, it is important to examine sources and drivers of risk and revenues within the CSBF loan portfolio and to determine how changes in the program parameters might affect both incrementality and cost recovery targets.
This proposal follows up on previous work conducted in 2009 on behalf of Industry Canada, entitled Sources of Portfolio Risk and Revenue Generation of the Canada Small Business Financing Program. In that work, analysis of CSBF data as of 2008 led to a model of assessing and simulating the impact on program costs of key borrower variables. In the interim, four years have passed during which the world has witnessed extremes of economic conditions. The models derived in the 2009 work did not, of course, reflect the economic turbulence that has characterized the 2008–2011 periods. The recent volatility in financial markets potentially allows for refinement of the risk assessment models derived in the previous studies in order to obtain greater accuracy and reliability over a wider range of economic conditions and with a less complex model. This document outlines the findings of this work.
Methodologies
To capture accurately the relationships between loan and borrower attributes and risk, it is necessary to take a holistic approach by estimating statistical models that relate loan defaults to borrower and program attributes. Most statistical techniques invoke assumptions and requirements of the data. As was done in the previous work, alternative methodological approaches are employed. The first methodology is logistic regression, a technique that models whether or not a default has occurred and that estimates the impact of attributes of the borrower on this likelihood. The alternative methodology, survival analysis, estimates the impact of borrower attributes on the timing of default.
Logistic Regression
Logistic regression is often employed for situations in which one wants to predict an outcome (such as loan default) based on values of a set of predictor variables (such as the data provided in the CSBF database). The goal of the analysis is to distinguish between accounts that repay the loans from those that do not. Logistic regression is the methodology that lies behind credit scoring, a method used by many commercial lenders as an adjunct for adjudication of loan applications.
Credit scoring is being increasingly widely used by financial institutions to determine whether or not credit should be granted to borrowers. Development of credit-scoring models involves analysis of data comprising attributes of the borrowers and on the subsequent performance of the loans over a period of time known as the "observation window". At the beginning of the observation window, typically when the loan is first advanced, the lender gathers substantial information about each borrower. For example, the CSBF loan registration form collects such information in the CSBF database. The credit-scoring model is then developed by estimating logistic regression models of the loan outcomes (for example, defaulted or not). In the context of the work proposed here, the dependent variable would be whether or not a given loan had defaulted and the independent variables would be attributes selected from the CSBF database. These include industry sector, type of borrower, age of borrower firms, class of loan, type of operation, size of loan and size of borrower, etc.
Survival Analysis
Survival Analysis is (also known as event history analysis, time-to-failure, and reliability analysis) is a set of techniques that are employed in a variety of settings to estimate a survival function that maps a set of events, in this case loan defaults and subsequent claims, onto time. In this application, it represents the proportion of loans on which a claim is registered in each time period (months or years) since loan disbursement. This allows estimation of the proportion of the loan portfolio that will survive past a given time since disbursement as a function of factors such as loan and borrower attributes. Among survival analysis methods, Cox regressions (also known as the proportional hazards model) estimates the relationships between time to default and attributes of the borrowers.
Approaches
Both approaches statistically relate loan defaults (and, by extension, the costs of servicing claims on defaulted loans) to borrower and program attributes, but differ slightly in the nature of predictions and in terms of their underlying statistical assumptions. The use of alternative methods allows for a built-in check on the consistency of the findings and an assessment of the extent to which results might be assumption-dependent.
The goal is to use these methods to update the models of risk assessment derived in 2009 to reflect the additional data and economic conditions of the last few years and to measure the impact of the various salient loan and borrower attributes contained in the CSBFP database that contribute to lower loan losses and revenues. This will allow the Project Authority to assess which attributes are most important and to estimate combinations of characteristics that might further reduce program costs.
Data Description
To accomplish the objectives of this study Industry Canada provided the research team with data extracted from the CSBF databases. The data comprised 405,858 loans disbursed between April 1 1989 and March 31 2011.Footnote 1 These data included all the information recorded from the loan registration forms and, for those loans on which at least one claim has been received, the date and amount of the claim. Table 1 summarizes loan and claim activity for the population of SBLA and CSBF loans broken down by year of loan disbursement.
| Year of disbursement | Loan Volume ($Million) | Number of loans | Claims Paid ($Million) | Number of claims | Losses (% of $ Loan Volume) | Claims (% of Loans) |
|---|---|---|---|---|---|---|
Long description for Table 1This table summarizes the loans made claims paid on a fiscal-year basis for each year of the CSBF Program (including its predecessor, the Small Business Loans (SBL) Program) from April 1, 1989 and ending March 31, 2011. The loan columns show the number and value of loans made per year. The largest number of loans was made under the SBL Program in 1995–96 when 30,607 loans were made. In the first year of the CFBF Program, 1999–2000, 17,614 loans were made and it has decreased every year since. In 2010–11, 7 405 loans were made. The claim columns show the number and value of claims paid per year. The largest number of claims was paid under the SBL Program in 1995–96 when 5,384 claims loans were paid. In the first year of the CSBF Program, 1999–2000, 2,367 claims were paid and it has decreased every year since. In 2010–11, 193 claims were paid. The summary totals line tells us that from 1989 until 2011, 405,005 loans were registered, representing $28.96 billion in total value; and there have been 48,496 claims, representing $2.3 billion in claims paid. The last column summarizes net revenues less expenses, indicating that at the end of fiscal year 2009–10 there was a $191.17-million deficit overall. The losses were 7.9% and 12% expressed as a percentage of the loan values and the claims respectively. | ||||||
| Pre April 1 1995 | 8,798 | 159,873 | 656 | 17,074 | 7.5% | 10.7% |
| 95–96 | 2,243 | 34,607 | 230 | 5,384 | 10.3% | 15.6% |
| 96–97 | 2,010 | 30,855 | 185 | 4,372 | 9.2% | 14.2% |
| 97–98 | 1,966 | 28,911 | 164 | 3,661 | 8.3% | 12.7% |
| 98–99 | 1,607 | 22,445 | 142 | 2,936 | 8.8% | 13.1% |
| 99–00 | 1,343 | 17,614 | 115 | 2,367 | 8.6% | 13.4% |
| 00–01 | 1,159 | 14,439 | 100 | 1,975 | 8.7% | 13.7% |
| 01–02 | 898 | 11,008 | 65 | 1,268 | 7.3% | 11.5% |
| 02–03 | 948 | 11,229 | 64 | 1,192 | 6.7% | 10.6% |
| 03–04 | 996 | 11,040 | 76 | 1,369 | 7.7% | 12.4% |
| 04–05 | 1,035 | 11,078 | 81 | 1,410 | 7.9% | 12.7% |
| 05–06 | 1,081 | 10,719 | 103 | 1,520 | 9.5% | 14.2% |
| 06–07 | 1,024 | 9,592 | 97 | 1,368 | 9.5% | 14.3% |
| 07–08 | 987 | 8,929 | 95 | 1,223 | 9.7% | 13.7% |
| 08–09 | 896 | 7,751 | 57 | 717 | 6.4% | 9.3% |
| 09–10 | 950 | 7,510 | 39 | 467 | 4.1% | 6.2% |
| 10–11 | 1,009 | 7,405 | 17 | 193 | 1.6% | 2.6% |
| Total | 28,951 | 405,005 | 2,286 | 48,496 | 7.9% | 12.0% |
In interpreting Table 1, it is important to recognize that among loans disbursed in relatively recent years, some unknown fraction of loans currently outstanding will default. Accordingly, loss and default rates for recent years understate what actual loss and default rates will be. With this caveat, the average loss rate for the CSBF period is estimated as 8.2 per cent on a 12.8 per cent default rate.
To further investigate losses and defaults, we distinguish between:
- "Early claims", those claims received within 24 months of disbursement; and,
- "Late claims", those claims received 24 months or more after disbursement.
We argue that, compared to "late" claims, "early" claims may be relatively more likely to embody the impact of the lenders' policies, procedures and errors in lenders' initial risk assessments. Later claims may be relatively more likely to derive from events unforeseen at time of disbursement. Chart 1 shows the rates of early and late claims on loans disbursed in each of the fiscal years covered in this work. (Recall that rates of claims on loans disbursed in relatively recent years are understated because an unknown number of loans disbursed in recent years, which are yet outstanding, will default in the future.) Nonetheless, the data suggest a cyclical pattern with relatively high levels of claims having been received on loans that had been issued between 2006 and 2008.
Chart 1: Rates of Claims by Year of Loan Disbursement

Chart 1 further shows that the cyclical pattern is primarily attributable to variability among "early" claims; the rate of "late" claim receipts appears to be relatively stable at slightly less than 10 percent of loans disbursed in any given year. However, rates at which "early" claims are received vary from about 3 percent (e.g., 2003) to almost 6 percent (e.g., 2007–2008).
In most breakdowns, we also distinguish findings according to three time periods:
- SBLA: 308,744 loans disbursed prior to April 1 2001.
- CSBF: 81,348 loans disbursed between April 1 2001 and April 1 2009.
- 14,915 loans disbursed since April 1 2009. For the most part, these are set aside in the analyses because an unknowable fraction of defaults and claims for this cohort remain to be realized and reported.
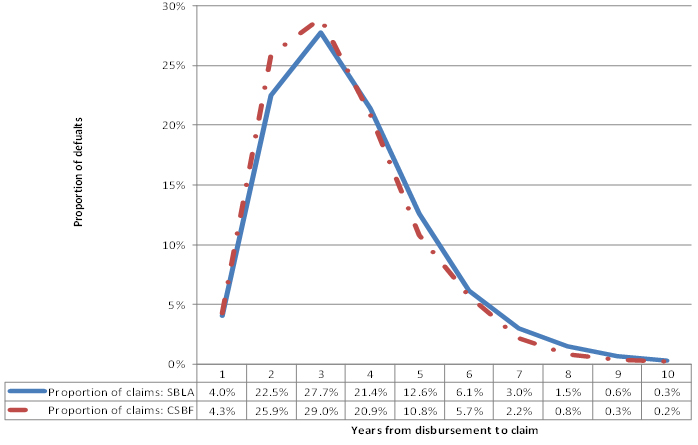
Chronology of Claims
Chart 2 presents the chronology of claims for the SBLA (pre–2001) and CSBF (2001–2009) periods (the post–2009 period is omitted because such a high proportion of post–2009 claims are yet to be realized). The chart suggests that claims have been received somewhat sooner for the CSBF cohort of loans than had been the case for the SBLA period. For the CSBF period, approximately 30 per cent of claims were received within two years of disbursement and more than 80 per cent of claims had been received within four years from disbursement.
Chart 2: Chronology of Claim Activities
Findings
Univariate Breakdowns of Claims by Firm Attributes
Table 2 presents breakdowns of early and late claims by sector, age of firm and lender category, respectively for each of the three time periods employed here.
Table 2 shows that for all time periods, and for both early and late claims:
- Claims are much less likely to be received on loans advanced by credit unions than on loans advanced by banks, trust companies or caisses populaires. While one might conclude from this that credit unions use more effective underwriting standards, it may also be attributable to the possibility that credit unions know their clientele and market better and may have established relatively closer personal relationships when compared to banks (which tend to operate in urban centres).
- Claim frequencies, both early and late claims, decrease substantially with age of the borrower firm.
- New firms are much more likely to default than either established firms or young firms (1 to 3 years).
- Young firms (1 to 3 years) are more likely to default than established firms.
- Incorporated firms are more likely to default than either sole proprietorships or partnerships. Interestingly, more than nine out of ten franchises, historically a relatively risky category of firms, are incorporated. Therefore, this finding that incorporated firms were more likely to default than other legal forms may reflect the disproportionately large presence of franchises among incorporated firms. This type of interaction is one reason for following the univariate analysis with the multivariate methods described in the following section.
- For most sectors, during the CSBF era, total rates of claim were in the 10 to 11 per cent range. However, sectors with especially high default rates included manufacturing and accommodation and food services. Sectors in which claims were relatively rare included construction, primary sectors, professional scientific etc. services, and transportation and warehousing.
- The impact of franchising appears to have shifted considerably. Franchises are almost all contained within either the retail or the accommodation etc. sector. For both sectors, the rates of claims receipts were especially high during the SBLA period. However:
- The incidence of defaults among franchises in the accommodation etc. sector has decreased substantially and to a statistically significant extent such that rates of default on franchises have been lower than for non-franchises during the CSBF period. Possibly franchises have become more standardized than in the past, with relatively more guidance being provided by franchise central offices.
- Rates of default for franchises in the retail sector remain slightly above the norm for non-franchises.
- These results, however, may be misleading: franchises are disproportionately represented among incorporated firms (see above) as well as among new firms. Accordingly, univariate analysis is unable to disentangle these correlations.
Multivariate Analysis of Risk Drivers
Drivers of Early Defaults
The left-side panel of Table 3 shows the results of estimation of logistic regression models of factors associated with early defaults. The results illustrate that:
- Risk (relative likelihood) is inversely correlated with size of firm (number of employees) and the ratio of annual revenues to loan. The more employees, the lower the likelihood of default and the greater the ratio of annual revenues to loan demand, the lower the risk of default.
- Incorporated businesses were more likely to default than either sole proprietorships or partnerships. The relative likelihood measure shows that sole proprietorships were about half as likely to default as incorporated firms and partners were less than one-third as likely to default as incorporated firms.
- New firms were approximately 3.73 times more likely to default than established firms and young firms (1–3 years old) were 2.3 times more likely to default than established firms. Thus, age of firm constitutes a key risk factor in the CSBF portfolio.
- CSBF loans issued by commercial lenders other than major banks were, collectively, about half as likely to default as loans issued by the major banks.
- Firms in the wholesale sector were especially at risk of early default; however, most sectors were relatively less risky than the manufacturing sector reference category. While the frequency of default for franchises has decreased substantially since the SBLA period, the impact of franchises during the CSBF period appears to actually mitigate risk in both the retail and accommodation etc. sectors. Non-franchises in both sectors appear to be somewhat more risky than the benchmark sector, manufacturing firms. However, franchises in both sectors appear to be less risky. This appears to conflict with the results reported in Table 2; however, the presence of collinearity among franchises, incorporated firms, and new firms makes a clear interpretation elusive (see Table 5 for more detail).
Drivers of Late Defaults
The right-side panel of Table 3 shows the results of estimation of logistic regression models of factors associated with late defaults. The results illustrate that:
- Risk (relative likelihood) of late default is again inversely correlated with size of firm (number of employees) and with the ratio of annual revenues to loan. The more employees, the lower the likelihood of late default and the greater the ratio of annual revenues to loan demands, the lower the risk of late defaults. With a relative risk measure of 0.94, size of firm (number of employees) is not as strong a driver of late defaults as of early defaults (relative risk measure=0.88).
- Incorporated businesses were again more likely to default than either sole proprietorships or partnerships; however, the legal form of the firms as of CSBF registration was relatively less of a correlate in late defaults than it was for early defaults. The relative likelihood measure shows that the odds of default for sole proprietorships are 36 percent less than for incorporated firms and partnerships were about half as likely to default as incorporated firms.
- New firms remain much more likely (2.75 times) to default than established firms, although this risk measure was less pronounced among early claims than for late claims. Young firms (1–3 years old) were 83 per cent more likely to default (late) than established firms. Age of firm at disbursement remains a key risk factor in the CSBF portfolio.
- CSBF loans issued by commercial lenders other than major banks were, collectively, less likely to default as loans issued by the major banks but the difference among lender categories is not as pronounced as for early claims.
- Firms in the manufacturing sector reference category were especially at risk of late default. Most sectors were still relatively less risky than manufacturing. The least risky sectors comprised primary sectors (Agriculture support activities, Forestry, Fishing & Hunting, Mining & Oil and Gas Extraction).
- Franchises, in both the retail and accommodation etc. sectors, were again significantly less likely to exhibit late defaults. Table 5 provides further detail regarding the complex ways in which claims on franchises are distributed and breaks down claims rates for franchises and non-franchises across firm age categories and business type (legal form). It suggests finding that franchises seem especially susceptible to default during the early stages of firm development and their impact is therefore likely included in the firm age variable to some (unknowable) extent.
Survival Analysis: Drivers of Time to Default
Table 4 shows the results of using the proportional hazards model of time between disbursement and claim receipt to measure risk factors. The results confirm that sole proprietorships and partnerships are less risky than incorporated firms and younger firms are riskier than more established enterprises. Furthermore, risk increases rapidly based on the age of the firms with the youngest firms representing the greatest risk. The results also confirm that CSBF loans from Credit Unions and Caisses Populaires have been relatively less risky than loans advanced by banks and other commercial lenders. The findings of this analysis confirm that the least risky sector is that comprised of primary industries and that the riskiest sectors are, in decreasing order of risk: the wholesale sector, professional etc. services, non-franchises in the accommodation etc. sector and non-franchises in retail, and other services.
| Early Claims | Late Claims | |||||||
|---|---|---|---|---|---|---|---|---|
| SBLA: 1992–2001 | CSBF: 2001–2009 | Post April 1 2009 | Total | SBLA: 1992–2001 | CSBF: 2001–2009 | Post April 1 2009 | Total | |
Long description for Table 2This table presents breakdowns of early claims (those claims received within 24 months of disbursement) and late claims (those claims received 24 months or more after disbursement) by lender, age and legal status of the borrower firm and the industry sectors in which the borrower firm conducted its business. When examined by lender, the table shows that the frequency of early claims (1.7%) and late claims (4.9%) are much less for credit unions when compared to banks (early claims 3.8% and late claims 9.2%) and caisses populaires (early claims 4.2% and late claims 10.0%). When examined by age of the borrower firm, claim frequencies for both early and late claims, decrease substantially the longer the firm has been in business. The total column shows that the frequency of early claims for new firms (less than one year old) is 6.7% whereas for established firms (more than three years old) it is only 1.1%. Similarly, in late claims, in the total column, the frequency of claims for new firms is 14.5% but only 4.1% for established firms. In the category of legal status of borrower firm, incorporated firms are more likely to default than either sole proprietorships or partnerships. The total column explains that the frequency of early claims for incorporated firms 4% but for sole proprietors and partnerships it is 3% and 2.4% respectively. However, the frequency increases for late claims. In the total column for late claims, the frequency of claims for incorporated firms is 10% but for sole proprietors and partnerships it is 6.8% and 6.6% respectively. When broken down by the industry sector in which the borrower firm conducted its business, there was a great variation in the frequency of both early and late claims. In the total column of the early claims group, the construction sector had one of the lowest claim frequencies at 1.4% whereas retail franchises had the highest occurrence of claims at 10.9%. Accommodation and food services franchises had the second highest claims rate at 8.6%. A similar trend is displayed in the frequency of late claims where the frequency in the total column is the highest for retail franchises (25.4%), followed by accommodation and food services franchises (20.9%). | ||||||||
| Total | 3.6% | 4.3% | 3.1% | 3.7% | 9.4% | 9.5% | 2.0% | 9.1% |
| Category of lender | ||||||||
| Major bank | 3.4% | 5.4% | 3.8% | 3.8% | 9.2% | 10.4% | 2.4% | 9.2% |
| Other bank or trust | 2.7% | 3.4% | 2.6% | 2.7% | 8.9% | 6.8% | 1.6% | 8.5% |
| Caisses Populaires | 5.0% | 2.5% | 1.3% | 4.2% | 11.0% | 8.6% | 1.4% | 10.0% |
| Credit Unions | 1.8% | 1.6% | 1.1% | 1.7% | 5.3% | 5.1% | 0.5% | 4.9% |
| Age of borrower firm | ||||||||
| New Firms | 6.9% | 6.7% | 4.7% | 6.7% | 15.6% | 13.4% | 3.2% | 14.5% |
| 1 to 3 years | 3.1% | 3.3% | 2.8% | 3.1% | 8.5% | 8.0% | 1.4% | 8.2% |
| Established | 1.1% | 1.4% | 1.0% | 1.1% | 4.2% | 4.4% | 0.7% | 4.1% |
| Legal Status of borrower firm | ||||||||
| Sole Proprietor | 3.2% | 2.4% | 1.7% | 3.0% | 7.1% | 6.5% | 1.2% | 6.8% |
| Partnership | 2.5% | 1.6% | 0.7% | 2.4% | 6.9% | 5.7% | 1.8% | 6.6% |
| Incorporated | 3.8% | 4.9% | 3.3% | 4.0% | 10.3% | 10.3% | 2.2% | 10.0% |
| Sectors | ||||||||
| Primary sectors | 1.5% | 1.4% | 0.4% | 1.4% | 5.9% | 6.1% | 0.3% | 5.8% |
| Construction | 1.5% | 1.3% | 1.0% | 1.4% | 5.2% | 4.5% | 0.8% | 4.8% |
| Manufacturing | 3.7% | 5.5% | 4.7% | 4.0% | 11.9% | 14.6% | 2.1% | 12.1% |
| Wholesale | 3.3% | 6.5% | 5.7% | 3.7% | 8.8% | 10.7% | 3.2% | 8.9% |
| Retail | 5.2% | 6.0% | 4.7% | 5.4% | 13.1% | 11.7% | 2.8% | 12.3% |
| Retail: Non-franchises | 4.8% | 5.9% | 4.4% | 5.0% | 11.7% | 11.0% | 3.0% | 11.1% |
| Retail: Franchises | 21.4% | 6.6% | 6.1% | 10.9% | 47.4% | 14.7% | 2.1% | 25.4% |
| Transportation & Warehousing | 1.8% | 1.5% | 1.0% | 1.7% | 5.8% | 4.9% | 0.8% | 5.4% |
| Professional, Scientific etc. Services | 2.6% | 3.2% | 3.4% | 2.7% | 8.8% | 5.6% | 1.1% | 8.3% |
| Accommodation and Food Services | 8.5% | 6.9% | 4.0% | 7.6% | 19.2% | 13.2% | 3.3% | 16.1% |
| Accommodation etc.: Non-franchises | 7.4% | 7.7% | 4.2% | 7.3% | 15.9% | 13.7% | 3.1% | 14.7% |
| Accommodation etc.: Franchises | 21.4% | 5.7% | 3.6% | 8.6% | 47.7% | 12.5% | 3.6% | 20.9% |
| Info, cultural, finance, insurance, etc. | 4.1% | 5.7% | 3.0% | 4.3% | 12.2% | 10.4% | 1.7% | 11.7% |
| Other services | 3.2% | 4.0% | 3.0% | 3.4% | 9.8% | 8.5% | 1.9% | 8.9% |
| Early Claims | Late Claims | |||||||||
|---|---|---|---|---|---|---|---|---|---|---|
| Number of Cases | Coefficient Estimate | Std. Error | p-value | Relative Likelihood | Number of Cases | Coefficient Estimate | Std. Error | p-value | Relative Likelihood | |
Long description for Table 3This table shows the results of logistic regression models which were used to analyze multiple factors (such as to the number of employees, the ratio of annual revenues to loan, borrower type, age of firm, lender, and the industry sectors in which the borrower firm conducted its business), and determine their associated risk with early and late defaults. Information on early defaults is found on the left side of the table while information on late defaults can be found on the right side of the table. The left side of this table demonstrates that the more employees a business has, the lower the likelihood of default. It also shows that the greater the ratio of annual revenues to loan demand, the lower the risk of default. The table goes on to show that sole proprietorships were about half as likely to default as incorporated firms, and partnerships were less than one-third as likely to default as incorporated firms. New firms (less than one year old) were approximately 3.7 times more likely to default than established firms, and young firms (1-3 years old) were 2.3 times more likely to default than established firms. CSBF loans issued by commercial lenders other than major banks were, collectively, about half as likely to default as loans issued by the major banks. Firms in the wholesale sector were especially at risk of early default; however, most sectors were relatively less risky than the manufacturing sector, which was the reference sector for this category. Non-franchises in both the retail and accommodation sectors appear to be somewhat more risky. However, franchises in both sectors appear to be less risky. As in the left-side of the table, the right side of the table demonstrates that the more employees, the lower the likelihood of late default and the greater the ratio of annual revenues to loan demands, the lower the risk of late defaults. The odds of default for sole proprietorships are 36 percent less than for incorporated firms, and partnerships were about half as likely to default as incorporated firms. New firms remain much more likely (2.75 times) to default than established firms whereas young firms (1-3 years old) were 1.85 times more likely to default than established firms. CSBF loans issued by commercial lenders other than major banks were, collectively, less likely to default as loans issued by the major banks but the difference among lender categories is not as pronounced as for early claims. Firms in the manufacturing sector reference category were especially at risk of late default. Most sectors were still relatively less risky than manufacturing. The least risky sector was primary industries which includes agriculture support activities, forestry, fishing and hunting, mining & oil and gas extraction). Franchises, in both the retail and accommodation etc. sectors, were again significantly less likely to exhibit late defaults. | ||||||||||
| Number of employees | 73,956 | −0.129 | 0.023 | 0.000 | 0.88 | 78,147 | −0.061 | 0.015 | 0.000 | 0.94 |
| Revenue/loan | 73,956 | −0.122 | 0.020 | 0.000 | 0.89 | 78,147 | −0.149 | 0.014 | 0.000 | 0.86 |
| Borrower TypeFootnote a | 0.000 | 0.000 | ||||||||
| Sole Proprietor | 11,187 | −0.577 | 0.067 | 0.000 | 0.56 | 11,669 | −0.453 | 0.042 | 0.000 | 0.64 |
| Partnership | 4,235 | −1.219 | 0.124 | 0.000 | 0.30 | 4,416 | −0.750 | 0.068 | 0.000 | 0.47 |
| Age of firmsFootnote a | 0.000 | 0.000 | ||||||||
| New Firms | 36,892 | 1.315 | 0.062 | 0.000 | 3.73 | 39,721 | 1.009 | 0.037 | 0.000 | 2.74 |
| 1 to 3 years | 10,358 | 0.840 | 0.077 | 0.000 | 2.32 | 10,889 | 0.614 | 0.047 | 0.000 | 1.85 |
| Category of lenderFootnote a | 0.000 | 0.000 | ||||||||
| Other bank or trust | 1,987 | −0.548 | 0.127 | 0.000 | 0.58 | 2,061 | −0.506 | 0.090 | 0.000 | 0.60 |
| Caisse Populaire | 17,881 | −0.610 | 0.053 | 0.000 | 0.54 | 19,071 | −0.066 | 0.031 | 0.033 | 0.94 |
| Credit Union | 5,957 | −0.988 | 0.106 | 0.000 | 0.37 | 6,175 | −0.605 | 0.061 | 0.000 | 0.55 |
| SectorFootnote a | 0.000 | 0.000 | ||||||||
| Primary sectors | 5,153 | −1.151 | 0.136 | 0.000 | 0.32 | 5,411 | −0.801 | 0.071 | 0.000 | 0.45 |
| Construction | 4,323 | −1.338 | 0.151 | 0.000 | 0.26 | 4,468 | −1.172 | 0.083 | 0.000 | 0.31 |
| Wholesale | 1,210 | 0.272 | 0.136 | 0.046 | 1.31 | 1,268 | −0.262 | 0.101 | 0.009 | 0.77 |
| Transportation etc. | 9,736 | −1.282 | 0.109 | 0.000 | 0.28 | 10,088 | −1.153 | 0.063 | 0.000 | 0.32 |
| Professional etc. Services | 2,003 | −0.451 | 0.145 | 0.002 | 0.64 | 2,056 | −0.948 | 0.105 | 0.000 | 0.39 |
| Info, cultural. etc. | 1,156 | −0.003 | 0.145 | 0.981 | 1.00 | 1,216 | −0.440 | 0.104 | 0.000 | 0.64 |
| Other services | 20,041 | −0.465 | 0.075 | 0.000 | 0.63 | 21,030 | −0.718 | 0.048 | 0.000 | 0.49 |
| Retail, franchises | 1,797 | −0.256 | 0.116 | 0.028 | 0.77 | 1,967 | −0.307 | 0.076 | 0.000 | 0.74 |
| Retail, non franchises | 9,018 | 0.044 | 0.080 | 0.580 | 1.05 | 9,537 | −0.350 | 0.052 | 0.000 | 0.71 |
| Accom etc., franchises | 5,932 | −0.486 | 0.088 | 0.000 | 0.62 | 6,394 | −0.585 | 0.057 | 0.000 | 0.56 |
| Accom. etc., non-franchises | 8,863 | 0.127 | 0.077 | 0.100 | 1.14 | 9,484 | −0.281 | 0.051 | 0.000 | 0.76 |
| Constant | −3.090 | 0.097 | 0.000 | 0.05 | −1.922 | 0.060 | 0.000 | 0.15 | ||
| Variable | Coefficient Estimate | Std. Error | p-value | Relative Likelihood |
|---|---|---|---|---|
Long description for Table 4This table 4 shows the results of using the proportional hazards model of time between disbursement and claim receipt to measure risk factors. Sole proprietorships and partnerships are less risky than incorporated firms and younger firms are riskier than more established enterprises. Risk increases based on the age of the firms with the youngest firms representing the greatest risk. CSBF loans from Credit Unions and Caisses Populaires have been relatively less risky than loans of banks and other commercial lenders. The least risky sector is that comprised of primary industries and that the riskiest sectors are, in decreasing order of risk: the wholesale sector, professional etc. services, non-franchises in the accommodation etc. sector and non-franchises in retail, and other services. | ||||
| Number of employees | −0.010 | 0.012 | 0.414 | 0.99 |
| Revenue/loan | 0.009 | 0.012 | 0.418 | 1.01 |
| Borrower TypeFootnote b | 0.010 | |||
| Sole Proprietor | −0.061 | 0.035 | 0.076 | 0.94 |
| Partnership | −0.152 | 0.058 | 0.009 | 0.86 |
| Age of firmsFootnote b | 0.000 | |||
| New Firms | 0.210 | 0.031 | 0.000 | 1.23 |
| 1 to 3 years | 0.162 | 0.039 | 0.000 | 1.18 |
| Category of lenderFootnote b | 0.000 | |||
| Other bank or trust | 0.037 | 0.070 | 0.601 | 1.04 |
| Caisse Populaire | −0.283 | 0.025 | 0.000 | 0.75 |
| Credit Union | −0.341 | 0.051 | 0.000 | 0.71 |
| SectorFootnote b | 0.000 | |||
| Primary sectors | −0.139 | 0.060 | 0.021 | 0.87 |
| Construction | 0.010 | 0.070 | 0.884 | 1.01 |
| Wholesale | 0.284 | 0.075 | 0.000 | 1.33 |
| Transportation/Warehousing | 0.028 | 0.052 | 0.588 | 1.03 |
| Professional, etc. services | 0.235 | 0.081 | 0.004 | 1.27 |
| Information etc. | 0.059 | 0.079 | 0.453 | 1.06 |
| Other services | 0.143 | 0.038 | 0.000 | 1.15 |
| Retail, franchises | 0.032 | 0.059 | 0.585 | 1.03 |
| Retail, non franchises | 0.177 | 0.040 | 0.000 | 1.19 |
| Accom., franchises | −0.027 | 0.044 | 0.536 | 0.97 |
| Accom., non-franchises | 0.203 | 0.039 | 0.000 | 1.23 |
| Franchise status | Legal Form | New Firms | 1–3 years | Established | Total |
|---|---|---|---|---|---|
Long description for Table 5This table breaks down claims rates for franchises and non-franchises across firm age categories and business type (legal form), that is, sole proprietor, partnership and incorporation. The rates of claims for franchises during the first year of firm development is higher than and than in subsequent years and compared to non-franchises. | |||||
| Non-franchises | Sole Proprietor | 11.3% | 7.3% | 4.8% | 8.5% |
| Partnership | 9.3% | 5.8% | 2.4% | 7.0% | |
| Incorporated | 20.3% | 11.8% | 5.9% | 13.4% | |
| Total | 17.9% | 10.7% | 5.6% | 12.2% | |
| Franchises | Sole Proprietor | 14.4% | 5.3% | 3.0% | 12.8% |
| Partnership | 11.3% | 6.7% | 5.3% | 10.3% | |
| Incorporated | 21.2% | 13.0% | 6.1% | 18.4% | |
| Total | 20.8% | 12.7% | 6.1% | 18.1% | |
| Total | Sole Proprietor | 11.4% | 7.2% | 4.8% | 8.6% |
| Partnership | 9.5% | 5.8% | 2.4% | 7.1% | |
| Incorporated | 20.5% | 11.9% | 5.9% | 14.2% | |
| Total | 18.5% | 10.9% | 5.6% | 13.0% | |
Summary and Conclusions
In delivering the Canada Small Business Financing program Industry Canada must provide for incremental private sector lending using a risk-sharing formula that that involves a reasonable program cost. It is therefore essential to understand the key drivers of risk in the CSBF portfolio. This understanding is necessary in order to allow the program authority to estimate current and future loss rates and to understand how changes to key parameters are likely to impact the balance between default costs and fee revenues while maintaining incrementality.
To this end, Industry Canada commissioned, during 2008, a study of drivers of risk. At that time Industry Canada had identified a number of borrower and loan attributes that correspond to higher default frequencies and claims costs. These include industry sector, type of borrower, age of borrower firms, class of loan, type of operation, size of loan and size of borrower. At that time, further study into the relationships of how these loan and borrower characteristics tend to correspond to higher claim costs was required and was carried. The ensuing analysis developed complex models that examined multiple dimensions of these characteristics on risk that took into account correlations among characteristics.
In the interim, the world has experienced a significant shift in credit market conditions that included the co-called "credit crisis" of 2008 and the period of recovery that continues, five years later. The work reported here repeats the analysis of risk drivers using additional data that now includes the period from 2008 through 2011. Using these data, this analysis has developed a much more parsimonious model, yet one that is as good a fit to the data as the previous model. The model developed in this work is much more user-friendly yet just as accurate as the model developed in 2008.
The results confirm the findings of the previous work in that age of firm and sector are primary sources of risk within the portfolio. The youngest firms are the most risky and loans to firms in the "Food services etc.", "Retail trade", and "Wholesale trade" sectors were particularly susceptible to risk in the sense that early claims within these sectors were significantly more likely. The previous study found that the risk of franchises was complex; this work partially decomposes the franchise effect, finding that the effect is limited to early claims (franchises were found to be neither more nor less risky than non-franchises over the long term) and that the franchise effect is sector-dependent. Among the clarifications is that for the two sectors that include the vast majority of franchises (retail and accommodation, food etc.) franchises are actually less likely to be a source of early claims. This is a reversal of the impact of franchises during the SBLA period, when they were notoriously bad risks.
Claims were also found to depend on size of firm (measured by number of employees) and the ability of the firm's cash flow to cover the loan amount (measured by the ratio of revenues to loan size). Potentially, this allows policy makers to develop a sliding scale of loan ceiling, one that is linked to the firms' revenues (for example, link the maximum loan size to the borrower firm's revenues). This would have a dual effect because it would arguably enrich the portfolio with what appear to be safer smaller loans and would also reduce the volume of claims because claims would reflect lower loan balances. Larger firms, as measured by number of employees, were less likely to default.
The role of franchise is seen to be complex. Table 5, which provided a breakdown of franchise claims rates suggests that franchises seem especially susceptible to default during the early stages of firm development and their impact is therefore likely included in the firm age variable to some (unknowable) extent. With this caveat, the results allow policy makers to use the following set of estimated impact factors (Table 6, a much simplified model relative to that derived in 2008) to simulate how changes in portfolio composition individually and collectively are likely affect the estimated rate of claims.
| Factor | Rule | Affects the likelihood of early claims by… | Affects the rate of late claims by… |
|---|---|---|---|
Long description for Table 6The first column of this table sets out a list of estimated impact factors to simulate how changes in portfolio composition individually and collectively are likely affect the estimated rate of claims: the number of employees, the ratio of annual revenues to loan, borrower type (sole proprietor and partnership), age of firm (new firms and 1 to 3 year firms), major banks, and the industry sector, relative to firms in the manufacturing sector, in which the borrower firm conducted its business. The second column describes the how an increase of 1 percent increase for any one factors (except in the number of employees and the ratio of revenue to loan) will affect the likelihood of early and late claims. In the cases of in the number of employees and the ratio of revenue to loan, the increase identified is one additional employee and a 10 percent increase in revenues. Columns 3 and 4 show the impact of the previously mentioned changes on the likelihood of early and late claims. In the case of the number of employees, the rate of decrease of early claims is significantly higher than late claims. For the ratio of annual revenues to loan, the decrease is the same in both types of claims. There was no significant change in the slight decrease in early and late involving sole proprietors and partnerships. The age of the business firms and the loans from major banks experienced an increase in the likelihood of early and late claims. Finally, for all of the major industry sectors, an increase in the number of loans would result in les than 1% fewer claims for both early and late claims. | |||
| Number of employees | Each additional employee… | Decrease of 12% | Decrease of 6% |
| Revenue/loan | A 10 percent increase in this ratio… | Decrease of 1.2% | Decrease of 1.4% |
| Borrower Type | |||
| Sole Proprietor | Relative to incorporated firms, a 1 percent increase in the proportion of sole proprietorships in the portfolio… | Decrease of 0.44% | Decrease of 0.36% |
| Partnership | Relative to incorporated firms, a 1 percent increase in the proportion of sole proprietorships in the portfolio… | Decrease of 0.70% | Decrease of 0.53% |
| Age of firms | |||
| New Firms | Relative to established firms, a 1 percent increase in the proportion of new firms in the portfolio… | Increase of 3.73% | Increase of 2.74% |
| 1 to 3 years | Relative to established firms, a 1 percent increase in the proportion of young firms in the portfolio… | Increase of 2.72% | Increase of 1.85% |
| Loans from major banks | A 1 percent increase in the proportion of loans from major banks… | Increase of approximately 2% | Increase of approximately 1.4% |
| Sector: relative to firms in manufacturing sector | A 1 percent increase in the number of loans to this sector results in… | ||
| Primary sectors | 0.68% fewer claims | 0.55% fewer claims | |
| Construction | 0.74% fewer claims | 0.69% fewer claims | |
| Wholesale | 0.31% more claims | 0.23% fewer claims | |
| Transportation etc. | 0.72% fewer claims | 0.68% fewer claims | |
| Professional etc. Services | 0.36% fewer claims | 0.61% fewer claims | |
| Info, cultural. etc. | Neither more nor fewer claims | 0.36% fewer claims | |
| Other services | 0.37% fewer claims | 0.51% fewer claims | |
| Retail, franchises | 0.23% fewer claims | 0.26% fewer claims | |
| Retail, non franchises | Neither more nor less claims | 0.29% fewer claims | |
| Accom etc., franchises | 0.38% fewer claims | 0.44% fewer claims | |
| Accom. etc., non-franchises | 0.14% more claims | 0.24% fewer claims | |