
Introduction
The Canadian Intellectual Property Office (CIPO) has directed its economic research and patent analytics capabilities to focus on standard-essential patents. This research is intended to explore patent activity across all technological areas with a focus on those that are linked to standards.
Standards are defined by the Standards Council of Canada as "agreed upon rules and guidelines that establish accepted practices, technical requirements and terminologies."Endnote i Standards are typically established by standard setting organizations (SSOs) such as the International Organization for Standardization (ISO) and the European Telecommunications Standards Institute (ETSI). They are especially common in the Information and Communications Technology (ICT) sector where they act as agreed protocols to ensure various technologies from different companies can operate together. Moreover, they are written protocols that ensure interoperability and compatibility between technologies.
Patents relevant to forming such standards are called standard-essential patents (SEPs). A SEP is a type of patent whose rights would be licensed to anyone wanting to comply with the related standard. In exchange for a patent being included in a standard, the owner of a SEP makes the commitment to license it on the basis of "fair, reasonable and non-discriminatory" (FRAND) royalties, or royalty-free. Standardized technologies, like Wi-Fi, 4G, and 5G networks in telephony used by many organizations rely on SEPs. As SEPs become more prevalent and valuable, there is an increasing need to analyze these types of patents. This blog presents the evolution of SEPs and highlights some further insights derived from a database called PatentVector.Footnote 1
Dataset
Using PatentVector, a total of 22,851 patented inventions with SEP status were identified globally between the application years 1990 and 2018.Footnote 2 In Figure 1, the top trapezoid presents these 22,851 SEP inventions which are attributable to a total of 777 institutions and 16,092 inventors in the world. We designate any patented invention as "Canadian" if at least one inventor or one assignee (institution or person) has a Canadian registered address. Using this definition, a total of 1,041 Canadian SEP inventions, or roughly 4.6 percent, were identified in our dataset. The bottom two overlapping prongs show that there are 372 patented inventions attributable to a total of 27 Canadian institutions as assignees and 896 patented inventions with a total of 437 Canadian inventors.Footnote 3
Figure 1: Breakdown of the dataset analyzed for this report

Figure 1 - Text version
Figure 1 is a diagram in the shape of an upside down triangle showing a breakdown of the SEP inventions dataset. The upper partition shows that worldwide SEP inventions were 22,851. This partition is shaded in light orange with text in white. On the right hand side of this partition is the entity count showing that a total of 777 institutions and 16,092 inventors were responsible for these worldwide SEP inventions. The middle partition shows that 1,041 worldwide SEP inventions were attributable to Canadian entities. On the right hand side of this partition is the entity count which shows that a total of 27 Canadian institutions and 437 Canadian inventors. This partition is shaded in dark orange with text in white. The bottom portion has two overlapping inverted triangles. The left triangle shows that the SEP inventions attributable to Canadian institutions were 372. The right triangle shows that the SEP inventions attributable to Canadian inventors were 896. This partition is shaded in brown with text in white.
Standard Setting Organizations
Standard Setting Organizations are integral in developing agreed upon frameworks for implementing a standard amongst a diverse group of entities. In general, SSOs are "industry organizations whose members choose to participate voluntarily", involving "cooperative decision making by members with varying rules for the formation of consensus."Endnote ii The relationship between SSOs and their patent-producing members is therefore complicated. On the one hand, it is generally accepted that patents which are standard essential are valuable.Endnote iiii On the other hand, there exists incentives for SSO members to declare patents of little value as standard essential when agreeing on a standard.Endnote iv Hence, the relationship between SSOs and patents remain an important feature of SEPs, which we explore in the tables below.
In our dataset, we have 12 different SSOs that tend to focus on telecommunications.Footnote 4 Figure 2 shows the distribution of SEP inventions across the SSOs. The European Telecommunications Standards Institute (ETSI) accounts for 17,491 SEP inventions, or 78% of the total SEP inventions. ETSI is an SSO with more than 900 members involved in "the timely development, ratification and testing of globally applicable standards for ICT-enabled systems, applications and services."Endnote v
Figure 2: Number of SEP inventions by Standard Setting Organization between application years 1990 and 2018

Figure 2 - Text version
| Standard Setting Organization | SEP Inventions |
|---|---|
| ETSI | 17,491 |
| ITU-T | 1,223 |
| IEEE | 815 |
| IMT | 797 |
| ISO | 661 |
| OMA | 637 |
| ANSI | 251 |
| CCSA | 204 |
| ITU-R | 198 |
| ATIS | 65 |
| OneM2M | 37 |
| TIA | 9 |
| Unknown SSO | 160 |
Evolution of Standard Essential Patented Inventions
Figure 3 shows the growth of SEP inventions between application years 1990 and 2018. SEP inventions have significantly increased during this timeframe from as few as 57 patented inventions in 1990 to 2,406 patented inventions in 2018. The average annual growth rate of SEP inventions between 1990 and 2018 is 16%, with the largest year-over-year percentage increase (72%) in 2000 and the lowest (-19%) in 2009.
Figure 3: Filing trend for SEP inventions by institutions worldwide between 1990 and 2018

Figure 3 - Text version
| Application Year | SEP Inventions | Annual Growth Rate |
|---|---|---|
| 1990 | 57 | - |
| 1991 | 61 | 7.02% |
| 1992 | 66 | 8.20% |
| 1993 | 91 | 37.88% |
| 1994 | 95 | 4.40% |
| 1995 | 86 | -9.47% |
| 1996 | 102 | 18.60% |
| 1997 | 134 | 31.37% |
| 1998 | 181 | 35.07% |
| 1999 | 188 | 3.87% |
| 2000 | 324 | 72.34% |
| 2001 | 412 | 27.16% |
| 2002 | 365 | -11.41% |
| 2003 | 321 | -12.05% |
| 2004 | 430 | 33.96% |
| 2005 | 666 | 54.88% |
| 2006 | 962 | 44.44% |
| 2007 | 1083 | 12.58% |
| 2008 | 1293 | 19.39% |
| 2009 | 1045 | -19.18% |
| 2010 | 1068 | 2.20% |
| 2011 | 898 | -15.92% |
| 2012 | 1019 | 13.47% |
| 2013 | 1250 | 22.67% |
| 2014 | 1859 | 48.72% |
| 2015 | 1803 | -3.01% |
| 2016 | 1762 | -2.27% |
| 2017 | 2099 | 19.13% |
| 2018 | 2406 | 14.63% |
Figure 4 shows the filing trends of the five world-leading countries in SEP inventions. Chinese institutions ranked first with 6,344 SEP inventions between the application years 1990 and 2018. China has experienced a significant increase in SEP inventions since the mid 2000s, which coincides with their burgeoning telecommunications industry.Endnote vi American institutions rank second with 4,349 SEP inventions, followed by institutions from Japan, Korea and Finland.
Figure 4: Filing trend for SEP inventions by institutions from leading countries between 1990 and 2018

Figure 4 - Text version
| Year | China | United States of America | Japan | Republic of Korea | Finland |
|---|---|---|---|---|---|
| 1990 | 0 | 24 | 11 | 0 | 0 |
| 1991 | 0 | 21 | 20 | 1 | 3 |
| 1992 | 0 | 34 | 16 | 0 | 2 |
| 1993 | 0 | 39 | 24 | 6 | 1 |
| 1994 | 0 | 41 | 24 | 0 | 7 |
| 1995 | 0 | 36 | 18 | 3 | 3 |
| 1996 | 0 | 48 | 15 | 3 | 8 |
| 1997 | 6 | 50 | 17 | 9 | 18 |
| 1998 | 1 | 43 | 39 | 41 | 19 |
| 1999 | 3 | 55 | 14 | 43 | 31 |
| 2000 | 4 | 55 | 19 | 110 | 80 |
| 2001 | 0 | 73 | 28 | 112 | 154 |
| 2002 | 3 | 94 | 30 | 50 | 119 |
| 2003 | 8 | 49 | 46 | 49 | 111 |
| 2004 | 21 | 86 | 77 | 77 | 77 |
| 2005 | 69 | 207 | 78 | 195 | 59 |
| 2006 | 103 | 336 | 180 | 157 | 124 |
| 2007 | 123 | 373 | 175 | 166 | 100 |
| 2008 | 213 | 293 | 327 | 122 | 150 |
| 2009 | 176 | 197 | 322 | 105 | 117 |
| 2010 | 153 | 148 | 362 | 138 | 78 |
| 2011 | 150 | 163 | 283 | 61 | 102 |
| 2012 | 279 | 161 | 155 | 184 | 138 |
| 2013 | 462 | 165 | 243 | 173 | 122 |
| 2014 | 824 | 182 | 399 | 197 | 138 |
| 2015 | 744 | 214 | 475 | 163 | 94 |
| 2016 | 704 | 232 | 456 | 191 | 75 |
| 2017 | 1,009 | 423 | 240 | 204 | 66 |
| 2018 | 1,289 | 507 | 203 | 237 | 49 |
Canadian institutions were associated with a total of 372 SEP inventions over that same time period. They recorded high growth in the mid-to-late 2000s, peaking in 2010 with 59 SEP inventions. While Canadian institutions had fewer SEP inventions than the leading countries, it can be observed that Canada is on par with other leading economies such as France, Germany, and the United Kingdom. This is displayed in Figure 5, which presents the filing trends for Canadian, French, German, and British institutions.
Figure 5: Filing trend for SEP inventions by institutions from Canada and other select countries between 1990 and 2018

Figure 5 - Text version
| Year | France | Canada | Germany | United Kingdom |
|---|---|---|---|---|
| 1990 | 4 | 2 | 4 | 5 |
| 1991 | 8 | 1 | 0 | 1 |
| 1992 | 3 | 1 | 2 | 3 |
| 1993 | 2 | 1 | 4 | 3 |
| 1994 | 5 | 0 | 2 | 2 |
| 1995 | 4 | 6 | 3 | 5 |
| 1996 | 5 | 6 | 5 | 3 |
| 1997 | 7 | 18 | 6 | 2 |
| 1998 | 6 | 7 | 4 | 4 |
| 1999 | 7 | 17 | 10 | 0 |
| 2000 | 14 | 13 | 16 | 3 |
| 2001 | 9 | 10 | 14 | 1 |
| 2002 | 18 | 10 | 5 | 0 |
| 2003 | 28 | 6 | 12 | 3 |
| 2004 | 24 | 22 | 19 | 2 |
| 2005 | 27 | 11 | 15 | 3 |
| 2006 | 26 | 18 | 9 | 9 |
| 2007 | 49 | 11 | 25 | 6 |
| 2008 | 56 | 51 | 16 | 10 |
| 2009 | 65 | 20 | 5 | 3 |
| 2010 | 57 | 59 | 7 | 4 |
| 2011 | 36 | 17 | 11 | 2 |
| 2012 | 38 | 12 | 15 | 2 |
| 2013 | 25 | 10 | 7 | 0 |
| 2014 | 43 | 4 | 40 | 6 |
| 2015 | 15 | 13 | 19 | 4 |
| 2016 | 12 | 21 | 6 | 3 |
| 2017 | 8 | 4 | 14 | 0 |
| 2018 | 0 | 1 | 18 | 0 |
Leading Institutions Abroad and in Canada
The top ten institutions that are named as assignees on SEP inventions are listed in Figure 6. The majority of the institutions in the figure are large players in the ICT sector, and more specifically in telecommunications. Our dataset shows Huawei Technologies Inc., based in China, leads the way with a total of 3,512 patented inventions. Sharp Co. Ltd., based in Japan, and Qualcomm Inc., based in the United States, follow with 2,428 and 2,408 patented inventions, respectively.
Figure 6: Leading institutions worldwide in SEP inventions between applicatin years 1990 and 2018.

Figure 6 - Text version
| Leading Worldwide Institutions | SEP Inventions |
|---|---|
| ZTE Corporation, CN | 387 |
| Telefonaktiebolaget L M Ericsson, SE | 444 |
| NTT DoCoMo Inc., JP | 497 |
| Xiaomi Communication Technology Co. Ltd., CN | 785 |
| LG Electronics Inc., KR | 924 |
| Samsung Electronics Co. Ltd., KR | 1,610 |
| Nokia Inc., FI | 1,882 |
| Qualcomm Inc., US | 2,408 |
| Sharp Co. Ltd., JP | 2,428 |
| Huawei Technologies Inc., CN | 3,512 |
Table 1 displays in descending order the leading Canadian institutions involved in SEP inventions and their respective leading inventors. It should be noted that, while all of the institutions are Canadian, their leading inventors are not necessarily from Canada. Canada's top institution holding SEP inventions in our dataset is BlackBerry Ltd. with a total of 204, followed by Nortel Networks Ltd. and Huawei Technologies Canada Co. Ltd. with 56 and 32 SEP inventions, respectivelyFootnote 5.
Table 1: Leading Canadian institutions and their top inventor(s) of SEP inventions

Tables 1 - Text version
| Number of SEP inventions | Number |
|---|---|
| BlackBerry Ltd. (ON) | 204 |
| Nortel Networks Limited (QC) | 56 |
| Huawei Technologies Canada Co. Ltd. (ON) | 32 |
| Certicom Corp. (ON) | 18 |
| Voiceage Corporation (QC) | 17 |
| Alcatel Canada Inc. (ON) | 8 |
| Sierra Wireless Inc. (BC) | 8 |
| Wi-Lan Inc. (ON) | 8 |
| Mitel Corporation (ON) | 3 |
| University of Sherbrooke (QC) | 2 |
| Number of SEP inventions | Number |
|---|---|
| Zhijun, Cai (US) | 33 |
| Wen, Tong (ON) | 15 |
| Tho, Le-Ngoc (QC) | 8 |
| Scott C., Vanstone (ON) | 8 |
| Roch, Lefebvre | 10 |
| Redwan, Salami | 10 |
| Bruno, Bessette | 10 |
| Haiqing H., Ma (ON) | 3 |
| Gustav Gerald, Vos (BC) | 6 |
| Kenneth L., Stanwood (US) | 4 |
| Abdulkader Omar, Barbir (ON) | 2 |
| Jean-Pierre, Adoul (QC) | 1 |
Global Patent Landscape
The patent landscape map presented in Figure 7 shows the key technology fields where there is a high concentration of SEP inventions. This map is generated using an algorithm that relies on word sequences from patent documentation to cluster patented inventions according to shared language. The patented inventions are organized based on common themes and grouped as "contours" on the map to identify areas of high and low patent activity. The white peaks, such as "Wireless Access Communication System", and "Mobile Station Apparatus", represent the highest concentrations of patented inventions, and each peak is labelled with key terms that tie the common themes together. This is consistent with the notion that SEP inventions are predominately tied to the telecommunications sector. The distance between word sequences helps to illustrate the relationship between peaks, where shorter distances indicate that the patented inventions they represent share more commonalities relative to those that are further apart. Word sequences located close together may be part of similar systems or technologies, whereas word sequences that are further apart are less likely to be related or share less in common. For example, SEP inventions related to "Mobile Station Apparatus" and "Station Apparatus" are near one another, and relatively distanced from the "Encoder" hill in the top-right corner.
Figure 7: Global patent landscape map for SEP inventions
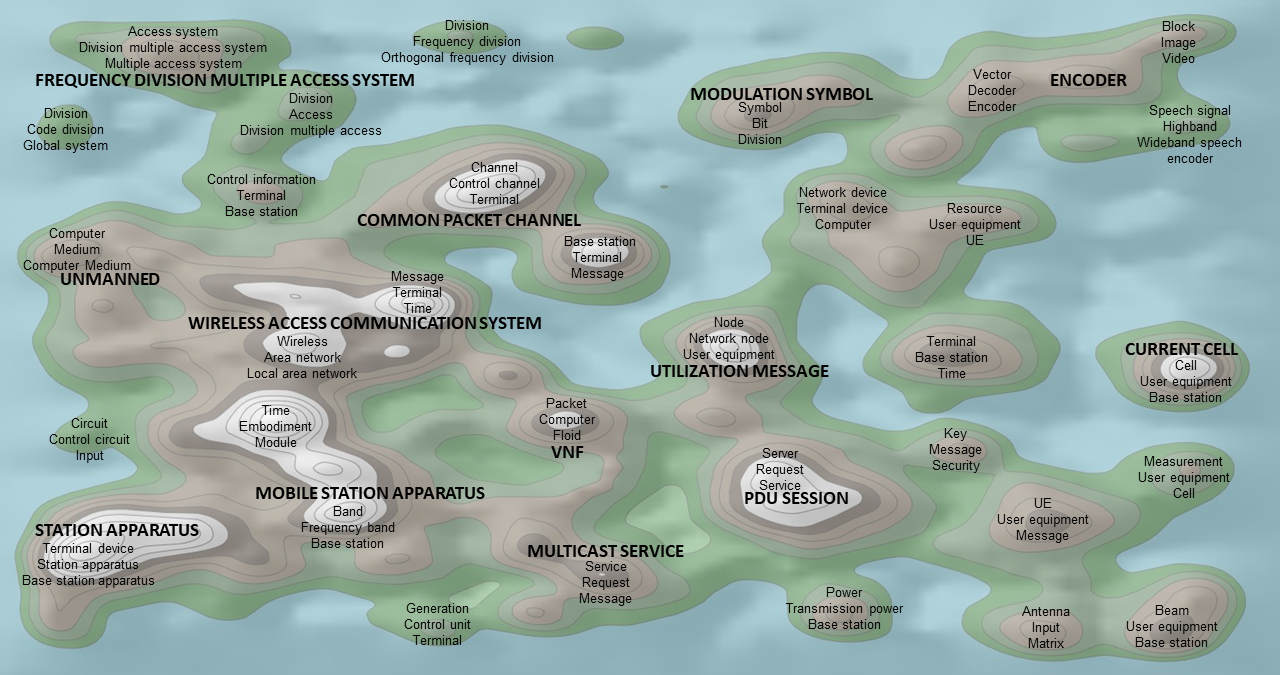
Figure 7 - Text version
Figure 7 is a patent landscape map that provides a visual representation of global patent activities in data set in this report. Derwent Innovation's ThemeScape mapping tool was utilized to produce this visualization, using term frequency (keywords from a patents title and abstract) and other algorithms to cluster documents based on shared language. The result is a patent landscape map, a map very much resembling that of a topographic map, where there are sections of turquoise and white. Sections are comprised of peaks, some of which have bright white peaks, representing the highest concentration of patents and are labelled with key terms that tie common themes together. Turquoise is used to separate terms where there is no commonality between them.
Broad themes written in all capital letters include:
- Frequency Division Multiple Access System
- Encoder
- Modulation Symbol
- Common Packet Channel
- Unmanned
- Wireless Access Communication System
- Utilization Message
- Current Cell
- VNF
- PDU Session
- Mobile Station Apparatus
- Station Apparatus
- Multicast Service
Prominent word sequences in this graph include:
- Access System; Division Multiple Access System; Multiple Access System
- Division; Frequency Division; Orthogonal Frequency Division
- Block; Image; Video
- Vector; Decoder; Encoder
- Division; Access; Division Multiple Access
- Symbol; Bit; Division
- Division; Code Division; Global System
- Speech Signal; Highband; Wideband Speech Encoder
- Control Information; Terminal; Base Station
- Channel; Control Channel; Terminal
- Network device; Terminal Device; Computer
- Resource; User Equipment; UE
- Computer; Medium; Computer Medium
- Base Station; Terminal; Message
- Message; Terminal; Time
- Wireless; Area Network; Local Area Network
- Node; Network Node; User Equipment
- Terminal; Base Station; Time
- Cell; User Equipment; Base Station
- Time; Embodiment; Module
- Packet; Computer; Floid
- Circuit; Control Circuit; Input
- Key; Message; Security
- Server; Request; Service
- Measurement; User Equipment; Cell
- Band, Frequency Band; Base Station
- UE; User Equipment; Message
- Terminal Device; Station Apparatus; Base Station Apparatus
- Service; Request; Message
- Power; Transmission Power; Base Station
- Generation; Control Unit; Terminal
- Antenna; Input; Matrix
- Beam; User Equipment; Base Station
Conclusion
This blog post represents the Canadian Intellectual Property Office's (CIPO) preliminary analysis on standard-essential patents (SEPs) and uses data collected by PatentVector. In this dataset consisting of 12 standard setting organizations, we find that the number of SEP inventions has drastically increased between application years 1990 and 2018, especially in the Information and Communications Technology sector. Chinese, American and Japanese institutions held the largest number of SEP inventions. Canadian institutions and inventors, with 1,041 SEP inventions, account for approximately 4.6% of the total of SEP inventions in our data. CIPO intends to publish a more comprehensive report on SEPs and the SEP landscape in Canada in the coming months. This comprehensive report will dive deeply into the data, with a focus on Canadian institutions.