
View as PDF (PDF: 2.57 MB; 34 pages)
The Intellectual Property (IP) Canada Report 2016 discusses trends in the use of IP, both domestically and by Canadian innovators and businesses abroad. This report relies both on CIPO's own internal data and on data from the World Intellectual Property Organization (WIPO), which collects data from around the world.
CEO's Message
CEO's Message
As Chief Executive Officer of the Canadian Intellectual Property Office (CIPO), I am pleased to present to you the first Intellectual Property Canada Report.
The report explores the use of the intellectual property (IP) system in Canada, and the use of the global IP system by Canadians. As well, the report looks at patenting in climate change mitigation technologies, an important component in addressing this global challenge.
Canadian patent filings around the world are increasing faster than our rate of economic growth. Canada's relationship with the United States is evident in the report. Our deep economic ties are reflected in the large number of cross-border IP filings.
It is clear that Canadians are taking advantage of the expanding global marketplace. The Government of Canada's Innovation Agenda and CIPO's business strategy will ensure that businesses and innovators are well supported in their effort to take full advantage of the global opportunities they have worked hard to create.
Tracking these trends and developments provides us with a better understanding of innovation in Canada, as well as the pathways businesses are taking, as they pursue success in the global marketplace. This, in turn, will help the Government to more efficiently design and target services to help businesses achieve their goals.
Johanne Bélisle
Chief Executive Officer
About us
About us
The Canadian Intellectual Property Office (CIPO), a Special Operating Agency (SOA) of Innovation, Science, and Economic Development Canada (ISED), is responsible for the administration and processing of intellectual property in Canada. CIPO contributes to Canada's innovation and economic success by: providing greater certainty in the marketplace through high quality and timely IP rights; fostering and supporting invention and creativity through knowledge sharing; raising awareness to encourage innovators to better exploit IP; helping businesses compete globally through international cooperation and the promotion of Canada's IP interests; and administering Canada's IP system and office efficiently and effectively.Footnote 1
Summary
Executive summary
While the rate of Canadians filing for IP rights domestically has been somewhat stable, Canadians filing abroad has increased at a higher rate. In 2015, CIPO received applications for 36,964 patents (4% growth from 2014), 52,461 trademarks (3% growth), and 5,846 industrial designs (1% growth). CIPO also granted 22,201 patents (7% decline from 2014), registered 31,507 trademarks (26% growth), and registered 5,728 industrial designs (8% decline).
In 2014, the most recent year of international data available, Canadians applied for 35,364 IP rights abroad - 19,826 patents, 13,990 trademarks, and 1,548 industrial designs. This was slightly below the 2013 combined total of 36,119 applications abroad (a record high), but still represented 35% growth in international IP applications since 2005. In particular, Canadians filed 34% more patents abroad in 2014 than 2005, with 24% growth in direct filings abroad and 56% growth in Canadians filing abroad through the Patent Cooperation Treaty (PCT).
Several long-running trends continued in 2015:
- Historically, Canada has a relatively low share of patent applications that are filed by residents, due to the fact that we are a small, open economy. In 2015, the resident share was 12%, unchanged from 2014.
- Applicants have an increasing preference for using the Patent Cooperation Treaty, which allows for simultaneous applications in multiple countries. PCT applications now account for 80% of applications at CIPO, an all-time high. This is an increase from 73% in 2006.
- The U.S. remains the largest counterparty in Canadian international IP applications. The U.S. represents a major source of applications to CIPO, with 49% of patent applications, 32% of trademark applications, and 56% of industrial design applications originating there. Conversely, more than half of all applications for IP rights filed by Canadians internationally were filed in the United States.
- Many Canadian businesses have the United States as their primary market, so direct patent filings to the U.S. are more common than PCT filings. However, the trend is towards increased use of the PCT, signalling that more Canadians are going outside of the U.S. with their inventions.
- Canadians have expanded their applications to China. Over the period 2005-2014, Canadian IP applications in China grew by 52% for patents, 138% for trademarks, and 205% for industrial designs.
- Since the 2008-2009 recession, there has been a recovery in applications for trademarks (up 21%) and industrial designs (up 37%). Both measures are now well above pre-recession levels.
Other noteworthy observations:
- Although the total number of patent applications has grown in each of the last two years, Canada is still more than 10% below 2006 levels.
- Canada is an important player in the development and patenting of climate change mitigation technologies, with relative specialization in carbon capture, buildings and smart grids.
Intro
Introduction
This report analyzes recent trends in intellectual property (IP) in Canada. The statistics in this report illuminate the growth in the use of IP rights in Canada, as well as by Canadians filing abroad. Data in this report is drawn primarily from CIPO and from the World Intellectual Property Organization (WIPO), which disseminates data on international IP activity. By examining recent trends, we can better understand Canadian economic activity, and see how the use of IP has evolved over time. This report first examines filings at CIPO, by type and origin; secondly, it examines the IP activity of Canadians internationally; thirdly, it looks at the time to approval for different types of IP in Canada; and fourthly, the report focuses on Canadian patenting in one particular sector, climate change mitigation technologies, to help us better understand our competitive advantages.
IP has never been more important. IP is an important tool for protecting intangible assets, which are corporate assets that are not physical assets. In a knowledge economy, intangible assets make up the largest share of business value, and IP rights are the key framework for preserving and unlocking that value.Footnote 2 IP rights allow businesses to protect their brand and inventions, facilitating activities like marketing and R&D.Footnote 3
The protection of IP is an increasingly vital factor in the global economy. Globally, IP applications have grown nearly 70% in ten years, to over 11 million in 2014.Footnote 4 Canadian businesses continue to expand into international markets, making the protection of IP in those markets highly important. IP rights have also become a key component of international trade deals.Footnote 5 International trade is a major part of Canada's economy, with individuals and businesses from over 120 countries around the world filing for IP rights in Canada in 2015.Footnote 6
Canada continues to be a world leader in innovation, ranking sixth in the world in innovation quality and sixteenth in innovation overall, according to the World Intellectual Property Organization's Global Innovation Index.Footnote 7 The Taylor Wessing 2016 Global Intellectual Property Index ranked Canada fourth overall in 2016, improving from eleventh in 2013.Footnote 8 The Taylor Wessing index is based on the views of intellectual property (IP) users, and provides a comparison of IP regimes in 43 jurisdictions.
The close economic links between Canada and the U.S. are reflected in the IP data. In 2015, Americans applied for 17,966 patents (49% of the total), 16,724 trademarks (32% of the total), and 3,260 industrial designs (56% of the total) at CIPO. In 2014, the most recent year of WIPO data available, Canadians applied for 12,963 patents (65% of Canadian patent applications abroad), 6,980 trademarks (50% of Canadian trademark applications abroad), and 951 industrial designs (61% of Canadian ID applications abroad) at the United States Patent and Trademark Office (USPTO).
Another key trend over the last decade was the temporary decline in Canadian IP activity during the 2008-2009 global recession, and the subsequent recovery to normal levels. Although growth since the crisis has been relatively slow in all advanced economies including CanadaFootnote 9, our IP activity has returned to a growth trend. Canada was in a technical recession for part of 2015 due to a marked decline in the prices of oil and natural gasFootnote 10, but this did not produce a downturn in IP activity, as applications for patents, trademarks, and industrial designs all grew from 2014. Applications for different types of IP rights follow different types of economic activity. Grants and registrations are more volatile, as they reflect both past application volume and in-house productivity, but CIPO has made significant improvements in inventory management.
IP in Canada
Intellectual property in Canada
This section describes the trends in patents, trademarks, and industrial designs, by examining both applications and grants or registrations. CIPO administers four main types of formal IP rights: copyrights, patents, trademarks, and industrial designs (IDs). Copyrights do not have to be registered to be legally effective. Therefore, data on copyrights does not provide a complete picture on the use of this type of IP right and is not considered in this report. CIPO also uses a separate process to protect integrated circuit topographies, which are the three-dimensional configurations of electronic circuits embodied in integrated circuit products or layout designs. Plant breeders' rights are managed by the Canadian Food Inspection Agency.Footnote 11 Specific definitions of patents, trademarks, and industrial designs, as well as information about cost and duration, are included in the appendix.
There are two main ways of tracking changes in the volume of IP rights: by the number of applications, and by the number of grants (patents) or registrations (trademarks and industrial designs) at CIPO. Due to the time lag, applications granted this year are typically applications which were made in past years.Footnote 12
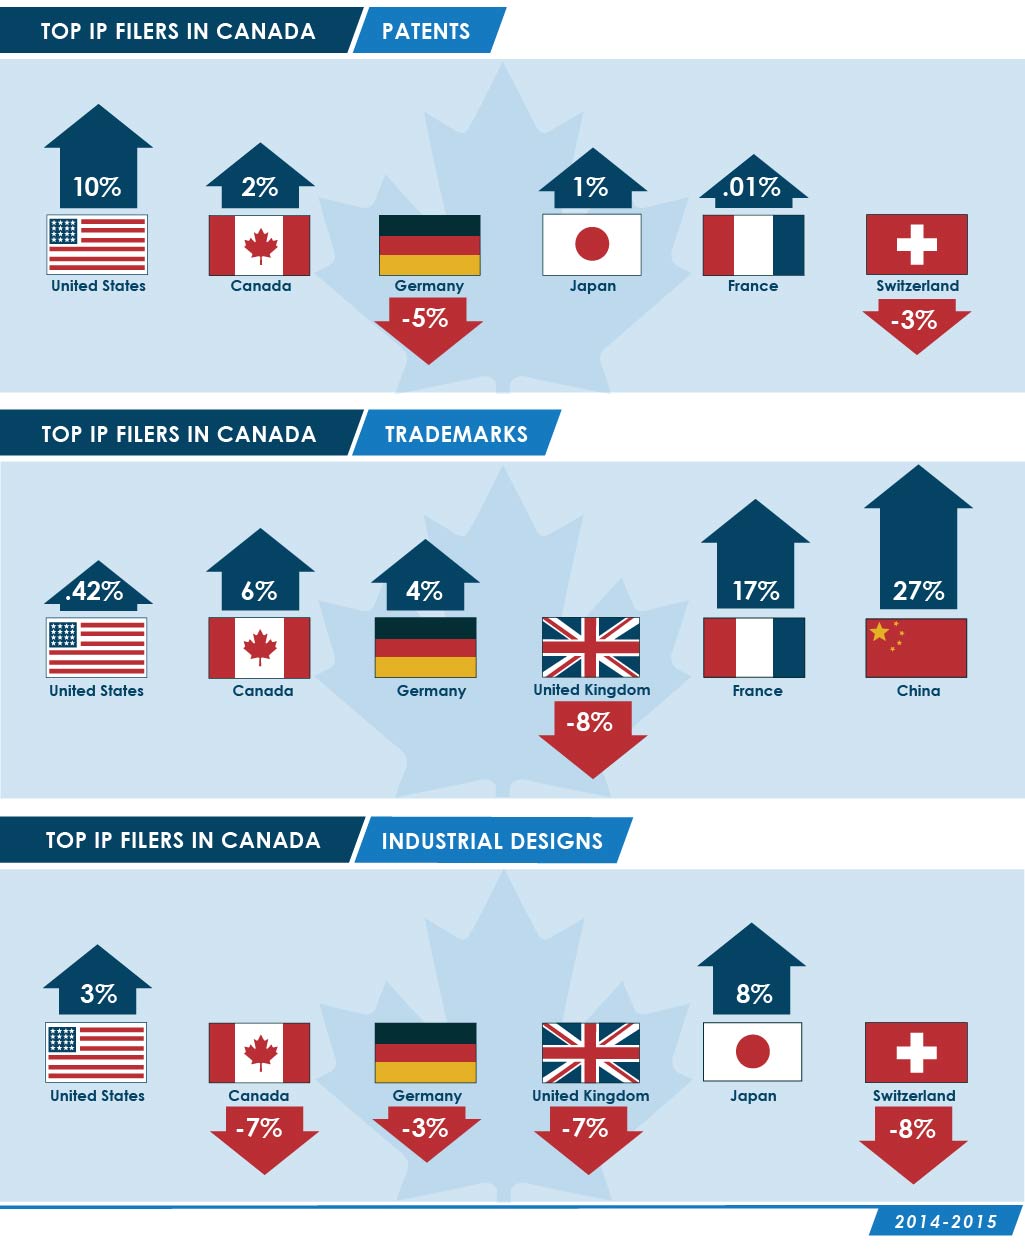
Figures 1, 2 and 3 show the top six filers for each of the types of IP right. As in past years, the U.S. remains the largest international filer in Canada for all categories of IP rights. For both patents and industrial designs, CIPO receives more applications from the U.S. than from Canada. Germany was in third place in all three categories in 2015, although that has not always been the case. In 2014, the United Kingdom was third in trademarks, and Switzerland was third in industrial designs.Footnote 13
Descriptions for Figure 1, 2 and 3 - Top IP filers in Canada
| Filer | 2015 | % total filings at CIPO | 2014-2015 |
|---|---|---|---|
| United States of America | 17,966 | 49% | 10% |
| Canada | 4,277 | 12% | 2% |
| Germany | 2,237 | 6% | -5% |
| Japan | 1,873 | 5% | 1% |
| France | 1,743 | 5% | 0% |
| Switzerland | 1,342 | 4% | -3% |
| Filer | 2015 | % total filings at CIPO | 2014-2015 |
|---|---|---|---|
| Canada | 22,589 | 43% | 6% |
| United States of America | 16,724 | 32% | 0% |
| Germany | 1,505 | 3% | 4% |
| United Kingdom | 1,432 | 3% | -8% |
| France | 1,383 | 3% | 17% |
| China | 1,052 | 2% | 27% |
| Filer | 2015 | % total filings at CIPO | 2014-2015 |
|---|---|---|---|
| United States of America | 3,260 | 56% | 3% |
| Canada | 797 | 14% | -7% |
| Germany | 194 | 3% | -3% |
| Switzerland | 192 | 3% | -8% |
| Japan | 180 | 3% | 8% |
| United Kingdom | 171 | 3% | -7% |
Patents
Patents provide a time-limited, legally protected, exclusive right to make, use, and sell an invention. This allows businesses to profit from their inventions, incentivizing creativity and innovation. Patents are in use in nearly every country in the world, and growth in global filings for patents has been rapid.Footnote 14 In 2015, the total number of patent applications at CIPO grew by 4% to 36,964, of which 4,277 were by Canadian residents and 32,687 were by non-residents. Direct applications to CIPO comprised 20% of this total, with the other 80% coming through the PCT. CIPO granted 22,201 patents in 2015, a decline of 7% from 2014. Of total grants, 2,858 were to Canadian residents and 19,343 were to non-residents. Patent applications to CIPO have declined by 12% since 2006. In the data, we see that the level of patenting in Canada has followed the same trend as Canada's GDP from manufacturing. Manufacturing GDP fell by 11 percent from 2000 to 2014.Footnote 15
Figure 4 compares patent applications to real GDP from manufacturing, since 2006.
| Year | Patent applications filed | GDP from manufacturing |
|---|---|---|
| 1995 | 100 | 100 |
| 1996 | 104 | 101 |
| 1997 | 107 | 108 |
| 1998 | 128 | 113 |
| 1999 | 140 | 122 |
| 2000 | 149 | 136 |
| 2001 | 149 | 129 |
| 2002 | 149 | 130 |
| 2003 | 140 | 129 |
| 2004 | 144 | 132 |
| 2005 | 150 | 134 |
| 2006 | 158 | 132 |
| 2007 | 151 | 129 |
| 2008 | 158 | 122 |
| 2009 | 141 | 106 |
| 2010 | 133 | 111 |
| 2011 | 132 | 114 |
| 2012 | 133 | 117 |
| 2013 | 131 | 116 |
| 2014 | 133 | 120 |
| 2015 | 139 | 120 |
Some researchers explain this co-movement by pointing to manufacturing activity as a primary driver of the type of innovation that produces patentable inventions and processes, particularly in advanced economies like Canada and the United States.Footnote 16 Research on European patent activity by the Austrian Institute of Economic Research suggests that specialization in information technology patents and business R&D expenditure, are both predictive of higher per capita patent applications.Footnote 17 Patents protect products from being produced by competitors. It is also possible that foreign firms are filing fewer patents in Canada because they are less concerned about the ability of firms operating in Canada to compete with their production. Research also suggests that the rate of innovation has a positive effect on the growth rate of output in manufacturing.Footnote 18
Patent applications
In 2015, patent applications to CIPO filed by Canadian residents grew by 2% to 4,277. Our residents filed 12% of patent applications at CIPO, the same domestic share as in 2014. Globally, the average share of patents filed in a country by its domestic residents is 67%. Canada's share of applications by residents is much lower than average because Canada is a small open economy that has very close economic links to a large neighbour, the United States. As a result, we receive a large number of patent applications from the U.S., and the rest of the world. This is consistent with other countries in a similar situation, such as Australia, which has a resident application share of about 10% on average.Footnote 19
The U.S. continues to be the largest filer in Canada, with a total of 17,966 applications in 2015.Footnote 20 Other top filers are Germany (2,237), Japan (1,873), France (1,743), and Switzerland (1,342). Combined, the top 5 non-resident filers represent 77% of the non-resident applications in Canada, and 68% of the total.
Figure 5 shows the changes in total patent applications to CIPO, with both residential and non-residential applications declining since 2006.
| Year | Resident | Non-resident | Total |
|---|---|---|---|
| 2006 | 5,522 | 36,516 | 42,038 |
| 2007 | 4,998 | 35,133 | 40,131 |
| 2008 | 5,061 | 37,028 | 42,089 |
| 2009 | 5,067 | 32,410 | 37,477 |
| 2010 | 4,550 | 30,899 | 35,449 |
| 2011 | 4,754 | 30,357 | 35,111 |
| 2012 | 4,709 | 30,533 | 35,242 |
| 2013 | 4,567 | 30,174 | 34,741 |
| 2014 | 4,198 | 31,283 | 35,481 |
| 2015 | 4,277 | 32,687 | 36,964 |
Figure 6 shows that, in 2015, 29,393 of the patents filed with CIPO entered through the Patent Cooperation Treaty (PCT). The PCT is an international agreement which allows filers to make a single international application for a patent to any and all signatory states.Footnote 21 The streamlined PCT process is cheaper and more convenient for those seeking protection in a number of countries.Footnote 22 One long-running trend which continued in 2015 was the shift away from direct applications and toward applications through the PCT. Direct applications have declined for four consecutive years, and are down 34% in the last ten years. The share of filings through the PCT is now 80%.Footnote 23 Furthermore, only 15% of non-resident applications to Canada are direct filings.
| Year | Total direct | Total PCT | Total |
|---|---|---|---|
| 2006 | 11,502 | 30,536 | 42,038 |
| 2007 | 10,553 | 29,578 | 40,131 |
| 2008 | 10,114 | 31,975 | 42,089 |
| 2009 | 9,308 | 28,169 | 37,477 |
| 2010 | 7,989 | 27,460 | 35,449 |
| 2011 | 8,352 | 26,759 | 35,111 |
| 2012 | 8,338 | 26,904 | 35,242 |
| 2013 | 8,114 | 26,627 | 34,741 |
| 2014 | 8,030 | 27,451 | 35,481 |
| 2015 | 7,571 | 29,393 | 36,964 |
Granted patent applications
In 2015, CIPO granted 22,201 patent applications, an increase of 48% since 2006, but a decrease of 7% since 2014; 13% of these grants are to residents. The share of patents granted to residents has grown since 2006.Footnote 24 Results are shown in figure 7. It is important to note that the total number of patent grants depends on the number of patent examiners employed by CIPO. This means that the annual number of grants is not an indicator of innovative activity. Rather it is an indicator of CIPO's productivity and efficiency. In recent years, CIPO built capacity to help reduce our inventory.Footnote 25
| Year | Resident | Non-resident | Total |
|---|---|---|---|
| 2006 | 1,588 | 13,384 | 14,972 |
| 2007 | 1,809 | 16,741 | 18,550 |
| 2008 | 1,886 | 16,817 | 18,703 |
| 2009 | 2,029 | 17,468 | 19,497 |
| 2010 | 1,906 | 17,214 | 19,120 |
| 2011 | 2,150 | 18,612 | 20,762 |
| 2012 | 2,404 | 19,415 | 21,819 |
| 2013 | 2,756 | 21,077 | 23,833 |
| 2014 | 2,984 | 20,765 | 23,749 |
| 2015 | 2,858 | 19,343 | 22,201 |
Conclusion
While not definitive on its own, patenting is an important indicator of innovation and a key factor in the knowledge economy. Canadian patent activity continues to be relatively stable, declining slightly in the last decade. The decline in patenting is perhaps a symptom of the stagnation in Canada's manufacturing sector. Meanwhile, patent grants have increased some 48% since 2006, as CIPO's efficiency continues to improve. The vast majority (80%) of patents are now filed through the PCT, exemplifying Canada's close integration into the global economy. Because of this integration, the resident share of patenting activity is lower than that of most other leading economies, at 12% in 2015. CIPO's research group is engaged in ongoing research to forecast future patent applications, using predictions about GDP and other factors. Results are expected in the fall of 2017.
Trademarks
A trademark is a mark that is used by a person for the purpose of distinguishing goods or services by him or her from those of others. A more complete definition, as well as information on fees and trademark duration, can be found in the appendix. CIPO received a total of 52,461 trademark applications in 2015, of which 22,589 were from Canadian residents (43% share) and 29,872 were from non-residents. CIPO registered 31,507 trademarks in 2015, of which 13,224 were from Canadian residents (42% share) and 18,283 were from non-residents.
Historically, the interaction between trademark applications and GDP has been pro-cyclical, that is, they have moved in the same direction. For Canada, such a trend can be observed, with trademark applications declining sharply during the 2008-2009 recession.Footnote 26
Non-resident filings are, on the other hand, associated with foreign firms wanting to sell their products in Canada. Figure 8 shows the co-movement between non-resident filings and imports to Canada. The figure suggests that filings are sometimes associated with events that do not necessarily affect imports in the same way. For example, the temporary distancing between filings and imports around the year 2000 could be related to the high-tech bubble. Further research could shed light into the behaviour of these trends, analyzing which industries or sectors are more strongly associated with trademark filings.
| Year | Trademark applications filed | Imports |
|---|---|---|
| 1995 | 100 | 100 |
| 1996 | 132 | 105 |
| 1997 | 121 | 121 |
| 1998 | 147 | 127 |
| 1999 | 169 | 137 |
| 2000 | 206 | 149 |
| 2001 | 186 | 142 |
| 2002 | 168 | 144 |
| 2003 | 176 | 150 |
| 2004 | 189 | 163 |
| 2005 | 196 | 175 |
| 2006 | 214 | 184 |
| 2007 | 227 | 195 |
| 2008 | 218 | 196 |
| 2009 | 190 | 172 |
| 2010 | 211 | 196 |
| 2011 | 231 | 207 |
| 2012 | 242 | 214 |
| 2013 | 242 | 217 |
| 2014 | 253 | 221 |
| 2015 | 255 | 221 |
Trademark applications
In 2015, Canadian residents filed 43% of applications to CIPO, a rate that has been fairly stable during the last decade, as shown in figure 9. Residents filed 6% more than in 2014, and non-residents filed 1% more. Top filers of non-resident trademark applications in 2015 were the U.S., Germany, the U.K., France, and China, together accounting for 74% of non-resident applications and 42% of all applications.Footnote 28
| Year | Resident | Non-resident | Total |
|---|---|---|---|
| 2006 | 19,949 | 25,082 | 45,031 |
| 2007 | 21,101 | 26,657 | 47,758 |
| 2008 | 20,040 | 25,579 | 45,619 |
| 2009 | 18,663 | 22,293 | 40,956 |
| 2010 | 20,449 | 24,771 | 45,220 |
| 2011 | 21,337 | 27,135 | 48,472 |
| 2012 | 21,741 | 28,369 | 50,110 |
| 2013 | 21,449 | 28,370 | 49,819 |
| 2014 | 21,348 | 29,680 | 51,028 |
| 2015 | 22,589 | 29,872 | 52,461 |
Trademark registrations
Trademark registrations continue to see significant year-over-year fluctuations, recovering to 31,507 after a decrease in 2014, as shown in figure 10. The time for processing trademark applications is roughly two years, so trends in registrations can lag behind trends in applications. Over the last decade, registrations have grown more than twice as fast as trademark applications (38% versus 16%), as CIPO has efficiently reduced its inventory of unprocessed applications.
| Year | Resident | Non-resident | Total |
|---|---|---|---|
| 2006 | 10,599 | 12,279 | 22,878 |
| 2007 | 11,583 | 13,515 | 25,098 |
| 2008 | 12,798 | 14,945 | 27,743 |
| 2009 | 10,555 | 14,124 | 24,679 |
| 2010 | 14,035 | 15,955 | 29,990 |
| 2011 | 12,455 | 16,095 | 28,550 |
| 2012 | 10,492 | 13,857 | 24,349 |
| 2013 | 12,466 | 16,489 | 28,955 |
| 2014 | 10,418 | 14,645 | 25,063 |
| 2015 | 13,224 | 18,283 | 31,507 |
Conclusion
Trademarks are vital tools for Canadian businesses, and for any firm operating in Canada. Filings for trademarks by residents have grown by 13% since 2006, and filings by non-residents have grown by 19% over the same time period. Trademark registrations have also grown over that time period, expanding by 38% since 2006. This reflects both the growth in application volume and the effectiveness of CIPO's trademark examiners. Trademark activity by non-residents is correlated with import activity, as foreign firms seek to protect the brands under which they sell their products. Canada's trademark application profile is relatively international, with 57% of the applications for trademarks in 2015 coming from abroad. As Canada prepares to join the Madrid Protocol, we expect international applications to grow over the next 5 years. CIPO's research team continues to make strides in forecasting trademarks, as Canada moves towards implementing the Madrid Protocol. Results are expected in early 2017.
Industrial designs
Industrial designs are the visual features of shape, configuration, pattern or ornament, or any combination of these features, applied to a finished article. By registering an industrial design with CIPO, individuals and businesses can protect their designs.Footnote 29 Industrial designs protect aspects of a finished work which other forms of IP rights may not, and are important in the protection of product reputations, visual brand identification, and facilitating creativity in design. The use of industrial designs by firms has been found to be positively correlated with firm productivity, as measured by revenue per employeeFootnote 30, with the effect being particularly pronounced for small and medium-sized enterprises.Footnote 31 Global use of industrial designs has nearly doubled since 2004.
| Year | Applications filed |
|---|---|
| 2004 | 587,900 |
| 2005 | 644,600 |
| 2006 | 686,700 |
| 2007 | 774,200 |
| 2008 | 810,900 |
| 2009 | 823,000 |
| 2010 | 917,000 |
| 2011 | 1,039,500 |
| 2012 | 1,207,600 |
| 2013 | 1,238,300 |
| 2014 | 1,138,400 |
In 2015, CIPO received a total of 5,846 industrial design applications, of which 797 were from Canadian residents (14%) and 5,049 were from non-residents. CIPO registered 5,728 industrial designs in 2015, of which 785 were from Canadian residents (14%) and 4,943 were from non-residents.
Like other IP rights, ID applications are associated with economic variables. The desire for ID protection reflects an expectation of the profitability of sales of that product. Figure 12 shows the co-movement between ID non-resident applications and imports.
| Year | Industrial design applications filed | Imports of goods |
|---|---|---|
| 1995 | 100 | 100 |
| 1996 | 104 | 105 |
| 1997 | 124 | 123 |
| 1998 | 104 | 131 |
| 1999 | 107 | 142 |
| 2000 | 139 | 154 |
| 2001 | 107 | 146 |
| 2002 | 137 | 149 |
| 2003 | 153 | 154 |
| 2004 | 181 | 167 |
| 2005 | 213 | 180 |
| 2006 | 218 | 189 |
| 2007 | 234 | 200 |
| 2008 | 240 | 200 |
| 2009 | 178 | 171 |
| 2010 | 223 | 195 |
| 2011 | 231 | 207 |
| 2012 | 235 | 214 |
| 2013 | 234 | 218 |
| 2014 | 255 | 223 |
| 2015 | 262 | 223 |
Industrial design applications
In 2015, CIPO received 5,846 ID applications, growing 1% from 2014. As with patents, a relatively small share of applications is from Canadians, with 86% coming from non-residents. ID applications grew by 21% from 2006 to 2015. The majority (56%) of ID applications originate in the United States. The ten-year trend is shown in figure 13.
| Year | Resident | Non-resident | Total |
|---|---|---|---|
| 2006 | 640 | 4,195 | 4,835 |
| 2007 | 569 | 4,500 | 5,069 |
| 2008 | 664 | 4,618 | 5,282 |
| 2009 | 839 | 3,430 | 4,269 |
| 2010 | 851 | 4,291 | 5,142 |
| 2011 | 790 | 4,437 | 5,227 |
| 2012 | 847 | 4,515 | 5,362 |
| 2013 | 846 | 4,500 | 5,346 |
| 2014 | 859 | 4,908 | 5,767 |
| 2015 | 797 | 5,049 | 5,846 |
Industrial design registrations
ID registrations grew by 66% between 2006 and 2015. The annual totals frequently fluctuate, as shown in figure 14.Footnote 32 CIPO's commitment to reducing its inventory has caused ID registrations to grow much more quickly than ID applications (66% versus 21%).
| Year | Resident | Non-resident | Total |
|---|---|---|---|
| 2006 | 411 | 3,043 | 3,454 |
| 2007 | 606 | 4,981 | 5,587 |
| 2008 | 613 | 5,303 | 5,916 |
| 2009 | 654 | 4,420 | 5,074 |
| 2010 | 845 | 4,330 | 5,175 |
| 2011 | 720 | 4,010 | 4,730 |
| 2012 | 582 | 3,593 | 4,175 |
| 2013 | 577 | 3,208 | 3,785 |
| 2014 | 928 | 5,315 | 6,243 |
| 2015 | 785 | 4,943 | 5,728 |
Conclusion
Industrial designs are an increasingly important type of IP right for firms to consider. ID applications in Canada have grown by 21% since 2006, with registrations growing by 66% over the last ten years. ID applications by non-residents, like those of trademarks, are correlated with import activity. Canada is making preparations to join the Hague Agreement, which provides a framework for streamlined international ID applications similar to the PCT for patents. Once accession to the Hague Agreement is complete, CIPO expects non-resident applications of IDs to grow more quickly. The resident share of ID applications was 14% in 2015, and that number may decrease in the future if non-resident applications grow quickly. CIPO is conducting research into the value of industrial designs for Canadian firms, looking at the impact on metrics such as revenue per employee and asset turnover. Results are expected in the spring of 2017.
IP by Canadians
Global IP activity by Canadians
Canada exports products all over the world. Canadian businesses must invest in IP rights in other countries in order to protect their inventions, brands, and product designs. CIPO works with Canadian businesses to help them promote their products and protect their IP rights around the world. The growth in Canadian IP activity abroad has outpaced domestic filings by Canadians.
The World Intellectual Property Organization tracks global IP activity with data submitted by member countries' national offices. From 2005 to 2014, overall global IP rights applications by Canadians grew by 35%. In 2014, 56% of those applications were for patents, 40% were for trademarks, and 4% were for industrial designs.Footnote 33 Global applications are summarized in figure 15.

Description for Figure 15 – IP rights applications by Canadians abroad, 2005-2014
Figure 15 shows a line chart indicating the growth in applications abroad made by Canadians for patents, trademarks, and industrial designs. The years covered are 2005 to 2014. Patents are represented with a red line, trademarks with an orange line, and industrial designs with a blue line.
| Year | Patents | Trademarks | ID | Total applications |
|---|---|---|---|---|
| 2005 | 14,744 | 10,451 | 965 | 26,160 |
| 2006 | 16,400 | 10,846 | 850 | 28,096 |
| 2007 | 17,650 | 12,207 | 1,110 | 30,967 |
| 2008 | 17,026 | 11,832 | 1,206 | 30,064 |
| 2009 | 16,826 | 9,899 | 1,554 | 28,279 |
| 2010 | 19,394 | 11,690 | 1,493 | 32,577 |
| 2011 | 19,960 | 13,049 | 1,409 | 34,418 |
| 2012 | 21,543 | 12,728 | 1,626 | 35,897 |
| 2013 | 21,019 | 13,468 | 1,632 | 36,119 |
| 2014 | 19,826 | 14,150 | 1,548 | 35,524 |
Figure 16, indicates that global applications for IP rights by Canadians have outpaced Canadian GDP growth since 1995.Footnote 34 Indeed, between 1995 and 2014, international applications grew more than twice as quickly as real GDP (123% versus 61%). They also outpaced exports, which grew by 66% over this period.
| Year | IP | Exports | GDP |
|---|---|---|---|
| 1995 | 100 | 100 | 100 |
| 1996 | 101 | 106 | 102 |
| 1997 | 107 | 115 | 106 |
| 1998 | 119 | 126 | 110 |
| 1999 | 118 | 139 | 116 |
| 2000 | 137 | 152 | 122 |
| 2001 | 125 | 147 | 124 |
| 2002 | 117 | 149 | 128 |
| 2003 | 122 | 147 | 130 |
| 2004 | 148 | 155 | 134 |
| 2005 | 162 | 158 | 138 |
| 2006 | 175 | 160 | 142 |
| 2007 | 191 | 161 | 145 |
| 2008 | 185 | 154 | 146 |
| 2009 | 173 | 134 | 142 |
| 2010 | 200 | 143 | 146 |
| 2011 | 212 | 150 | 151 |
| 2012 | 220 | 154 | 154 |
| 2013 | 222 | 158 | 157 |
| 2014 | 219 | 166 | 161 |
Patents
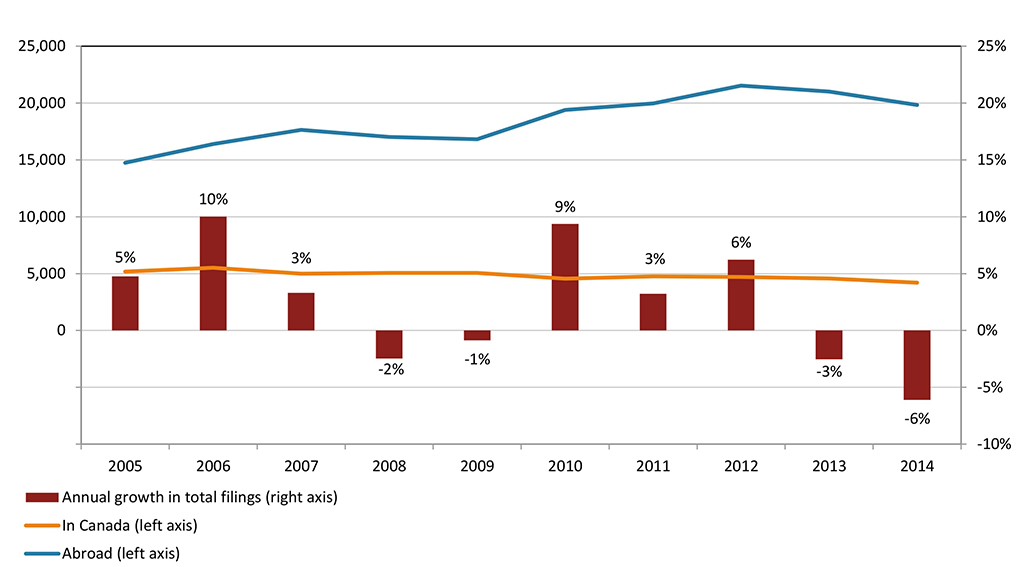
As shown in figure 17, Canadians file more patents abroad than domestically: 19,826 versus 4,198 in 2014.Footnote 35 The growth rate of filings abroad appears to be sensitive to economic conditions, as we see declines in 2008/2009 concurrent with the global financial crisis, and in 2014 as the price of oil declined.
Description for Figure 17 - Patent applications filed in Canada and abroad by Canadians, 2005-2014
Figure 17 shows a line and bar chart indicating the growth in patent applications filed in Canada and abroad by Canadians. The years covered are 2005 to 2014. Applications in Canada are represented with an orange line, and applications abroad are represented with a blue line. The annual growth in total filings is represented with red bars.
| Year | In Canada | Abroad | Annual growth in total filings |
|---|---|---|---|
| 2005 | 5,183 | 14,744 | 5% |
| 2006 | 5,522 | 16,400 | 10% |
| 2007 | 4,998 | 17,650 | 3% |
| 2008 | 5,061 | 17,026 | -2% |
| 2009 | 5,067 | 16,826 | -1% |
| 2010 | 4,550 | 19,394 | 9% |
| 2011 | 4,754 | 19,960 | 3% |
| 2012 | 4,709 | 21,543 | 6% |
| 2013 | 4,567 | 21,019 | -3% |
| 2014 | 4,198 | 19,826 | -6% |
Many Canadian businesses have the United States as their primary market and therefore direct patent filings are more common. As figure 18 shows, the proportion of patent filings in Canada from the U.S. that use the PCT, is much higher than that of PCT filings from Canada to the U.S. However, the use of the PCT by Canadians filing in the U.S. has experienced a sustained increase, from 7% in 2005 to 19% in 2014. Canadian businesses are increasing their international presence, and are using the PCT mechanism more frequently. Since 2005, Canadians have nearly tripled their use of the PCT to file in the U.S., although 81% of patents filed by Canadians in the U.S. are still done directly. Americans filing in Canada now use the PCT four times as often as Canadians filing in the U.S., an improvement from a 10-to-1 ratio in 2005.
| Year | Patent applications filed in Canada from the U.S. (% PCT over total) | Patent applications filed in the U.S. from Canada (% PCT over total) |
|---|---|---|
| 2005 | 75% | 7% |
| 2006 | 77% | 7% |
| 2007 | 78% | 9% |
| 2008 | 79% | 10% |
| 2009 | 78% | 13% |
| 2010 | 81% | 13% |
| 2011 | 79% | 14% |
| 2012 | 78% | 15% |
| 2013 | 78% | 16% |
| 2014 | 78% | 19% |
Figure 19 shows that in 2014, 37% of Canadian applications abroad were filed through the PCT, and the remaining 63% were filed directly to national offices. Growth rates were 56% for PCT applications and 24% for direct applications since 2005.Footnote 36
| Year | Direct abroad | PCT abroad | Total |
|---|---|---|---|
| 2005 | 10,033 | 4,711 | 14,744 |
| 2006 | 11,306 | 5,094 | 16,400 |
| 2007 | 11,956 | 5,694 | 17,650 |
| 2008 | 11,551 | 5,475 | 17,026 |
| 2009 | 11,094 | 5,732 | 16,826 |
| 2010 | 12,880 | 6,514 | 19,394 |
| 2011 | 12,903 | 7,057 | 19,960 |
| 2012 | 14,255 | 7,288 | 21,543 |
| 2013 | 13,706 | 7,313 | 21,019 |
| 2014 | 12,461 | 7,365 | 19,826 |
The top three filing destinations for patents in 2014 were the U.S., the European Patent Office (EPO), and China, receiving 79% of Canadian applications between them, as shown in figure 20. In particular, the U.S. received 65% of all patent applications filed by Canadians abroad; the total of 12,963 represents 50% growth since 2005.
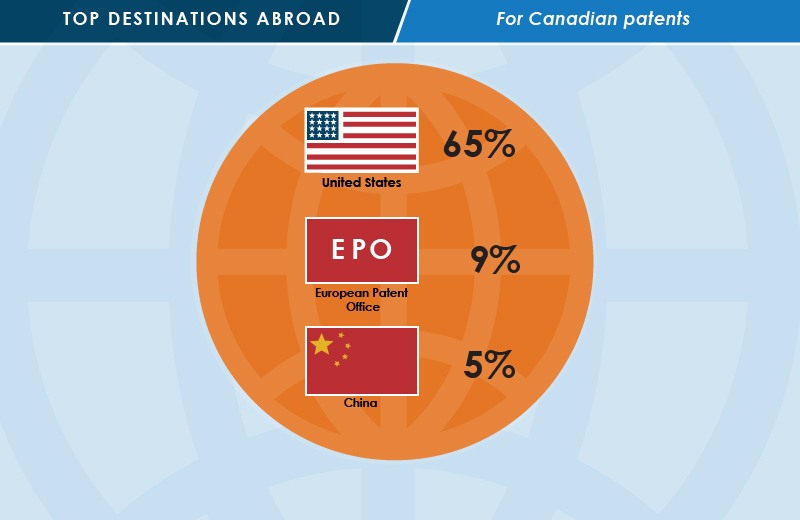
Description for Figure 20 - Percentage of Canadian patent applications for top filing destinations
| Top 3 destinations | 2014 | 2005-2014 | % of all destinations | 2005 (%PCT/total) | 2014 (%PCT/total) |
|---|---|---|---|---|---|
| United States of America | 12,963 | 50% | 65% | 7% | 19% |
| European Patent Office | 1,730 | -3% | 9% | 62% | 72% |
| China | 1,009 | 52% | 5% | 73% | 74% |
Conclusion
Canadian businesses patent internationally more than ever before, filing nearly five times as many patents abroad as they did domestically in 2014. The United States, owing to its status as Canada's major trading partner, is the main destination for Canadian patent filers. It received 12,963 patent applications in 2014, which is 65% of the total, and more than triple the number of patents filed by Canadians in Canada.
Growth in patent applications abroad has been rapid, with 34% more patents filed abroad in 2014 than in 2005. More than half of that growth has come from the use of the PCT by Canadian filers. PCT applications now make up 37% of Canadian applications abroad, an all-time high. This change shows that Canadians continue to diversify their export markets by filing in multiple jurisdictions. Joint work between CIPO and the Organisation for Economic Co-operation and Development (OECD) is underway to better understand the key factors in Canadian businesses' strategic decisions regarding international IP filings. Results of this collaboration are expected at the end 2017.
Trademarks
Between 2005 and 2014, Canadian trademark applications abroad increased 34%, from 10,451 to 13,990. This growth reflects greater demand for trademarks, as brand reputation grows in importance.Footnote 37 In 2008 and 2009, we see the effect of the global financial crisis, as the number of trademark applications filed internationally by Canadians dropped sharply.
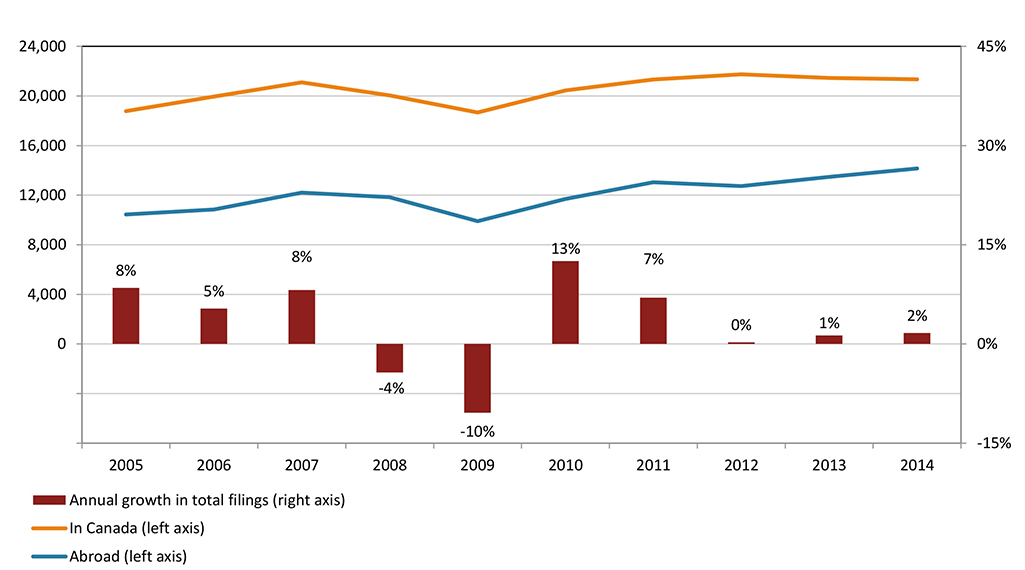
Description for Figure 21 - Trademark applications filed in Canada and abroad by Canadians, 2005-2014
Figure 21 shows a line and bar chart indicating the growth in trademark applications filed in Canada and abroad by Canadians. The years covered are 2005 to 2014. Applications in Canada are represented with an orange line, and applications abroad are represented with a blue line. The annual growth in total filings is represented with red bars.
| Year | Trademark applicatons filed in Canada | Trademark applicatons filed abroad | Annual growth in total filings |
|---|---|---|---|
| 2005 | 18,777 | 10,451 | 8% |
| 2006 | 19,949 | 10,846 | 5% |
| 2007 | 21,101 | 12,207 | 8% |
| 2008 | 20,040 | 11,832 | -4% |
| 2009 | 18,663 | 9,899 | -10% |
| 2010 | 20,449 | 11,690 | 13% |
| 2011 | 21,337 | 13,049 | 7% |
| 2012 | 21,741 | 12,728 | 0% |
| 2013 | 21,449 | 13,468 | 1% |
| 2014 | 21,348 | 14,150 | 2% |
As observed below in figure 22, top filing destinations for trademarks in 2014 were the U.S., China, and the European Union Intellectual Property Office (EUIPO), receiving 70% of Canadian applications between them. The U.S. alone received 50% of all Canadian international trademark filings.Footnote 38 Growth rates for these three countries between 2005 and 2014 were 18%, 138%, and 35% respectively. The increase in Canadian firms applying for trademarks in China accounted for 30% of the increase in annual trademark applications made by Canadians abroad.
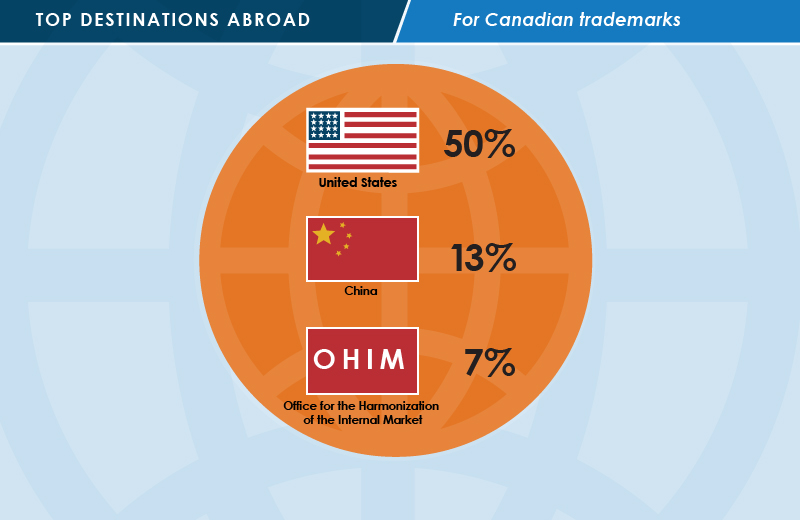
Description for Figure 22 - Percentage of Canadian trademark applications for top filing destinations
| Top 3 destinations | 2014 | 2005-2014 | % of all destinations |
|---|---|---|---|
| United States of America | 6,980 | 18% | 50% |
| China | 1,866 | 138% | 13% |
| EUIPO | 990 | 35% | 7% |
Conclusion
Trademark applications are another key factor in the growing use of IP rights by Canadian firms internationally. Trademark applications have outpaced export growth since 2005. The U.S. continues to account for roughly half of all trademark applications made by Canadians abroad. Another noteworthy trend since 2005 is the dramatic increase (138%) in applications made to China.
Canada's forthcoming move to join the Madrid Protocol will likely lead to a substantial increase in the use of trademarks by Canadian firms operating internationally, as the cost of foreign applications will decline. As well, we may see some relative movement away from direct applications into the United States. As noted previously, CIPO is developing forecasting models to support the implementation of the Madrid Protocol.
Industrial designs
Figure 23 shows that between 2005 and 2014, Canadian ID applications abroad increased by 60%, from 965 to 1,548. Like the number of domestic ID applications, the number of ID applications abroad is highly variable from year to year, due to the relatively small volume of applications. The growing importance of ID and the surge in ID applications to China specifically, help explain the rapid pace of ID growth. The comparatively low volume of ID applications makes it difficult to compare it to changes in economic activity.
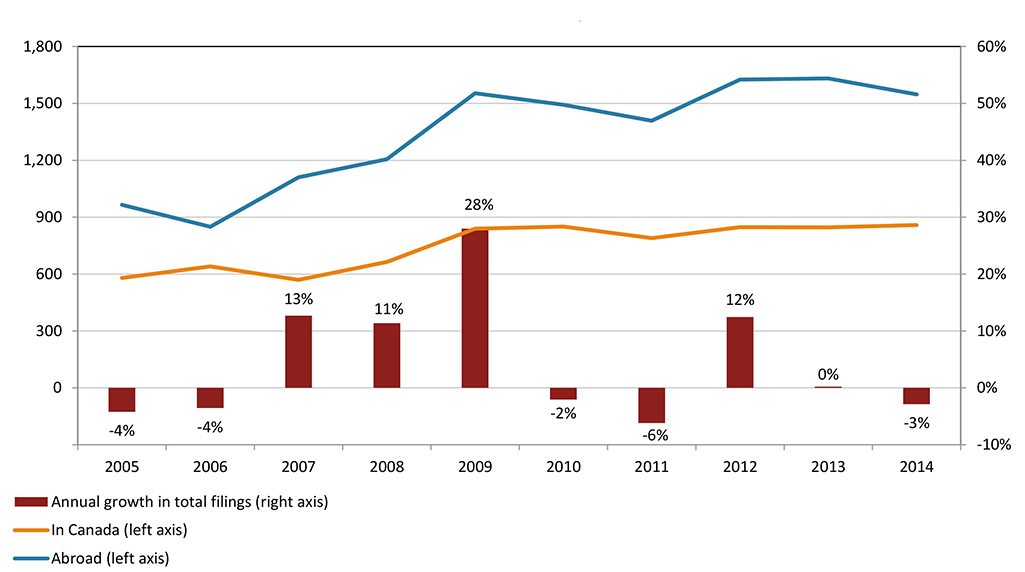
Description for Figure 23 - Industrial design applications filed abroad by Canadians, 2005-2014
Figure 23 shows a line and bar chart indicating the growth in industrial design applications filed in Canada and abroad by Canadians. The years covered are 2005 to 2014. Applications in Canada are represented with an orange line, and applications abroad are represented with a blue line. The annual growth in total filings is represented with red bars.
| Year | ID applications filed in Canada | ID applications filed abroad | Annual growth in total filings |
|---|---|---|---|
| 2005 | 580 | 965 | -4% |
| 2006 | 640 | 850 | -4% |
| 2007 | 569 | 1110 | 13% |
| 2008 | 664 | 1206 | 11% |
| 2009 | 839 | 1554 | 28% |
| 2010 | 851 | 1493 | -2% |
| 2011 | 790 | 1409 | -6% |
| 2012 | 847 | 1626 | 12% |
| 2013 | 846 | 1632 | 0% |
| 2014 | 859 | 1548 | -3% |
Top filing destinations for ID in 2014 were the U.S., EUIPO, and China, receiving 79% of Canadian applications between them. The U.S. received 61% of all ID filings by Canadians abroad. Figure 24 summarizes these findings. Growth rates for these three countries between 2005 and 2014 were 41%, 93%, and 205% respectively.

Description for Figure 24 - Percentage of Canadian industrial design applications for top filing destinations
| Top 3 destinations | 2014 | 2005-2014 | % of all destinations |
|---|---|---|---|
| United States of America | 951 | 41% | 61% |
| EUIPO | 154 | 93% | 10% |
| China | 113 | 205% | 7% |
Conclusion
Canadian firms have grown their use of industrial designs at a quicker pace than any other IP right, reflecting the increasing importance of design in global markets. Canadian firms focused their use of IDs in three key jurisdictions: the U.S., EUIPO, and China. In particular, Canadian firms have grown their use of ID rights in China more than threefold since 2005. ID growth has dramatically outpaced exports and real GDP. In the next few years, Canadian firms are projected to take advantage of the streamlined filing processes available under the Hague Treaty, and CIPO predicts that Canadian use of ID abroad will continue to grow.
Turnaround
Time in and out of office
Understanding the turnaround time necessary to approve an IP right is important. If the process is overly lengthy, it can become a barrier to innovation and potentially harm the effective commercialization of new ideas. However, because IP rights provide a temporary monopoly over a given idea, due diligence is vital to protect the economic interest of Canadians. The IP approval process involves significant interaction between CIPO and the applicant, as explained in greater detail below. The more complex the IP right, the greater the degree of interaction, and the longer the period of time necessary for approval.
Time to patent approval
Patents are the most complex form of IP, and have been growing in complexity along with the underlying technologies. There are three stages involved in the patent application process: from filing to exam request, from exam request to first action, and from first action to the patent being granted. The initial stage, between filing an application and requesting an examination, is the longest, but is determined by the filer rather than by CIPO.Footnote 39 The second stage, from exam request to first action, is determined by CIPO, and has been reduced by 6.9 months in the last three years and by over half since 2008. The third stage involves interaction between the office and the filer, and thus is determined by both the applicant and CIPO.
In 2015, the lengths of the three stages were: 41.4, 13.3, and 24.5 months respectively. CIPO has substantially reduced the time from the examination request to the patent grant, with average turnaround times declining from 44.7 months in 2012 to 37.8 months in 2015.
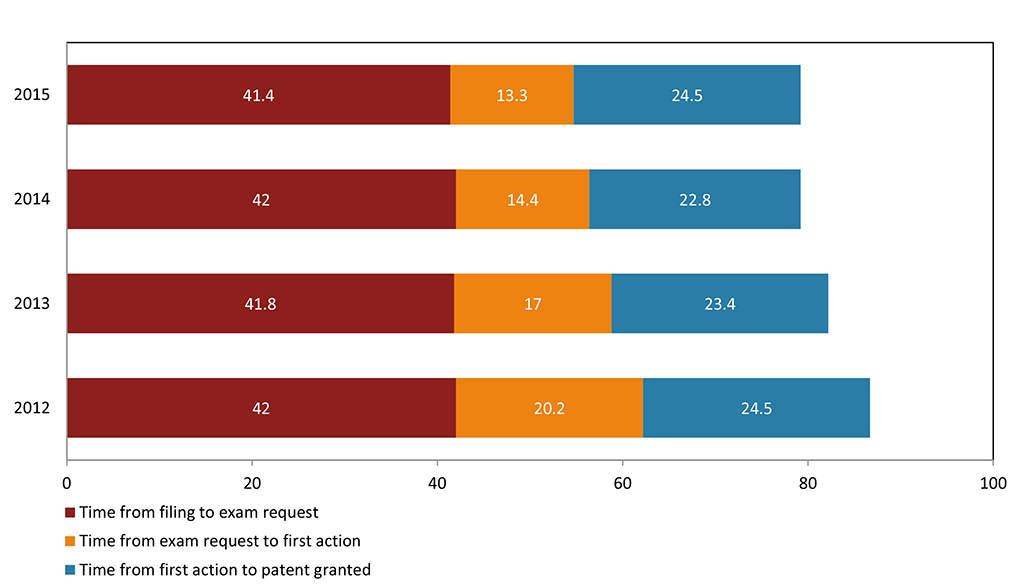
Description for Figure 25 - Average time period in months for the three main stages of the patent process
| Stages | 2012 | 2013 | 2014 | 2015 |
|---|---|---|---|---|
| From filing to exam request | 42 | 41.8 | 42 | 41.4 |
| From exam request to first action | 20.2 | 17 | 14.4 | 13.3 |
| From first action to patent granted | 24.5 | 23.4 | 22.8 | 24.5 |
| Total | 86.6 | 82.2 | 79.2 | 79.1 |
Time to trademark registration
Trademarks are less complex than patents, but still involve a great deal of due diligence by the Trademarks Branch for the registration process to be both fair and efficient. The trademark process has three stages: filing to first action, first action to allowed, and allowed to registration. The first stage is largely in the control of CIPO. The time in this stage declined in 2015 to an average of 6.5 months. The second stage contains exchanges between the office and the filer, and thus the average time in the second stage is determined by both the applicant and CIPO. The time in the second stage also declined in 2015, to an average of 13.0 months. The final stage is in the control of the client, and has declined to 7.3 months. All in all, average turnaround times for trademarks were over three months lower than in 2014.
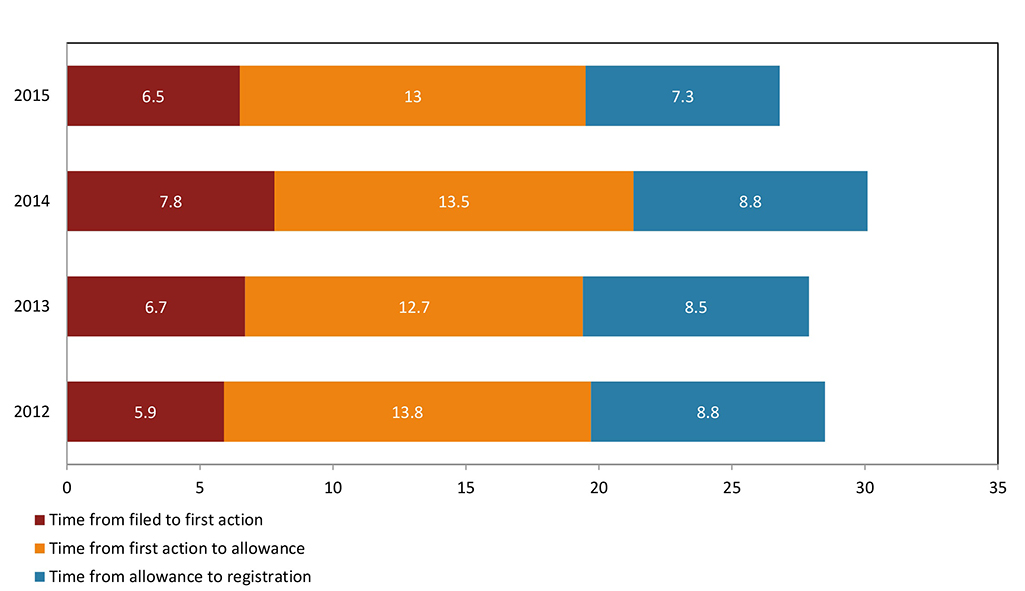
Description for Figure 26 - Average time period in months for the three main stages of the trademark process
| Stages | 2012 | 2013 | 2014 | 2015 |
|---|---|---|---|---|
| Filed to first action | 5.9 | 6.7 | 7.8 | 6.5 |
| First action to allowed | 13.8 | 12.7 | 13.5 | 13 |
| Allowed to registration | 8.8 | 8.5 | 8.8 | 7.3 |
| Total | 28.5 | 27.9 | 30 | 26.8 |
Time to industrial design registration
Industrial designs offer the fastest time to registration of the three types of IP rights considered here. This stems from the relative ease of verifying the originality of each design. The industrial design process has three main stages: from filing to conformed, from conformed to first actionFootnote 40, and from first action to allowed and registered. The first stage requires that the application meet all of the filing date requirements, which typically takes less than half a month. The second stage is in the control of CIPO and is essentially the waiting time within the office. The average time for first action declined in 2015 to just 4.8 months. The third stage is characterized by the examination and the search process to determine originality, and may involve interaction between the filer and CIPO under some circumstances. As such, this stage is not entirely under the control of CIPO. The third stage took an average of 3.4 months in 2015, for a total average turnaround time of just 8.6 months, lower than any of the last three years.
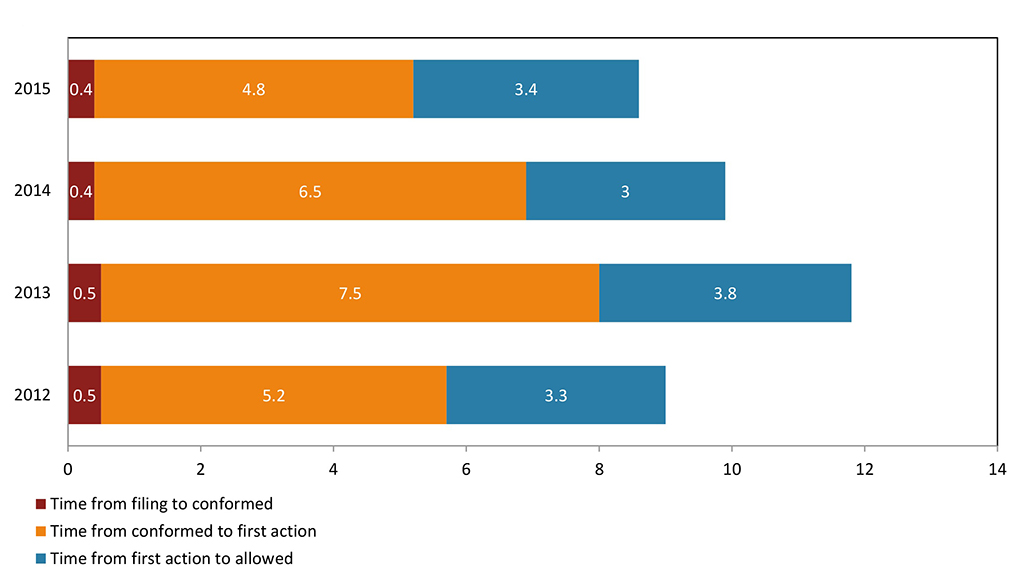
Description for Figure 27 - Average time period in months for the three main stages of the industrial design process
| Stages | 2012 | 2013 | 2014 | 2015 |
|---|---|---|---|---|
| From filing to conformedFootnote 41 | 0.5 | 0.5 | 0.4 | 0.4 |
| From conformed to first action | 5.2 | 7.5 | 6.5 | 4.8 |
| From first action to allowed | 3.3 | 3.8 | 3 | 3.4 |
| Total | 9 | 11.8 | 9.9 | 8.6 |
Conclusion
Since 2012 the time to obtain an IP right in Canada has declined. The most significant decline has been in obtaining a patent, the lengthiest and most complicated process of the three rights. Better understanding the time an application for an IP right is with clients and when it is with CIPO will provide the chance to identify opportunities where policy or operational changes can impact the time it takes to obtain an IP right in Canada.
Spotlight
Spotlight: Patenting in climate change mitigation technologies
The Government of Canada has made a number of commitments to addressing climate change. To support this effort, CIPO has undertaken a patent study in the area of Climate change mitigation technologies (CCMT) that will provide invaluable intelligence on the top Canadian companies, researchers, and inventors in the area of climate change mitigation. Climate change mitigation is an important part of the clean-tech industry, which employs over 55,000 people in 800 firms across Canada and generated $11.6 billion in revenue in 2014.Footnote 42 The study will demonstrate where Canada may have relative advantages in sub-categories of climate change mitigation technologies. This section provides a first look at some of the data collected to date.
The patent landscape map below provides a visual representation of the climate change mitigation technology patents applied for by Canadians anywhere in the world. The map is generated by an algorithm that uses keywords from patent documentation to cluster patents based on shared language. Patents are represented on the map by dots, with patents located closer together sharing more commonality than those further apart. The patents are organized in common themes and grouped as ‘contours' on a map to show areas of high and low patenting activity. The ‘snow-capped peaks' represent the highest concentration of patents and each peak is labelled with key terms that tie the common themes together. Figure 28 shows that Canadian innovators are very active in the areas of renewable energy, smart grids and clean energy enablers.
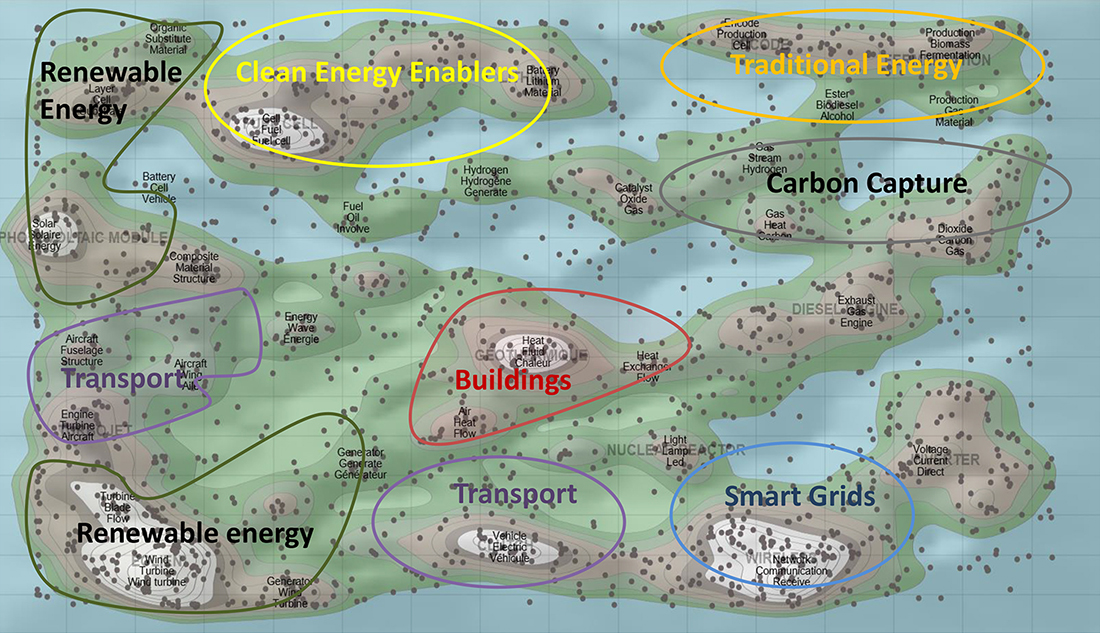
Description for Figure 28 - Patenting in CCMT by Canadians
Figure 28 provides a visual representation of the climate change mitigation technology patents applied for by Canadians anywhere in the world, between 2008 and 2012. Thomson Innovation's ThemeScape mapping tool was utilized to produce this visualization, using term frequency (keywords from a patents title and abstract) and other algorithms to cluster documents based on shared language. The result is a patent landscape map, a map very much resembling that of a topographic map, where there are sections of land and water. Land sections are comprised of hills, some of which have ‘snow-capped peaks,' representing the highest concentration of patents and are labelled with key terms that tie common themes together. Water is used to separate terms where there is no commonality between them. Highlighted, on this map, are seven climate change mitigation sub-technologies. These include: Renewable Energy, Transport, Clean Energy Enablers, Buildings, Traditional Energy, Carbon Capture and Smart Grids. Renewable Energy, outlined in green, is found in two areas on the map. First, it is found in the upper-left hand quadrant of the map and is associated with keywords such as, “Organic”, “Substitute”, “Material”, “Layer”, “Cell”, “Substrate”, “Solar”, “Solar” and “Energy.” Second, it is found in the lower-left hand quadrant of the map and is associated with keywords such as, “Turbine”, “Blade”, “Flow”, “Wind”, “Generator”, “Generate” and “Generator.” Transport, outlined in purple, is also found in two areas on the map. First, it is found in the middle-left hand quadrant of the map and is associated with keywords such as, “Aircraft”, “Fuselage”, “Structure”, “Wing”, “Wing”, “Engine” and “Turbine.” Second, it is found in the bottom-middle quadrant of the map and is associated with keywords such as, “Vehicle”, “Electric” and “Vehicle.” Clean Energy Enablers, circled in yellow, is found in the upper-middle quadrant of the map and is associated with keywords such as, “Cell”, “Fuel”, “Fuel Cell”, “Battery”, “Lithium” and “Material.” Buildings, outlined in red, is found in the middle quadrant of the map and is associated with keywords such as, “Air”, “Heat”, “Flow”, “Fluid”, “Heat” and “Exchanger.” Traditional Energy, circled in Orange, is found in the top-right quadrant of the map and is associated with keywords such as, “Encode”, “Production”, “Cell”, “Ester”, “Biodiesel”, “Alcohol”, “Biomass”, “Fermentation”, “Gas” and “Material.” Carbon Capture, circled in grey, is found in the mid-right hand quadrant of the map and is associated with keywords such as, “Gas”, “Stream”, “Hydrogen”, “Heat”, “Carbon” and “Dioxide.” Smart Grids, circled in light blue, is found in the bottom-right quadrant of the map and is associated with keywords such as, “Network”, “Communication” and “Receive.”
Broad themes written across the top of hills in very light grey include
- Fuel Cell
- Photo Voltaic Module
- Turbojet
- Wind
- Lithium
- Geothermal
- Clutch
- Nuclear Reactor
- Encode
- Wireless
- Diesel Engine
- Fermentation
- Inverter
The general key words found in this patent landscape map include
- Air
- Aircraft
- Alcohol
- Battery
- Biodiesel
- Biomass
- Blade
- Carbon
- Catalyst
- Cell
- Communication
- Composite
- Current
- Dioxide
- Direct
- Electric
- Encode
- Energy
- Engine
- Ester
- Exchanger
- Exhaust
- Fermentation
- Flow
- Fluid
- Fuel
- Fuel Cell
- Fuselage
- Gas
- Generate
- Generator
- Heat
- Hydrogen
- Involve
- Lamp
- Layer
- Led
- Light
- Lithium
- Material
- Network
- Oil
- Organic
- Oxide
- Production
- Receive
- Solar
- Stream
- Structure
- Substitute
- Substrate
- Turbine
- Vehicle
- Voltage
- Wave
- Wind
- Wind turbine
- Wing
The key words associated with each sub-technology include
Renewable Energy
- Blade
- Cell
- Energy
- Flow
- Generate
- Generator
- Layer
- Material
- Organic
- Solar
- Substitute
- Substrate
- Turbine
- Wind
- Wind turbine
Transport
- Aircraft
- Electric
- Engine
- Fuselage
- Structure
- Turbine
- Vehicle
- Wing
Clean Energy Enablers
- Battery
- Cell
- Fuel
- Fuel Cell
- Lithium
- Material
Buildings
- Air
- Exchanger
- Flow
- Fluid
- Heat
Traditional Energy
- Alcohol
- Biodiesel
- Biomass
- Cell
- Encode
- Ester
- Fermentation
- Gas
- Material
- Production
Carbon Capture
- Carbon
- Dioxide
- Gas
- Heat
- Hydrogen
- Stream
Smart Grids
- Communication
- Network
- Receive
While the above patent landscape shows Canadian activity across a number of CCMT technologies, figure 29 demonstrates that when compared to other top patenting countries in the area of CCMT, Canada is relatively specialized in carbon capture, buildings, smart grids and traditional energy. What this means is that in areas such as renewable energy, clean energy enablers and transport, many other countries have a high level of patenting activity as well. In order to adjust for the relative size of the countries the OECD developed the Revealed Technological Advantage (RTA) index. The RTA is the ratio of an economy's share in patents from a specific technology field to the economy's share in all patents from all technology fields. The index is equal to zero when the economy has no patents in a given field; it is equal to one when the economy's share in the sector equals its share in all fields (no specialisation); and above one when a positive specialisation is observed.
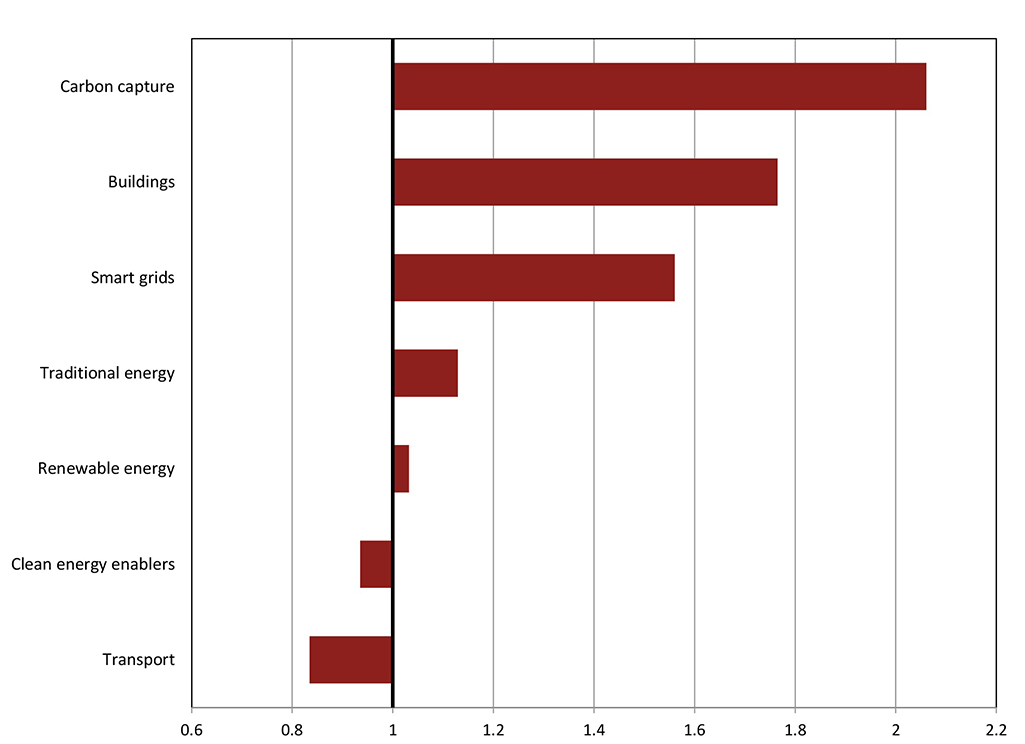
Description for Figure 29 - Canadian RTA index for CCMT sub-technologies (2008-2012)
| Sub-Technology | RTA Index |
|---|---|
| Transport | 0.834507696 |
| Clean energy enablers | 0.934975524 |
| Renewable energy | 1.03201079 |
| Traditional energy | 1.129502624 |
| Smart grids | 1.560651382 |
| Buildings | 1.76492286 |
| Carbon capture | 2.060801407 |
While this section provides only an early look at the data, we can start to see areas where Canadians may already be amongst world leaders in terms of innovation to mitigate climate change.
Conclusion
Conclusion
This report has outlined the major trends in IP use, both in Canada and by Canadians. By understanding these trends, we can illuminate the relationship between IP rights and the broader Canadian economy. Most major trends of the last decade continued in 2015, such as the growing use of the PCT by patent applicants and the post-recession recovery in trademark and industrial design applications. Canadian IP use abroad continues to grow quickly, surpassing growth in domestic filings by Canadians.
Canadian IP data demonstrates the economic relationship between Canada and the U.S. The U.S. is both the largest international filer for IP rights in Canada, and the recipient of the most applications by Canadians abroad. In 2014, the U.S. received the majority of Canadian international applications: 65% of patents, 50% of trademarks, and 61% of industrial designs. However, Canadians are also increasingly filing for IP rights in other jurisdictions, a strong signal of our efforts to go global with our innovation.
Going forward CIPO remains committed to our mission of effectively promoting, protecting and administering intellectual property rights. Although innovation is linked to many different factors, the efficient and effective protection of IP remains an important driver.Footnote 43 CIPO continues to facilitate Canadian IP activity with a strong and proactive focus on reducing turnaround times, with particular success in reducing the time from exam request to first action on patent applications.
Intellectual property rights are a vital part of the Canadian economic system. The trends discussed in this report, from growing global activity to CIPO's reduction in turnaround times, suggest that the Canadian IP system is working effectively to bring innovation and prosperity to Canadians.
Appendix
Appendix
CIPO administers Canada's system of IP protection, administering rights in the form of patents, trademarks, and industrial designs. Each type of IP protection is designed for different circumstances.
Patents
Patents provide a time-limited, legally protected, exclusive right to make, use and sell an invention. In this way, patents serve as a reward for ingenuity. Patents apply to newly developed technology, as well as to improvements on products or processes.
Patent protection applies in the country or region that issues the patent. In Canada, a patent lasts for 20 years from date that you file it. Patents can have a great deal of value. You can sell them, license them or use them as assets to attract funding from investors.Footnote 44
In exchange for these benefits, you must provide a full description of the invention when you file a patent. This helps enrich technical knowledge worldwide. Details of patent applications filed in Canada are disclosed to the public after an 18-month period of confidentiality.
To be eligible for patent protection, your invention must be: new (first in the world), useful (functional and operative), and inventive (showing ingenuity and not obvious to someone of average skill who works in the field of your invention). The invention can be: a product (e.g., door lock); a composition (e.g., chemical composition used in lubricants for door locks); a machine (e.g., for making door locks); a process (e.g., a method for making door locks); an improvement on any of these.
In Canada, the first applicant to file a patent application is entitled to obtain the patent. You should file as soon as possible after you complete an invention in case someone else is on a similar track.
Any public disclosure of an invention before filing may make it impossible to obtain a patent. There is an exception in Canada and the U.S. if the public disclosure was made by the inventor or by someone who learned of the invention from the inventor less than one year before filing the patent application. Please be aware that in some countries disclosing the invention to the public anywhere in the world before filing a patent application may, in many circumstances, prevent the inventor from obtaining a patent.Footnote 45
Standard fees are first, small entity fees are in parentheses:
- Patent application fee: $400 ($200)
- Examination fee: $800 ($400)
- Final fee: $300 ($150)
- Additional fees may apply
- Duration: 20 years
- Renewal: Annually
Trademarks
Trademarks can be one or many words, sounds or designs used to distinguish the goods or services of one person or organization from those of others. Over time, trademarks stand for not only the actual goods or service a person or company makes, but also the reputation of the producer. Trademarks are very valuable intellectual property.Footnote 46
There are three types of trademarks:
- An ordinary mark is made up of words, sounds, designs or a combination of these used to distinguish the goods or services of one person or organization from those of others. For example, suppose you started a courier business that you chose to call Giddy-up. You could register these words as a trademark (if you met all the legal requirements) for the service that you offer.
- A certification mark can be licensed to many people or companies for the purpose of showing that certain goods or services meet a defined standard. For example, the Woolmark design, owned by Woolmark Americas Ltd., is used on clothing and other goods.
- A distinguishing guise is about the shape of goods or their containers, or a way of wrapping or packaging goods that shows they have been made by a specific individual or firm. For example, if you manufactured butterfly-shaped candy you could register the butterfly shape as a distinguishing guise.
- Trademark application fee: $450 (online) or $500 (paper)
- Duration: 15 years, renewable for $350 (online) or $400 (paper)
Industrial Designs
Industrial designs are about how things look. More technically speaking, they are the visual features of shape, configuration, pattern or ornament, or any combination of these features, applied to a finished article. For example, the shape of a table or the shape and decoration of a spoon may be industrial designs.Footnote 47 If you want to register an industrial design, it has to be original. Registering your industrial design will provide you with an exclusive right to your design for up to 10 years after you register.
- Industrial design application fee: $400
- Duration: 10 years
- Renewal: After 5 years and 6 months