
View as PDF (PDF: 5.5 MB; 62 pages)
IP Canada Report 2020
For more information on the research included in this report, please contact CIPO-IPResearch@canada.ca.
Authors
- Elias Collette, Chief of Economic Research and Strategic Analysis, Canadian Intellectual Property Office
- Diego Santilli, Senior Economist, Canadian Intellectual Property Office
- Mohammad-Amin Nabavi, Junior Economist, Canadian Intellectual Property Office
- Gray Barski, Junior Economist, Canadian Intellectual Property Office
- Ricardo Domerçant, Junior Economist, Canadian Intellectual Property Office
On this page
- Message from the CEO
- About us
- Executive Summary
- Introduction
- Patents
- Trademarks
- Industrial Designs
- Plant Breeders' Rights
- Understanding the Impact of the COVID-19 Pandemic on IP Activity
- Patenting to Fight Pandemics: the Canadian Story
- Conclusion
- Appendix A
- Appendix B
Message from the CEO
It is a great privilege to present the IP Canada Report 2020.
This report represents the fifth installment in an annual series released by the Canadian Intellectual Property Office (CIPO), providing an overview of Intellectual Property (IP) activity within Canada, as well as abroad by Canadians.
CIPO recognizes that enhanced in-house research capabilities, together with an emphasis on collaborative enquiry into IP issues with the Canadian and international research and policy community, will better inform policy decisions that support innovation and economic success. Likewise, a strong evidence base comprised of timely and accurate IP analysis will also assist innovators, creators and businesses in making better informed decisions that affect their strategic direction. Using data from both CIPO and the World Intellectual Property Organization (WIPO), this report captures CIPO's data-driven approach to both IP analytics and economic research. As a special operating agency of Innovation, Science and Economic Development Canada (ISED), CIPO is also committed to ISED's Data Strategy, which is focused on leveraging ISED's data assets to better serve Canadian businesses and innovators.
From this year's report, it is clear that Canada remains an important destination for IP rights as evidenced by the continuous growth over the last decade of non-resident applications at CIPO. This growth, thanks in part to Canada joining international agreements such as the Madrid Protocol in 2019 and the Hague Agreement in 2018, reflects Canada's modernized IP regime which, in turn, serves as a driver of economic growth and innovation.
The effects of the COVID-19 pandemic have been felt across all sectors of the economy, and IP is no exception. CIPO has worked diligently to understand the impact of the pandemic on IP filings, as well as how well equipped Canadian institutions are in responding to pandemics. The IP Canada Report 2020 reveals some very important findings that inform decision makers as we work through the economic recovery.
CIPO's talent and data-driven research are what ultimately make these reports possible, and it is an honour to present this year's report.
About us
CIPO is a Special Operating Agency of ISED responsible for the administration of IP in Canada. CIPO contributes to Canada's innovation and economic success by providing greater certainty in the marketplace through high-quality and timely IP rights; fostering and supporting invention and creativity through knowledge sharing; raising awareness to encourage innovators to better exploit IP; helping businesses compete globally through international cooperation and the promotion of Canada's IP interests; and administering Canada's IP system and office efficiently and effectively.Endnotes 1
Our Five-year Business Strategy:Endnotes 2
 Advance innovation
- Harmonize Canada's IP system with international standards to support businesses operating globally
- Strengthen global collaboration to advance Canadian interests
- Modernize Canada's IP framework to support innovation

 Deliver quality and timely IP rights
- Provide IP rights and services that reflect client expectations, market needs and respect the public interest
- Be recognized as a quality-based organization
- Modernize our practices, processes and tools

 Build IP awareness and education
- Deliver an enhanced IP awareness and education program
- Expand our presence and partnerships in innovation-focussed networks and communities

 Offer a modern service experience
- Provide a consistent and client-centric service experience
- Enhance our web presence, promote self-service and improve online transactions
- Improve access to our IP data

 Foster an agile and high-performing organization
- Attract, retain and develop a highly skilled and engaged workforce
- Optimize our work environment and integrate new business and technological solutions
- Strengthen management excellence
Executive Summary
Canada is a major destination and source of IP rights, with almost 160,000 applications for patents, trademarks, and industrial designs coming to CIPO and going out of Canada annually. The IP Canada Report presents trends and research in IP usage both in Canada and by Canadians globally, using data from CIPO and WIPO.
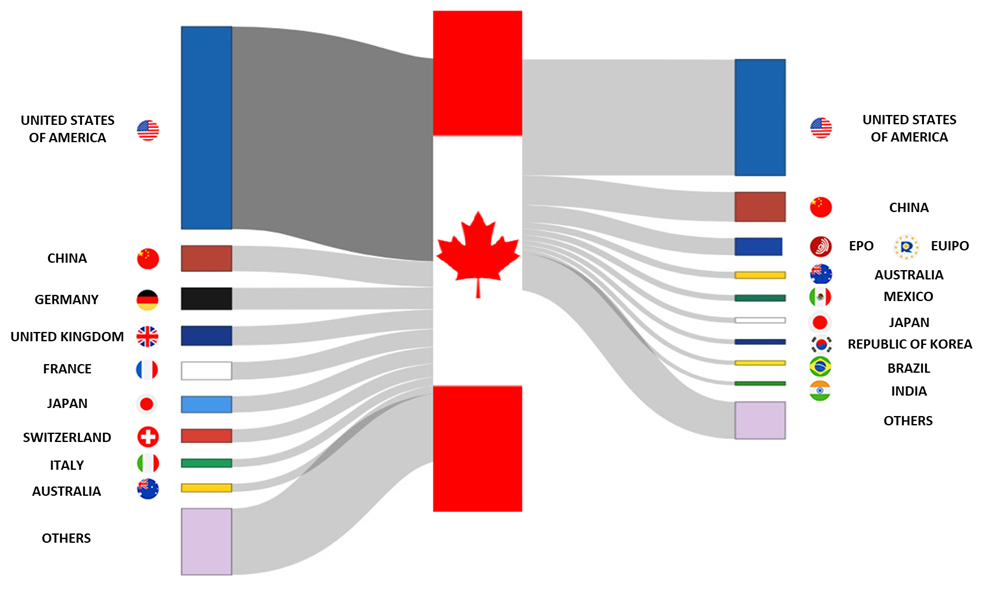
Figure 1 - Text version
Figure 1 is a Sankey diagram that maps the flow of IP applications into Canada by origin and out of Canada by destination. The centre of the diagram shows the Canadian flag, with IP applications to Canada on the left side and IP applications from Canada on the right side. Each side shows flow bars for the top nine filing origins or destinations, as well as a flow bar for all remaining countries combined. The width of the flow bars is proportional to the number of IP applications to or from that jurisdiction.
Annual growth in all IP categories, consistent long-term growth in non-resident applications
The long-term trends in non-resident applications at CIPO have shown consistent growth for all three IP categories. Over the past decade, non-resident applications grew at rates of 4%, 60%, and 33% for patents, trademarks, and industrial designs, respectively. These patterns suggest a persistently high level of confidence in Canada's IP system from the international business community. The growth in non-resident filings could be in part attributed to CIPO joining the Hague Agreement in late 2018 and the Madrid Protocol, in June 2019. Of all non-resident trademark applications in 2019, those using the Madrid System represented 24% a very high rate considering that this filing option was only available for half of the year. Meanwhile, 17% of all non-resident industrial design filings in 2019 used the Hague System, with some countries filing over 60% of their industrial design applications through that route. The modernization of Canada's industrial design and trademark regimes facilitates international participation in the Canadian market.
The use of IP abroad by Canadians has exhibited positive trends, emphasizing the importance Canadians place in protecting their innovation and brands in international markets. While growth in patent applications abroad by Canadians has slowed during the last five years, the long-term trend has been upwards between 2009 and 2018, during which total international applications have grown by 17%. Canadians filed an impressive 24,062 trademark applications abroad in 2018, corresponding to a 21% increase from 2017 and a 139% increase compared to 2009. They also filed 1,626 industrial design applications internationally, up 13% from 2017 and 5% since 2008. For all IP categories, the top-3 destinations for Canadian patent applications in 2018 were the United States, China, and the European Union (EU), via the European Patent Office (EPO) and the Intellectual Property Office (EUIPO). Although the United States remained the primary destination for Canadian applications, the proportion of Canadian filings have generally fallen in the United States and increased in China and the EU. The increased presence in these two regions demonstrates the efforts by Canadian inventors and businesses to broaden and diversify their markets.
Policy amendment leading to stronger IP protection in the agriculture sector
This report explores the evolution of Plant Breeders' Rights in Canada, following amendments to the Canadian Plant Breeders' Rights Act to bring it in line with the 1991 Act of the International Convention for the Protection of New Varieties of Plants (UPOV'91). Data from the Canadian Plant Breeders' Right Office (PBRO) shows a subsequent increase in applications for protection of vegetable and fruit varieties, as well as those for foreign agriculture varieties, suggesting a growing recognition of the importance of IP protection in the agriculture sector.
IP research focused on the impact of the COVID-19 pandemic
The Coronavirus disease 2019 (COVID-19) pandemic has had an unprecedented impact on economies across the globe, causing some businesses to modify their operations, and others to completely transform their organizations. This report includes CIPO's analysis of the significant impact that the COVID-19 pandemic has had to date on IP activity.
Given the relationship between IP filings and economic growth, a decrease in economic activity induced by the COVID-19 pandemic was anticipated to yield a decline in IP filings in Canada. To better understand and manage the consequences of the pandemic, CIPO ran weekly forecasting models to predict the future level of IP filings. Using American and Canadian Gross Domestic Product (GDP) in regression analysis, it was found that a 1% increase in GDP growth was associated with a contemporaneous increase of 0.9%, 3.5%, and 2.3% in patents, trademarks, and industrial designs, respectively. The results suggest that times of greater economic volatility would lead to greater variance in the IP filing forecasting. The unprecedented nature of the COVID-19 pandemic and our recent implementation of a number of international treaties has created an intersection of impacts that are having both upward and downward pressure on IP filings at CIPO.
Research presented in this report also examines the factors that affect the life of patents, focusing on the effect produced by economic crises. CIPO's analysis shows that patents from small entities have a lower survival rate than those from large entities, and that the survival of patents in Canada varies across technology groups. In an attempt to shed light on the possible consequences of the current COVID-19 pandemic on patenting behaviour, the study used information from previous economic crises to forecast the effect of the COVID-19 pandemic on patent survival rates. The findings predict that these rates are expected to increase, with a higher impact on patents going through their third to sixth renewals.
Finally, this report includes several findings from an upcoming IP Analytics study on the innovation undertaken by Canadian institutions during previous outbreaks similar to COVID-19, such as H1N1 and SARS. The study presents prior patenting activity in the research areas targeted by the Pandemic Response Challenge Program developed by the National Research Council. An examination of the growth experienced by other leading countries for pandemic-fighting technologies between 1999 and 2018 reveals that while the United States and China are the clear leaders, Canada ranks on par with next group of leading innovative economies such as Germany and Japan. Canadian institutions also display a high relative specialization in pandemic fighting technologies. The findings from this research are useful to better understand which institutions have patented extensively in areas that could assist in fighting the COVID-19 pandemic.
Introduction
The IP Canada Report 2020 is the fifth report in an annual series that presents trends and research in IP usage, both in Canada and by Canadians globally. The first three sections of this report present the data on applications for patents, trademarks and industrial designs, respectively. CIPO provides data for the IP activity in Canada in 2019.Endnotes 3 International data come from WIPO's Statistics Data Center.Endnotes 4 International data lags domestic data by one year due to the time needed to compile data across all WIPO members; accordingly, data for filings outside of Canada is available only up to 2018 in this report.
Canadians across both public and private sectors recognize the importance of IP to further economic prosperity. Though Canada performs relatively well on innovation, ranking 17th in WIPO's Global Innovation Index 2020, our innovation input rank (9th) exceeds our innovation output rank (22nd) substantially.Endnotes 5 IP rights like patents, trademarks, and industrial designs are central to a country's innovation output. Patents incentivize innovation by giving owners exclusive rights to control the usage of their processes and technologies. Trademarks allow business owners to protect their unique branding, helping them distinguish their products and services in the marketplace and profit from their good reputation. Industrial designs protect the unique aesthetic features of products, which can give them a competitive edge in the marketplace. Enhancing Canadians' use of IP rights both domestically and abroad is critical for success in an economy increasingly driven by intangible assets.
Advancing innovation through a modern IP framework and strong international collaboration is one of CIPO's main strategic priorities.Endnotes 6 CIPO has worked diligently in recent years to implement five international treaties to support the future use of IP in Canada and abroad by Canadians. In November 2018, Canada acceded to the Hague Agreement for industrial designs, and in 2019, Canada brought into force three trademark treaties (the Madrid Protocol, the Singapore Treaty, and the Nice Agreement) and the Patent Law Treaty.Endnotes 7 These treaties aim to reduce administrative burden, harmonize administrative procedures, and provide Canadians with a faster, simpler, and more cost-effective way of protecting their IP in multiple countries.
While long-term trends show important growth for trademark and industrial design rights in Canada, patenting levels remain relatively flat. However, patent filings have been on a slow, upward trend since 2016, having reached the second highest level in the last 10 years. In addition to recent data and trends in the three main IP rights, this report explores Plant Breeders' Rights and the recent changes in IP activity in the Canadian agriculture sector. Also presented in this report is research focusing on the impact of the COVID-19 pandemic on innovation and the use of IP. These studies convey important findings about the possible consequences of economic crises on IP filings and patenting behavior. The associated analyses and results are included, with the hopes of assisting other IP offices, broader government policy makers and the general public in devising strategies to address the consequences of the COVID-19 pandemic.
CIPO also administers three other forms of IP that are not included in this report; copyrights, integrated circuit topographies, and geographical indications (GI). A copyright does not need to be registered to be enforceable in Canada,Endnotes 8 so formal data do not fully encompass its usage. Integrated circuit topographies refer to the three-dimensional configurations of electronic circuits embodied in integrated circuit products or layout designs and are not included due to a lack of readily accessible data on domestic and international activity.Endnotes 9 A geographical indication can identify a wine or spirit, or an agricultural product or food of a category set out in the Trademarks Act. CIPO is responsible for processing requests for protection of GIs and ensuring that they are entered on the list of protected GIs maintained by the Registrar. Plant breeders' rights protect new varieties of plants in a similar fashion to patents and are administered by the Canada Food Inspection Agency (CFIA).Endnotes 10
Patents
Patents are a key driver of economic growth through innovation by providing applicants with a time-limited, legally protected, exclusive right to make, use, and sell an invention. As a result, a strong patent system is required in order to create a positive feedback loop for inventors; they will only be incentivized to keep innovating if they are certain that legal protection and enforcement of rights will be honoured. In 2019, Canada has once again demonstrated itself as an attractive market to seek protection, by receiving 36,488 filings from Canadian and foreign applicants, representing a sustained 1% increase over the last year. Although Canadian domestic filings have been on a slow downward trend, decreasing by 3% since last year and 7% in the last decade, non-resident filings have remained relatively steady, suggesting a persistently high level of interest in the Canadian market from the international community. In fact, non-resident patent applications grew by 1% last year and 4% over the last decade. Applications by Canadians in other jurisdictions, on the other hand, grew by 17% over the ten-year period between 2009 and 2018.
Patent Applications Filed in Canada
Figure 2 below depicts the top six filing countries at CIPO in 2019. The United States remained the top applicant at CIPO with a total of 16,738 applications, a 2% increase from 2018. Alone, Canada's neighbour accounted for almost half (46%) of all applications in 2019. This underscores the importance for American inventors to have access to Canadian markets. Despite a decline of 3% in the number of resident filings, Canada retained its position as the second highest applicant with 4,238 applications, accounting for 12% of all applications. Germany, Japan, and France each retained their respective positions in the ranking. China has shown strong growth between 2018 and 2019 with a 36% increase in applications, for a total of 1,486, entering the non-resident top-5 and signalling its increased interest in the Canadian market.
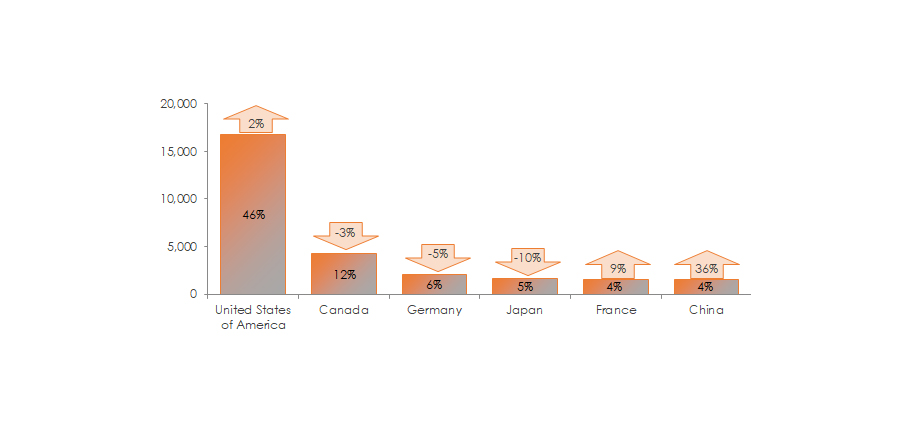
Figure 2 - Text version
| Patents by country of origin | 2019 | % of total | ∆ 2019 |
|---|---|---|---|
| United States of America | 16,738 | 46% | 2% |
| Canada | 4,238 | 12% | -3% |
| Germany | 2,045 | 6% | -5% |
| Japan | 1,659 | 5% | -10% |
| France | 1,554 | 4% | 9% |
| China | 1,486 | 4% | 36% |
After a 7% increase in 2018, resident patent applications at CIPO decreased by 3% in 2019. Consequently, the modest 1% growth in overall patent applications observed is attributed to the 1% increase in non-resident filings during the same year. As seen in Figure 3 below, non-resident filings have been on a slow, upward trend since 2016, having reached the second highest level in the last 10 years. Total patent filings at CIPO have followed a very similar trend over the same time period, having also reached a second highest level in the last decade. Although the long-term trend in resident filings has been downward, non-resident filings have grown 4% in the last decade.

Figure 3 - Text version
| Year | Resident | Non-resident | Total |
|---|---|---|---|
| 2010 | 4,550 | 30,899 | 35,449 |
| 2011 | 4,754 | 30,357 | 35,111 |
| 2012 | 4,709 | 30,533 | 35,242 |
| 2013 | 4,567 | 30,174 | 34,741 |
| 2014 | 4,198 | 31,283 | 35,481 |
| 2015 | 4,277 | 32,687 | 36,964 |
| 2016 | 4,078 | 30,667 | 34,745 |
| 2017 | 4,053 | 30,969 | 35,022 |
| 2018 | 4,349 | 31,812 | 36,161 |
| 2019 | 4,238 | 32,250 | 36,488 |
Applicants have two options among which they can choose when filing in Canada: they can file directly or use the Patent Cooperation Treaty (PCT) system, which allows applicants to designate multiple signatory countries in a single application. Figure 4 below separates filings in Canada by filing route. In 2019, applicants filed 7,911 applications through the direct route and 28,577 through the PCT route. These filing levels mark a 2% and 1% year-over-year increase respectively since 2018. Over the last decade, applicants have increasingly utilized the PCT system as illustrated by the upward trend in the illustration below. In fact, filings through this route have grown by 4% between 2010 and 2019. Moreover, increased PCT utilization can also be observed through the PCT utilization rate. During the last decade, this rate has varied between 76% and 80%, further confirming strong usage by applicants filing at CIPO.
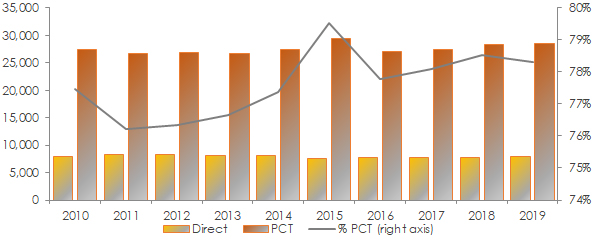
Figure 4 - Text version
| Year | Direct | PCT | % PCT (right axis) |
|---|---|---|---|
| 2010 | 7,989 | 27,460 | 77% |
| 2011 | 8,352 | 26,759 | 76% |
| 2012 | 8,338 | 26,904 | 76% |
| 2013 | 8,114 | 26,627 | 77% |
| 2014 | 8,030 | 27,451 | 77% |
| 2015 | 7,571 | 29,393 | 80% |
| 2016 | 7,724 | 27,021 | 78% |
| 2017 | 7,672 | 27,350 | 78% |
| 2018 | 7,765 | 28,396 | 79% |
| 2019 | 7,911 | 28,577 | 78% |
Patent Applications Filed Abroad by Canadians
Filing for patents internationally is essential for Canadian applicants wishing to protect their innovation abroad, especially in larger markets. In 2018, Canadians have once again shown a strong presence on the international stage, suggesting a sense of IP awareness. Figure 5 presents the top three destinations for Canadian patent applicants in 2018, which include the United States, the EPO and China. All three jurisdictions retained their respective rankings from last year and remained key markets targeted by Canadians in 2018. Although there has been a slight decrease in the number of patents filed by Canadians in the United States, filings in the European Union—via the EPO—and in China have increased between 2017 and 2018. Canadians filed 13,045 applications in the United States, 1,579 at the EPO and 1,105 in China, corresponding to 66%, 8% and 6% respectively of all applications filed abroad by Canadians. These results for the EPO and China indicate increased Canadian presence in these two regions, particularly in China where patent filings by Canadians surpassed the 1,000 mark, signalling an effort by Canadian inventors to diversify and seek new markets. Nonetheless, the United States unsurprisingly remains the top filing jurisdiction for Canadian inventors, confirming the deep integration between the two markets.
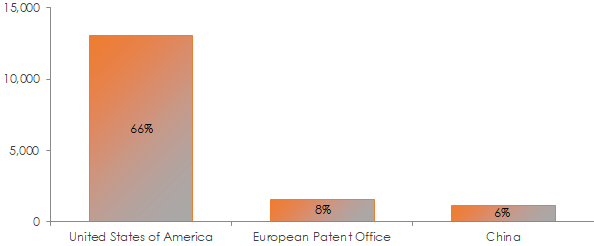
Figure 5 - Text version
| Top-three destinations | 2018 | % of total |
|---|---|---|
| United States of America | 13,045 | 66% |
| European Patent Office | 1,579 | 8% |
| China | 1,105 | 6% |
Figure 6 shows applications outside of Canada by Canadians from 2009 to 2018, by filing route. In 2018, Canadians filed for 19,684 patents abroad, of which 7,511 used the PCT route (38%) and 12,173 were direct applications (62%). Total filings abroad were up 1% from 2017, and PCT applications increased by 2%. The long-term trend is upwards in all aspects of Canadian patent filings abroad between 2009 and 2018: total international applications by Canadians grew by 17%, while PCT and direct applications increased by 31% and 10% respectively during this period.
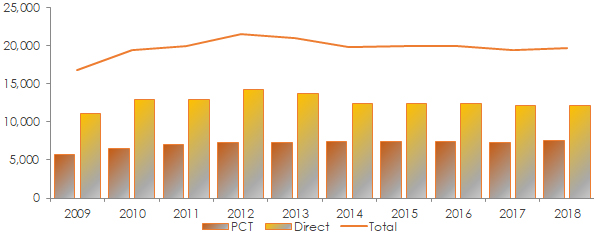
Figure 1 - Text version
| Year | Direct | PCT | Total |
|---|---|---|---|
| 2009 | 11,094 | 5,733 | 16,827 |
| 2010 | 12,880 | 6,517 | 19,397 |
| 2011 | 12,902 | 7,060 | 19,962 |
| 2012 | 14,254 | 7,289 | 21,543 |
| 2013 | 13,706 | 7,313 | 21,019 |
| 2014 | 12,461 | 7,365 | 19,826 |
| 2015 | 12,426 | 7,463 | 19,889 |
| 2016 | 12,437 | 7,463 | 19,900 |
| 2017 | 12,130 | 7,331 | 19,461 |
| 2018 | 12,173 | 7,511 | 19,684 |
Conclusion
Patent activity in Canada continues to show a long-term, steady trend, evidenced by a 1% growth in 2019, driven by a 1% increase from non-resident filings, contrasted by a 3% decrease from residents. Applications abroad by Canadians have slowed during the last five years. The increases in direct filings were observed mainly in the early part of this decade, but were not sustained in the years that followed. On the other hand, PCT applications abroad by Canadians have generally shown growth since 2009.
Trademarks
Trademarks are an essential component of a business' brand recognition in the marketplace. They protect the words, designs, sounds, shapes or colours used to distinguish their goods and services from others in the market.Endnotes 11 Trademark applications at CIPO and abroad by Canadians have grown steadily over the last ten years, emphasizing the importance international businesses place in protecting their brands in Canada and the importance Canadian businesses place in protecting their brands in Canada and international markets.
Trademark Applications Filed in Canada
In 2019, applicants filed 68,277 trademark applications at CIPO, of which 28,608 originated from residents, and 39,669 from non-residents, demonstrating businesses' sustained interest in protecting their brand in Canada. Figure 7 shows total trademark filings, as well as the separation between resident and non-resident filings from 2010 to 2019. The 68,277 filings marked a new record, an 8% increase since the previous year, and 51% growth with respect to 2010 levels. This persistent and strong long-run growth in filings can be partially attributed to the post-recession rebound that occurred in 2010 after the financial crisis. Resident filings at CIPO have been particularly strong, growing by 40% over the last decade and 5% in 2019 alone. Similarly, non-resident filings have grown at a rate of 60% during the same period, indicating a high level of interest in the Canadian market from the international business community, particularly the 11% increase observed between 2018 and 2019.

Figure 7 - Text version
| Year | Resident | Non-resident | Total |
|---|---|---|---|
| 2010 | 20,449 | 24,771 | 45,220 |
| 2011 | 21,337 | 27,135 | 48,472 |
| 2012 | 21,741 | 28,369 | 50,110 |
| 2013 | 21,449 | 28,370 | 49,819 |
| 2014 | 21,348 | 29,680 | 51,028 |
| 2015 | 22,589 | 29,872 | 52,461 |
| 2016 | 23,652 | 31,013 | 54,665 |
| 2017 | 25,853 | 33,060 | 58,913 |
| 2018 | 27,320 | 35,738 | 63,058 |
| 2019 | 28,608 | 39,669 | 68,277 |
The top-six countries of origin for trademark filings at CIPO in 2019 are shown in Figure 8 below. Canadians filed 28,608 applications at CIPO, retaining Canada's position as the top filing country. Additionally, its share of total applications filed in Canada increased modestly in 2019, now accounting for 42% of all filings. The United States, China, the United Kingdom, Germany, and France all retained the same position in the 2019 ranking as in 2018.
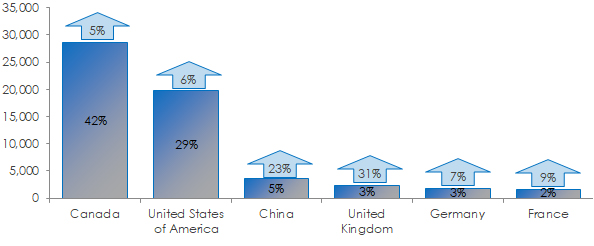
Figure 8 - Text version
| Trademarks by country of origin | 2019 | % of total | ∆ 2019 |
|---|---|---|---|
| Canada | 28,608 | 42% | 5% |
| United States of America | 19,835 | 29% | 6% |
| China | 3,541 | 5% | 23% |
| United Kingdom | 2,248 | 3% | 31% |
| Germany | 1,775 | 3% | 7% |
| France | 1,631 | 2% | 9% |
Since the accession to the Madrid Protocol on , trademark applications via this filing route showed impressive levels of use. Canada received 9,324 applications from non-residents using the Madrid System.Endnotes 12 This represents 24% of non-resident applications, a very high rate considering that the Madrid option was available for only half of 2019. Figure 9 shows that the highest volume of Madrid applications was received from the United States, which represents 3,086 applications, or 16%, of the total applications received in Canada by applicants from the United States. This is a relatively small proportion if compared with applications from Germany, United Kingdom, and France, as their proportions of Madrid filings in Canada over total filings in Canada by applicants of those countries were 46%, 31%, and 38% respectively.
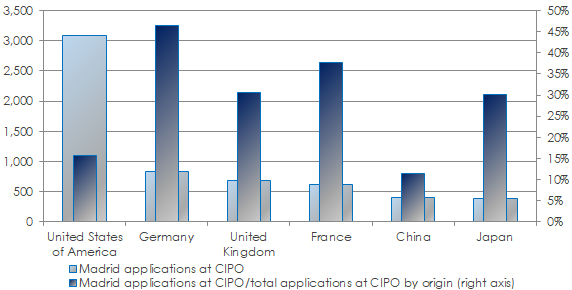
Figure 9 - Text version
| Country of origin | Madrid applications at CIPO | Madrid applications at CIPO/total applications at CIPO by origin (right axis) |
|---|---|---|
| United States of America | 3,086 | 16% |
| Germany | 824 | 46% |
| United Kingdom | 689 | 31% |
| France | 616 | 38% |
| China | 402 | 11% |
| Japan | 385 | 30% |
Trademark Applications Filed Abroad by Canadians
With increased globalization and connectivity in recent years, protecting brands has become a crucial part of conducting business and standing out amongst competitors. As a result, it is important that business owners protect their brand with trademarks. Canadian businesses have again demonstrated that they understand the importance of protecting their global brand in 2018 by filing an impressive 24,062 trademark applications, corresponding to a 21% increase from 2017 and a 139% increase compared to 2009.
Figure 10 displays the top three international destinations for Canadian trademark applicants. As expected, the United States remained the primary destination for Canadian applicants with a total of 9,036 trademark applications in 2018. Similarly, China remained a key filing destination for Canadians, retaining its position as the second jurisdiction of choice abroad. In fact, demand for trademarks in China increased by 33% between 2017 and 2018 to reach 4,530 applications. Between 2009 and 2018, Canadian filings in China increased by 384%, which underscores the importance Canadian businesses attribute to entering the fast-growing, large Chinese economy. The EUIPO saw an increase in Canadian filings between 2017 and 2018 in the magnitude of 21%, which amounts to 1,566 applications. Since 2009, Canadian businesses have increasingly targeted the European Union via the EUIPO as a key destination for filing trademarks, which is reflected in the 93% growth rate observed since then.
Although the United States received the largest share of applications from Canadians in 2018 (38%), the share of filings to international destinations excluding the top three listed in Figure 10 reached 36%, suggesting increased efforts by Canadian businesses to grow their brand in a variety of markets rather than simply focusing on their traditional major markets. In fact, with the recent implementation of the Madrid Protocol in Canada and given the ease of access to diverse markets provided to Canadians through this agreement, one might expect this trend to continue in the future.
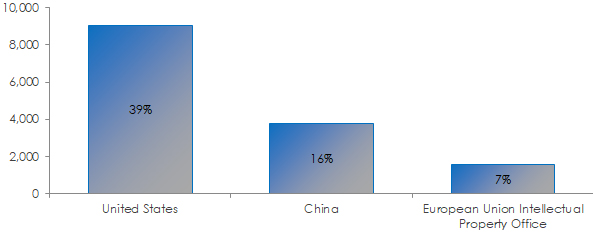
Figure 10 - Text version
| Top-three destinations | 2018 | % of total |
|---|---|---|
| United States | 9,036 | 39% |
| China | 3,761 | 16% |
| European Union Intellectual Property Office | 1,566 | 7% |
Figure 11 shows Canadian trademark filings abroad and annual growth rates from 2009 to 2018. Filings by Canadians have grown consistently almost every year since the 2008 financial crisis. Trademark applications abroad by Canadians totalled 24,062 in 2018, growing by 139% since 2009.
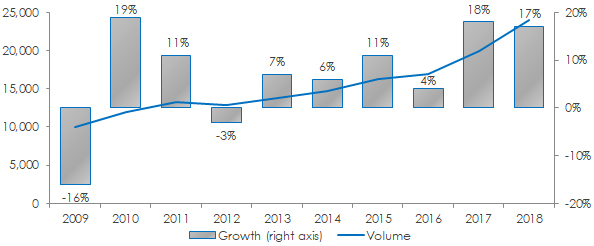
Figure 11 - Text version
| Year | Volume | Growth (right axis) |
|---|---|---|
| 2009 | 10,057 | -16% |
| 2010 | 11,976 | 19% |
| 2011 | 13,244 | 11% |
| 2012 | 12,882 | -3% |
| 2013 | 13,800 | 7% |
| 2014 | 14,669 | 6% |
| 2015 | 16,316 | 11% |
| 2016 | 16,923 | 4% |
| 2017 | 19,899 | 18% |
| 2018 | 24,062 | 17% |
Conclusion
With the Madrid Protocol implemented in Canada on June 17, 2019, trademarks constitute the fastest‑growing IP activity, in Canada and abroad by Canadians. Filings showed an annual increase of 8% in 2019, following two years of annual growth of 7% and 8%. During the last decade, filings in Canada have increased by 51%. Applications filed abroad by Canadians grew by 139% between 2009 and 2018. The first six months with Canada as a member of the Madrid Protocol showed the importance for Canada to join as non-resident applicants used this filing option on nearly one in every four of their applications at CIPO.
Industrial Designs
An industrial design protects the visual appearance of a product, allowing the owner to gain an edge over competitors in the marketplace through aesthetics and a unique look. Industrial designs are key to the success of businesses engaged in the design or sale of many tangible goods. In 2019, CIPO received 6,390 industrial design applications, a 5% decrease with respect to 2018. The 10-year trend has been upwards; total filings grew by 24% since 2010, a rate that is largely driven by the 33% increase in non-resident applications over the same period. In contrast, Canadian industrial design filings at CIPO were 18% lower than 10 years ago.
Industrial Design Applications Filed in Canada
The top six countries filing for industrial designs in 2019 are presented in Figure 12 below. Although its filings decreased by 9% since 2018, the United States remained the top filer, with a total of 3,342 applications. This country accounted for 52% of all industrial design filings at CIPO, compared to 55% in 2018. Similarly, despite a 10% year-over-year drop in filings, Canada ranked second. In contrast, Germany advanced to third position with a 10% increase from 2018, and Switzerland demonstrated very strong annual growth between 2018 and 2019 at 40%, entering this year's top filing countries and ranking fourth. All these significant increases in filings from European countries could be partially attributed to CIPO joining the Hague Agreement in late 2018. China remained as the fifth ranked country. Lastly, Japan ranked sixth despite a 15% decrease in industrial design applications. Combined, the top six countries accounted for 78% of all filings in Canada, and the top five international filers accounted for 75% of all non-resident filings in Canada.
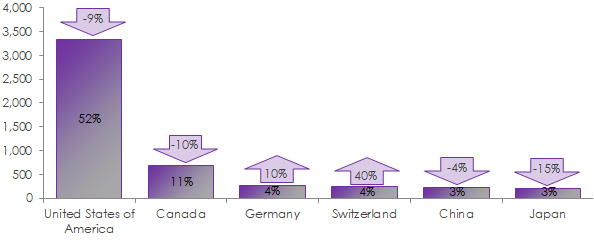
Figure 12 - Text version
| Industrial designs by country of origin | 2019 | % of total | ∆ 2019 |
|---|---|---|---|
| United States of America | 3,342 | 52% | -9% |
| Canada | 695 | 11% | -10% |
| Germany | 266 | 4% | 10% |
| Switzerland | 234 | 4% | 40% |
| China | 220 | 3% | -4% |
| Japan | 209 | 3% | -15% |
Figure 13 below depicts industrial design applications at CIPO over the last decade by residency status, along with the total. CIPO received 6,390 applications in 2019, a 5% decrease with respect to the previous year, with 695 filings by residents and 5,695 by non-residents. These high year-over-year variations are common in industrial designs filings in Canada, as the volumes tend to be lower than those of other IP rights. Filings in 2019 were 24% above 2010 levels, an indication of a long-term increasing demand for industrial design protection in Canada, especially from international applicants. In fact, non-resident applications have grown 33% since 2010. On the other hand, resident applications at CIPO were down 10% in 2019 and 18% compared to 2010, which is largely due to the successive years of decline after 2016.
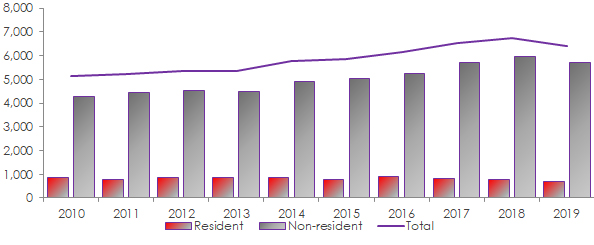
Figure 13 - Text version
| Year | Resident | Non-resident | Total |
|---|---|---|---|
| 2010 | 851 | 4,291 | 5,142 |
| 2011 | 790 | 4,437 | 5,227 |
| 2012 | 847 | 4,515 | 5,362 |
| 2013 | 846 | 4,500 | 5,346 |
| 2014 | 859 | 4,908 | 5,767 |
| 2015 | 797 | 5,049 | 5,846 |
| 2016 | 916 | 5,254 | 6,170 |
| 2017 | 815 | 5,718 | 6,533 |
| 2018 | 770 | 5,967 | 6,737 |
| 2019 | 695 | 5,695 | 6,390 |
The Hague Agreement was implemented in Canada on , allowing applicants from other countries to file for industrial designs in Canada using that route. This means that the Hague System was available for applicants during the entirety of 2019, which allows some initial analysis on its use. There were 975 industrial design applications in Canada that used the Hague System. Of all non-resident filings in Canada, those using the Hague System represented 17%.
The use of the Hague System by non-residents designating Canada is presented in Figure 14. It shows that although the United Stated was the top Hague user filing in Canada with 185 applications, its proportion of Hague applications designating Canada over the total design filings from applicants in the United States is 6%, a small rate when contrasted with the spectacular rate of 71% for France. The fact that countries outside of North America display such high rates of use of the Hague and Madrid Systems adds to the idea that applicants from those jurisdictions see the close integration between Canada and the United States as part of the North American market.
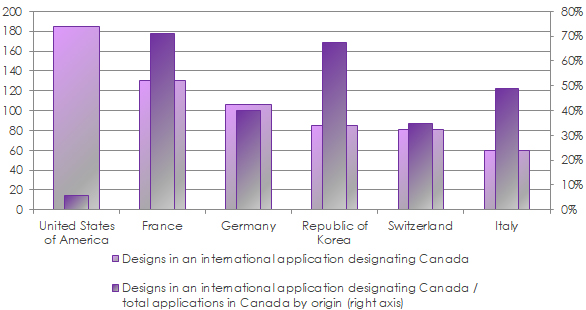
Figure 14 - Text version
| Country of origin | Designs in an international application designating Canada | Designs in an international application designating Canada / total applications in Canada by origin (right axis) |
|---|---|---|
| United States of America | 185 | 6% |
| France | 130 | 71% |
| Germany | 106 | 40% |
| Republic of Korea | 85 | 67% |
| Switzerland | 81 | 35% |
| Italy | 60 | 49% |
Industrial Design Applications Filed Abroad by Canadians
Figure 15 presents the top three countries abroad targeted by Canadian industrial design applicants in 2018. The United States remained the top industrial design filing destination for Canadians, accounting for 51% of the share of applications filed abroad. This marks a non-trivial 14% decrease compared to last year. Since 2009, Canadian filings in the United States have fallen by 7%. This downward trend has been largely offset by the significant 24% growth in Canadian applications to the European Union, via the EUIPO, during the same period. This suggests a continuous effort by Canadians to broaden their target markets. In 2018 alone, applications at the EUIPO grew 37% with respect to the previous year, representing 13% of all filings abroad by Canadians. Similarly, Canadian industrial design filings in China increased between 2017 and 2018 by 36%. This positions China as the third most important filing destination for Canadians with a 10% share of international applications by Canadians. Combined, the top three destinations accounted for 74% of the share of international applications, a share that has decreased substantially compared to the previous year (86%). This implies that the share of filings to the rest of the world by Canadians accounted for 26% in 2018, further confirming market diversification among Canadian applicants.
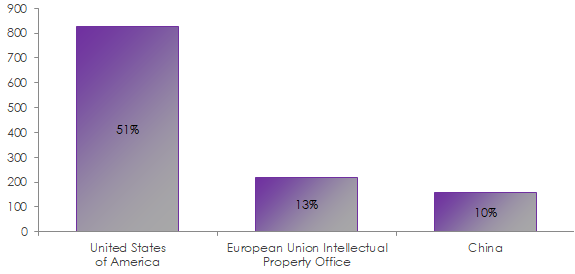
Figure 15 - Text version
| Top-three destinations | 2018 | % of total |
|---|---|---|
| United States of America | 828 | 51% |
| European Union Intellectual Property Office | 218 | 13% |
| China | 160 | 10% |
Figure 16 below provides a visual representation of patterns in industrial design filings by Canadians from 2009 to 2018. In 2018, Canadians filed 1,626 applications internationally, up 13% from 2017. Since 2009, filings have only grown by 5%. This is due to the volatility in annual growth rates of industrial design applications abroad by Canadians: periods of strong growth, such as 2009, 2012, 2016 and 2018 are offset by periods negative growth. Nonetheless, demand for industrial design protection abroad by Canadians remains strong.
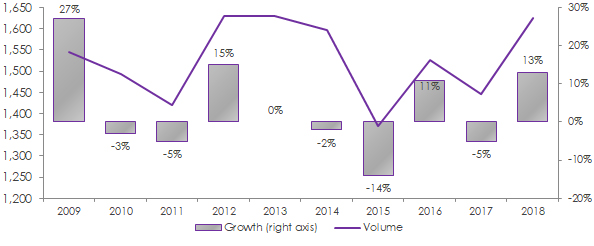
Figure 16 - Text version
| Year | Volume | Growth (right axis) |
|---|---|---|
| 2009 | 1,545 | 27% |
| 2010 | 1,493 | -3% |
| 2011 | 1,420 | -5% |
| 2012 | 1,629 | 15% |
| 2013 | 1,629 | 0% |
| 2014 | 1,596 | -2% |
| 2015 | 1,371 | -14% |
| 2016 | 1,525 | 11% |
| 2017 | 1,445 | -5% |
| 2018 | 1,626 | 13% |
Conclusion
Industrial design filings from non-residents have grown 24% since 2010 and filings abroad by Canadians have grown 5% since 2009. However, resident filings in Canada have decreased since 2010. 2019 was Canada's first full year as member of the Hague Agreement, which significantly modernized its industrial design regime by allowing applicants to acquire, maintain and manage industrial design rights in multiple countries through a single application filed with WIPO. In that year, 17% of all non-resident filings used the Hague System, with applicants from some countries filing over 60% of their industrial design applications via that route.
Plant Breeders' Rights
What Are Plant Breeders' Rights?
Plant breeder rights are a form of intellectual property rights by which plant breeders can protect their new varieties in the same way an inventor protects a new invention with a patent. These new varieties can be grouped into agricultural plants (cereals, pulses, potatoes, oilseeds, and forages) and horticulture plants (fruits, vegetables, and ornamentals).
The purpose of the plant breeders' rights regime is to incentivize investment and innovation in the development of new plant varieties to support agriculture productivity, and meet society's demand for food, fibre, and plant-based products. In Canada, the plant breeders' rights IP regime is administered by PBRO, located within the Canadian Food Inspection Agency. With the grant of a plant breeders' rights for a new plant variety, the holder obtains exclusive rights in relation to the propagating material (e.g. seed, cuttings, budwood, etc.) of their variety. The title holder is able to protect the variety from exploitation by others, and can take legal action against individuals or companies that are conducting unauthorized acts. An effective plant breeders' rights system creates an environment that encourages plant breeding in Canada, as well as facilitating access to innovative new varieties of plants from other countries.
Plant Breeders' Rights Applications Filed in Canada
This subsection includes a summary of 2019 applications filed directly at PBRO, as well as using the International Union for the Protection of New Varieties of Plants (UPOV) PRISMA international system of online filing. Figure 17 shows that 20% of plant breeders' rights applications were received from domestic entities and 80% from international entities, demonstrating our reliance on, and market opportunities for foreign plant varieties in Canada. The United States accounts for 36% of the applications, with the majority being in the agriculture sector (i.e. cereals, pulse, potatoes, oilseed and forage crops).

Figure 17 - Text version
| Plant breeders' rights applications by country of origin | 2019 | % of total | ∆ 2019 |
|---|---|---|---|
| United States of America | 133 | 36% | -12% |
| Canada | 75 | 20% | 5% |
| Netherlands | 50 | 14% | 3% |
| Germany | 31 | 8% | -2% |
| Switzerland | 17 | 5% | 1% |
| Japan | 17 | 5% | 1% |
In 2019, PBRO continued to witness a sustained increase in the number of filings since 2015 (Figure 18). This increase can be attributed to amending the Plant Breeders' Rights Act in 2015, bringing it into conformity with the 1991 Act of the International Convention for the Protection of New Varieties of Plants (UPOV'91). Amending the Plant Breeders' Rights Act encouraged greater domestic investment in plant breeding, providing Canadian growers and consumers with increased access to new and innovative plant varieties.
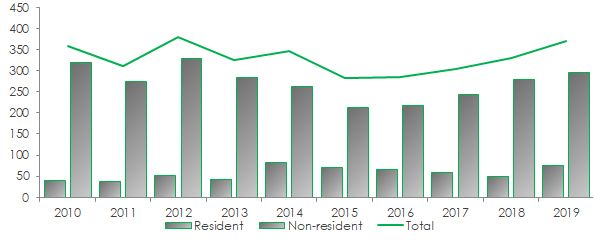
Figure 18 - Text version
| Year | Resident | Non-resident | Total |
|---|---|---|---|
| 2010 | 40 | 319 | 359 |
| 2011 | 38 | 274 | 312 |
| 2012 | 51 | 330 | 381 |
| 2013 | 42 | 283 | 325 |
| 2014 | 83 | 263 | 346 |
| 2015 | 70 | 213 | 283 |
| 2016 | 67 | 217 | 284 |
| 2017 | 59 | 244 | 303 |
| 2018 | 50 | 280 | 330 |
| 2019 | 75 | 295 | 370 |
Since moving to UPOV'91, PBRO has seen a significant increase in applications for protection of vegetable and fruit varieties, as shown in Figure 19.
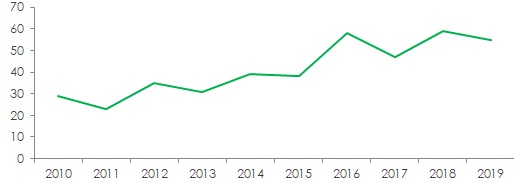
Figure 19 - Text version
| Year | Total |
|---|---|
| 2010 | 29 |
| 2011 | 23 |
| 2012 | 35 |
| 2013 | 31 |
| 2014 | 39 |
| 2015 | 38 |
| 2016 | 58 |
| 2017 | 47 |
| 2018 | 59 |
| 2019 | 55 |
Additionally, PBRO has also noticed an increase in the number of non-resident agriculture variety applications for protection in the Canadian marketplace. This is depicted in Figure 20. This helps to ensure that Canadian farmers have access to new and innovative plant varieties from outside of Canada, supporting their competitiveness in a global marketplace. Furthermore, creating an environment that strengthens IP protection in the agriculture sector also creates a robust and healthy investment landscape. These investments support higher quality and more productive canola, wheat, soybeans, corn, pulse, barley, and forage varieties.
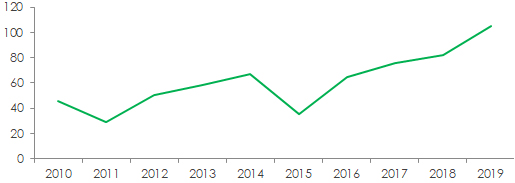
Figure 20 - Text version
| Year | Total |
|---|---|
| 2010 | 46 |
| 2011 | 29 |
| 2012 | 50 |
| 2013 | 59 |
| 2014 | 67 |
| 2015 | 35 |
| 2016 | 65 |
| 2017 | 76 |
| 2018 | 82 |
| 2019 | 105 |
Conclusion
The importance of the introduction of new international varieties into the Canadian marketplace is clear with 80% of applications coming from non-resident applicants. PBRO is also starting to notice the impacts of bringing the Plant Breeders' Rights Act inline with the most recent version of the UPOV convention. Since the amendment, PBRO has noticed a sharp increase in the number of applications in the vegetable and fruit sector. An increase in agricultural crop filings from non-residents was also noticed. Strengthened IP protection, as a result of amending the Plant Breeders' Rights Act, has helped ensure that growers have increased access to new and innovative plant varieties, allowing them to be more competitive both domestically and internationally.
Understanding the Impact of the COVID-19 Pandemic on IP Activity
The outbreak of the Coronavirus disease 2019 (SARS-CoV-2, or COVID-19) began to emerge around the globe in February 2020, and by March 2020 a worldwide pandemic was declared by the World Health Organization (WHO).Endnotes 13 Since March, government mandated societal lockdowns have been implemented in many countries to limit the spread of the disease and reduce the expected death toll.Endnotes 14 In turn, economies across the globe experienced stark decreases in economic activity at levels never witnessed before in such short amounts of time. For example, Canada saw a record decline during the month of March, with real GDP falling 7.2 percent in a single month.Endnotes 15 To add to the difficulty of the situation, there was an unprecedented level of uncertainty forcing some practitioners to abandon forecasting efforts and wait out until the obscurity at hand has dissipated.Endnotes 16 This section investigates two important questions that are key to CIPO. First, how will the events of 2020 impact filings for patents, trademarks and industrial designs in Canada? Second, how will the pandemic impact patent renewals in Canada?
Impact of the COVID-19 Pandemic on IP Filing Activity
The ability to predict the level of IP activity in a given time period is of great interest to national IP offices as this assists in making budget and operational decisions.Endnotes 17 Research has shown that IP filings are generally positively correlated with economic growth.Endnotes 18 Endnotes 19 Hence, the stark decrease in economic activity induced by the COVID-19 pandemic was anticipated to yield a decline in IP filings in Canada. In order to mitigate any negative ramifications on its operations, CIPO proactively revisited its forecasting models to predict the future volumes of IP filings, taking into account the heightened levels of economic uncertainty induced by the pandemic. This effort and its methodology was similar to that of other IP offices around the world.
Previous research studies conducted at CIPO provided evidence of IP activity being associated with several economic indicators, such as unemployment, GDP growth, and stock market indices from Canada and the United States. When the objective is to forecast IP activity, it is necessary to shock future values of the economic variables. This is known generally as scenario design. For the scenario design carried out at CIPO, GDP was chosen as the key economic variable, as it possessed the most promising characteristics out of all the potential economic indicators assessed. Both American and Canadian GDP growth rates were used. This is not surprising given our deep economic integration with the United States.
The results produced from CIPO's models were found to be intuitive from an economic perspective. For example, a 1% increase in GDP growth was associated with a contemporaneous increase of 0.9%, 3.5%, and 2.3% in patents, trademarks, and industrial designs, respectively. These results were congruent with prior hypotheses about GDP growth being positively associated with IP filing growth. The models were also evaluated for their dynamic response to GDP shocks through scenario simulations. The response of the IP series solely fluctuated in the same direction as the shock, suggesting that the positive relationship between economic growth and IP filings can be extended to previous values of economic growth. Furthermore, as shown in Figure 21, the model behaved in a manner similar to previous shocks, as the magnitude and the duration of the shock were found to bear similar characteristics to that of the 2008-2009 recession when using the corresponding values of GDP.
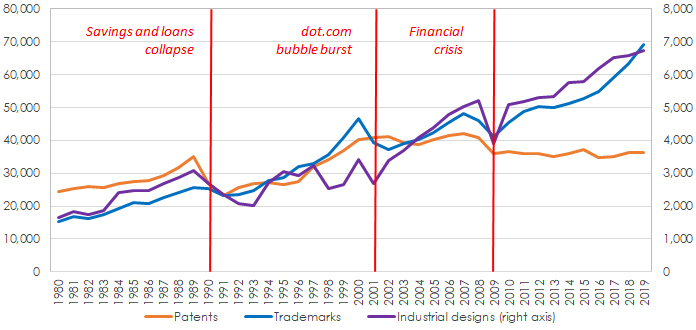
Figure 21 - Text version
Figure 21 consists of a line chart showing IP filings between 1980 and 2019 (patents in orange, trademarks in blue, and industrial designs in purple). The onset of prior economic crises (savings and loans collapse in 1990, the dot.com bubble burst in 2001, and the financial crisis in 2008) are indicated in red.
| Year | Patents | Trademarks | Industrial designs (right axis) |
|---|---|---|---|
| 1980 | 24,347 | 15,249 | 1,666 |
| 1981 | 25,431 | 16,840 | 1,824 |
| 1982 | 25,883 | 16,185 | 1,746 |
| 1983 | 25,707 | 17,405 | 1,858 |
| 1984 | 26,735 | 19,380 | 2,413 |
| 1985 | 27,574 | 21,066 | 2,457 |
| 1986 | 27,757 | 20,704 | 2,462 |
| 1987 | 29,125 | 22,530 | 2,689 |
| 1988 | 31,641 | 24,243 | 2,873 |
| 1989 | 35,091 | 25,541 | 3,083 |
| 1990 | 26,924 | 25,311 | 2,681 |
| 1991 | 23,279 | 23,133 | 2,359 |
| 1992 | 25,757 | 23,605 | 2,085 |
| 1993 | 26,930 | 24,766 | 2,015 |
| 1994 | 27,163 | 27,661 | 2,726 |
| 1995 | 26,592 | 28,760 | 3,036 |
| 1996 | 27,570 | 31,913 | 2,934 |
| 1997 | 31,940 | 32,924 | 3,223 |
| 1998 | 34,155 | 35,644 | 2,536 |
| 1999 | 36,977 | 40,732 | 2,640 |
| 2000 | 40,126 | 46,524 | 3,416 |
| 2001 | 40,829 | 39,382 | 2,698 |
| 2002 | 40,984 | 37,041 | 3,393 |
| 2003 | 39,196 | 39,092 | 3,699 |
| 2004 | 38,780 | 40,267 | 4,082 |
| 2005 | 40,330 | 42,256 | 4,397 |
| 2006 | 41,481 | 45,333 | 4,791 |
| 2007 | 42,127 | 48,059 | 5,017 |
| 2008 | 40,721 | 45,876 | 5,204 |
| 2009 | 35,931 | 41,181 | 3,910 |
| 2010 | 36,499 | 45,488 | 5,068 |
| 2011 | 36,031 | 48,712 | 5,182 |
| 2012 | 35,833 | 50,357 | 5,286 |
| 2013 | 35,180 | 50,011 | 5,314 |
| 2014 | 35,893 | 51,256 | 5,742 |
| 2015 | 37,133 | 52,606 | 5,789 |
| 2016 | 34,778 | 54,804 | 6,180 |
| 2017 | 35,020 | 59,072 | 6,522 |
| 2018 | 36,208 | 63,197 | 6,580 |
| 2019 | 36,195 | 69,032 | 6,713 |
Forecasting IP Activity
IP forecasts are generated by shocking future values in the GDP series using a set of GDP forecasts made by leading economic institutions.Endnotes 20 Figure 22 uses a boxplot to describe how the GDP outlook for the year 2020 evolved and varied over the course of the year. The crosses in the boxes indicate the average forecasts, while the whiskers denote minimum and maximum values. The figure shows how the consensus outlook for 2020 drastically decreased in April and May, once the forecasters entered the impact of the pandemic in their models. Moreover, the whiskers become more distanced in those two months, indicating a high variance amongst forecasters. Beginning in June the variance amongst the forecasters reduced reflecting a higher agreement around the potential impact of the pandemic on the economy, and also because as one approaches the end of the year, the forecast proportion becomes smaller while the historical component increases.
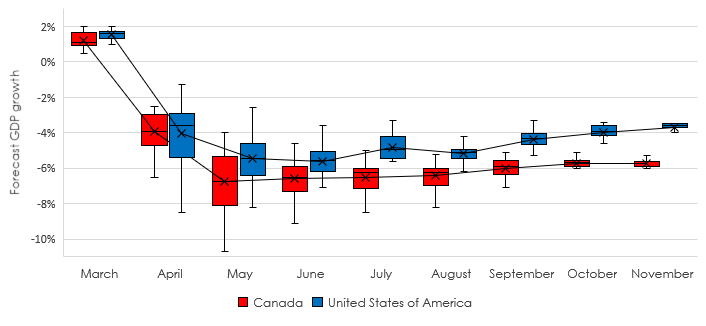
Figure 22 - Text version
Figure 22 consists of a Box and Whiskers chart showing how the forecast for the economic growth in 2020 for Canada (red) and the US (blue) varied over the year 2020. Each box has a cross denoting the mean GDP forecast, and whiskers which length represents volatility. Black lines connect all the crosses to indicate the variation of the GDP forecast from assessment to assessment.
| Month | Canada | United States of America |
|---|---|---|
| March | 0.5% | 1.6% |
| March | 0.7% | 1.8% |
| March | 1.0% | 1.0% |
| March | 1.8% | 1.3% |
| March | 1.8% | 2.0% |
| March | 1.2% | 1.7% |
| March | 1.8% | 1.6% |
| March | 1.1% | 1.7% |
| March | 0.9% | 1.7% |
| March | 1.2% | 1.7% |
| March | 1.5% | 1.5% |
| March | 1.0% | 1.4% |
| March | 0.5% | 1.2% |
| March | 1.5% | 1.7% |
| March | 0.9% | 1.4% |
| March | 1.0% | 1.8% |
| March | 1.1% | 1.3% |
| March | 1.8% | 1.9% |
| March | 1.0% | 1.3% |
| March | 1.2% | 1.7% |
| March | 2.0% | 1.2% |
| March | - | 1.7% |
| March | - | 1.1% |
| March | - | 1.4% |
| April | -3.0% | -6.0% |
| April | -5.3% | -3.4% |
| April | -3.9% | -4.0% |
| April | -4.6% | -3.3% |
| April | -2.9% | -2.9% |
| April | -3.2% | -2.1% |
| April | -3.0% | -3.6% |
| April | -5.5% | -2.9% |
| April | -2.9% | -5.7% |
| April | -3.9% | -6.5% |
| April | -3.3% | -6.2% |
| April | -2.8% | -5.4% |
| April | -4.8% | -3.7% |
| April | -6.5% | -5.3% |
| April | -2.5% | -2.2% |
| April | -4.1% | -4.6% |
| April | -4.2% | -4.1% |
| April | - | -2.7% |
| April | - | -8.5% |
| April | - | -1.3% |
| April | - | -3.0% |
| April | - | -2.8% |
| April | - | -3.0% |
| May | -6.0% | -3.3% |
| May | -8.4% | -5.0% |
| May | -6.9% | -6.2% |
| May | -4.0% | -2.6% |
| May | -4.6% | -3.4% |
| May | -6.4% | -4.7% |
| May | -4.3% | -3.5% |
| May | -6.0% | -5.9% |
| May | -8.3% | -5.5% |
| May | -6.6% | -6.0% |
| May | -7.2% | -8.2% |
| May | -9.0% | -7.3% |
| May | -4.6% | -5.2% |
| May | -7.1% | -6.4% |
| May | -10.7% | -5.7% |
| May | -7.1% | -7.0% |
| May | -9.1% | -7.0% |
| May | -5.1% | -4.9% |
| May | -7.6% | -6.9% |
| May | -6.5% | -5.4% |
| May | - | -5.2% |
| May | - | -6.4% |
| May | - | -4.0% |
| May | - | -4.6% |
| June | -6.0% | -5.2% |
| June | -7.0% | -5.5% |
| June | -4.8% | -6.1% |
| June | -4.6% | -3.3% |
| June | -5.9% | -3.6% |
| June | -5.1% | -4.7% |
| June | -6.0% | -3.8% |
| June | -7.8% | -5.6% |
| June | -6.4% | -7.1% |
| June | -7.2% | -5.9% |
| June | -8.7% | -9.5% |
| June | -8.4% | -5.2% |
| June | -7.1% | -8.1% |
| June | -9.1% | -5.0% |
| June | -5.9% | -5.6% |
| June | -7.3% | -6.2% |
| June | -5.1% | -6.1% |
| June | -6.5% | -6.4% |
| June | -6.5% | -5.5% |
| June | - | -5.5% |
| June | - | -5.2% |
| June | - | -6.4% |
| June | - | -4.0% |
| June | - | -5.8% |
| July | -6.0% | -4.2% |
| July | -7.1% | -5.3% |
| July | -6.3% | -5.4% |
| July | -8.2% | -5.5% |
| July | -6.2% | -3.3% |
| July | -5.1% | -4.2% |
| July | -6.0% | -4.7% |
| July | -7.0% | -5.3% |
| July | -6.4% | -4.9% |
| July | -5.2% | -5.6% |
| July | -6.2% | -4.6% |
| July | -8.5% | -5.5% |
| July | -7.1% | -4.7% |
| July | -7.2% | -4.2% |
| July | -6.0% | -4.0% |
| July | -7.3% | -5.3% |
| July | -6.2% | -5.5% |
| July | -5.0% | -5.0% |
| August | -6.0% | -5.1% |
| August | -6.3% | -5.0% |
| August | -7.1% | -6.2% |
| August | -6.2% | -3.3% |
| August | -8.2% | -4.3% |
| August | -6.1% | -5.0% |
| August | -5.6% | -5.3% |
| August | -6.0% | -4.2% |
| August | -7.0% | -5.6% |
| August | -6.4% | -5.5% |
| August | -5.2% | -6.5% |
| August | -6.8% | -5.0% |
| August | -7.6% | -5.1% |
| August | -7.1% | -5.3% |
| August | -6.5% | -5.2% |
| August | -6.2% | -4.9% |
| August | -6.6% | -6.8% |
| August | -5.9% | -4.0% |
| August | -5.8% | -5.3% |
| August | -6.0% | -5.1% |
| August | - | -5.2% |
| August | - | -5.0% |
| August | - | -6.4% |
| August | - | -4.9% |
| September | -5.5% | -4.3% |
| September | -6.3% | -5.1% |
| September | -6.2% | -4.5% |
| September | -8.2% | -3.9% |
| September | -5.5% | -3.3% |
| September | -5.8% | -5.2% |
| September | -5.6% | -4.7% |
| September | -6.4% | -4.4% |
| September | -6.2% | -5.3% |
| September | -5.9% | -3.7% |
| September | -6.5% | -4.3% |
| September | -7.1% | -4.7% |
| September | -5.7% | -4.4% |
| September | -5.1% | -3.3% |
| September | -6.0% | -4.0% |
| September | -5.7% | -4.6% |
| September | -5.9% | -4.2% |
| September | -5.1% | -4.3% |
| September | - | -4.5% |
| September | - | -3.7% |
| September | - | -3.9% |
| September | - | -4.1% |
| September | - | -4.1% |
| September | - | -4.1% |
| September | - | -5.0% |
| September | - | -6.4% |
| September | - | -4.6% |
| September | - | -4.2% |
| October | -5.6% | -3.6% |
| October | -5.5% | -4.6% |
| October | -5.6% | -4.0% |
| October | -5.5% | -3.9% |
| October | -6.6% | -3.6% |
| October | -5.8% | -4.6% |
| October | -5.8% | -3.9% |
| October | -5.6% | -5.3% |
| October | -6.0% | -3.6% |
| October | -6.0% | -3.8% |
| October | -5.9% | -4.1% |
| October | -5.6% | -3.9% |
| October | -6.5% | -3.5% |
| October | -5.3% | -4.0% |
| October | -5.9% | -3.6% |
| October | -5.7% | -4.0% |
| October | -5.6% | -4.1% |
| October | -5.1% | -3.5% |
| October | - | -4.3% |
| October | - | -3.8% |
| October | - | -3.4% |
| October | - | -4.0% |
| October | - | -4.2% |
| October | - | -4.5% |
| October | - | -3.8% |
| November | -5.6% | -3.5% |
| November | -5.6% | -3.5% |
| November | -5.6% | -3.7% |
| November | -6.6% | -3.6% |
| November | -5.6% | -3.6% |
| November | -5.8% | -4.2% |
| November | -5.6% | -3.6% |
| November | -6.0% | -4.6% |
| November | -6.0% | -3.5% |
| November | -5.9% | -3.5% |
| November | -5.5% | -3.5% |
| November | -6.0% | -3.6% |
| November | -5.7% | -3.5% |
| November | -5.5% | -3.5% |
| November | -5.6% | -3.5% |
| November | -5.7% | -3.6% |
| November | -5.6% | -3.6% |
| November | -5.3% | -4.1% |
| November | - | -3.6% |
| November | - | -3.7% |
| November | - | -3.6% |
| November | - | -3.6% |
| November | - | -4.0% |
| November | - | -4.1% |
| November | - | -3.6% |
| November | - | -3.5% |
Although the implementation of a consensus-based IP forecast can have numerous benefits, there exists potential drawbacks that should be taken into account. For example, the error from the GDP series translates into the IP forecasts. Thus, in periods where the consensus forecast is more volatile, as shown in the figure above, the IP forecasted values are expected to be less accurate. In these situations, CIPO's approach is to create optimistic and pessimistic scenarios.
Impact of the COVID-19 Pandemic on Patent Renewal Behaviour
As explained previously in the Patent section of this report, a patent gives its owner exclusive rights to their invention. Through a patent, the government grants the right to prevent others from making, using or selling the invention from the filing day to a maximum of 20 years in the case of patents filed in Canada; however, there could be factors that result in patent holders maintaining their patents alive for shorter durations. This section focuses on some of those factors, with an emphasis on the effects resulting from economic crises, while attempting to shed light on the possible consequences of the current COVID-19 pandemic on patenting behaviour.
Understanding the Life of a Patent and its Importance
A patent provides its owner the exclusive rights to their invention; preventing others from making, using or selling the invention from the filing day to a maximum of 20 years. Patent holders are required to pay a fee to maintain their patent. In Canada, these are paid annually, starting on the third anniversary of the filing date of the patent application. These revenues are an important part of the financial health and stability of CIPO. Understanding the financial impact of the COVID-19 pandemic on CIPO is vital to planning its operational activities and ensuring an effective use of resources to deliver timely and quality IP services to clients.
To understand the life of a patent, this section looks at the applicant's entity size, technology area and economic conditions. Figure 23 below depicts the average life of patent using survival analysis methodologies.Endnotes 21 The analysis includes patent applications between 1989 and 2018 that were renewed at least once (i.e. at anniversary 2), meaning that the probability of survival at anniversary two is 100%. At anniversary 3 and later, the decisions to renew a patent is observable. The graph shows that 91% of patents alive at anniversary 2 survived anniversary 3, 82% survived anniversary 4, and so forth to the final opportunity to renew at anniversary 19, with a probability of survival of 12%. By definition, the remaining 12% survived 20 years, the maximum life span of a patent filed in Canada.

Figure 23 - Text version
| Anniversary | Renewal probability |
|---|---|
| 3 | 91% |
| 4 | 91% |
| 4 | 82% |
| 5 | 82% |
| 5 | 71% |
| 6 | 71% |
| 6 | 63% |
| 7 | 63% |
| 7 | 55% |
| 8 | 55% |
| 8 | 49% |
| 9 | 49% |
| 9 | 44% |
| 10 | 44% |
| 10 | 39% |
| 11 | 39% |
| 11 | 35% |
| 12 | 35% |
| 12 | 31% |
| 13 | 31% |
| 13 | 28% |
| 14 | 28% |
| 14 | 25% |
| 15 | 25% |
| 15 | 22% |
| 16 | 22% |
| 16 | 19% |
| 17 | 19% |
| 17 | 17% |
| 18 | 17% |
| 18 | 14% |
| 19 | 14% |
| 19 | 12% |
| 20 | 12% |
The survival function by applicant's entity size is presented in Figure 24. It is clear that patents from large entities have a much higher survival rate than those from small entities. Small entities include firms with up to 50 employees and universities. It is important to note that the maintenance fees for small entities are lower than those for large entities.Endnotes 22
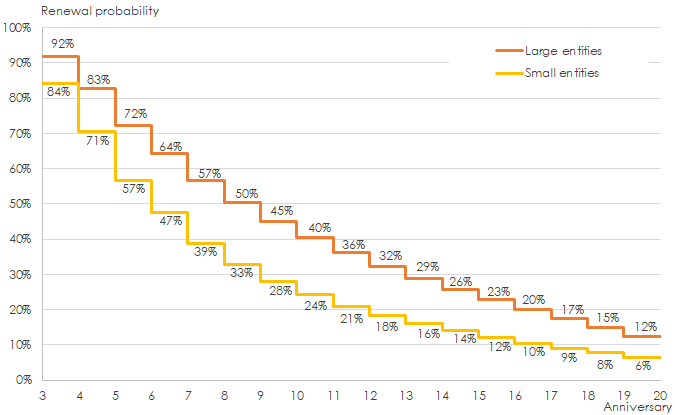
Figure 24 - Text version
| Anniversary | Large entities | Small entities |
|---|---|---|
| 3 | 92% | 84% |
| 4 | 92% | 84% |
| 4 | 83% | 71% |
| 5 | 83% | 71% |
| 5 | 72% | 57% |
| 6 | 72% | 57% |
| 6 | 64% | 47% |
| 7 | 64% | 47% |
| 7 | 57% | 39% |
| 8 | 57% | 39% |
| 8 | 50% | 33% |
| 9 | 50% | 33% |
| 9 | 45% | 28% |
| 10 | 45% | 28% |
| 10 | 40% | 24% |
| 11 | 40% | 24% |
| 11 | 36% | 21% |
| 12 | 36% | 21% |
| 12 | 32% | 18% |
| 13 | 32% | 18% |
| 13 | 29% | 16% |
| 14 | 29% | 16% |
| 14 | 26% | 14% |
| 15 | 26% | 14% |
| 15 | 23% | 12% |
| 16 | 23% | 12% |
| 16 | 20% | 10% |
| 17 | 20% | 10% |
| 17 | 17% | 9% |
| 18 | 17% | 9% |
| 18 | 15% | 8% |
| 19 | 15% | 8% |
| 19 | 12% | 6% |
| 20 | 12% | 6% |
Figure 25 presents the survival rates at CIPO by technology group. These technology groupings are based on how patents are distributed to patent examiners and are defined by the science in the invention and not the industry that either the firm or resulting product will be associated with. It should be noted that there is much less variation amongst technology groups when compared to the difference in survival rates between large and small entities.
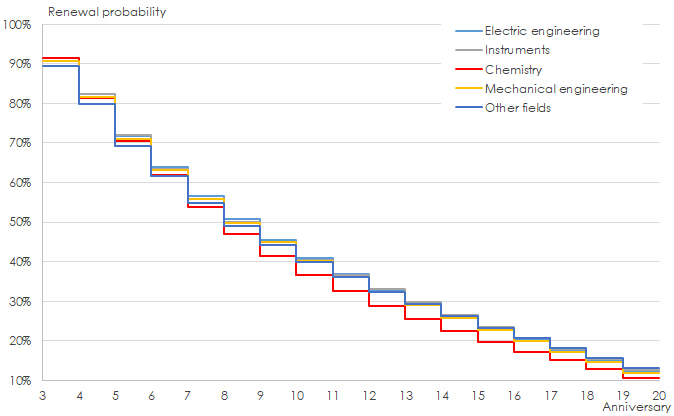
Figure 25 - Text version
| Anniversary | Chemistry | Electric engineering | Instruments | Mechanical engineering | Other fields |
|---|---|---|---|---|---|
| 3 | 91% | 91% | 92% | 91% | 89% |
| 4 | 91% | 91% | 92% | 91% | 89% |
| 4 | 81% | 82% | 82% | 82% | 80% |
| 5 | 81% | 82% | 82% | 82% | 80% |
| 5 | 71% | 72% | 72% | 71% | 69% |
| 6 | 71% | 72% | 72% | 71% | 69% |
| 6 | 62% | 64% | 63% | 63% | 62% |
| 7 | 62% | 64% | 63% | 63% | 62% |
| 7 | 54% | 57% | 56% | 56% | 55% |
| 8 | 54% | 57% | 56% | 56% | 55% |
| 8 | 47% | 51% | 50% | 50% | 49% |
| 9 | 47% | 51% | 50% | 50% | 49% |
| 9 | 42% | 46% | 45% | 45% | 44% |
| 10 | 42% | 46% | 45% | 45% | 44% |
| 10 | 37% | 41% | 41% | 40% | 40% |
| 11 | 37% | 41% | 41% | 40% | 40% |
| 11 | 33% | 37% | 37% | 36% | 36% |
| 12 | 33% | 37% | 37% | 36% | 36% |
| 12 | 29% | 33% | 33% | 32% | 32% |
| 13 | 29% | 33% | 33% | 32% | 32% |
| 13 | 25% | 30% | 30% | 29% | 29% |
| 14 | 25% | 30% | 30% | 29% | 29% |
| 14 | 23% | 26% | 27% | 26% | 26% |
| 15 | 23% | 26% | 27% | 26% | 26% |
| 15 | 20% | 23% | 24% | 23% | 23% |
| 16 | 20% | 23% | 24% | 23% | 23% |
| 16 | 17% | 20% | 21% | 20% | 21% |
| 17 | 17% | 20% | 21% | 20% | 21% |
| 17 | 15% | 18% | 18% | 17% | 18% |
| 18 | 15% | 18% | 18% | 17% | 18% |
| 18 | 13% | 15% | 15% | 15% | 16% |
| 19 | 13% | 15% | 15% | 15% | 16% |
| 19 | 11% | 12% | 13% | 12% | 13% |
| 20 | 11% | 12% | 13% | 12% | 13% |
The beginning of the COVID-19 pandemic raised many questions among IP offices about its impact on IP activity. Specifically, could the economic crisis resulting from the pandemic affect the probability of patents being abandoned? To answer this question an analysis was conducted of the survival rates during previous economic recessions, paying special attention to the 2008-2009 financial crisis. Data for those years suggests that the survival rates were lower than in non-recession years, as depicted in Figure 26. Using this information, it is possible to model patent survival rates at CIPO for the current fiscal year, 2020-21.
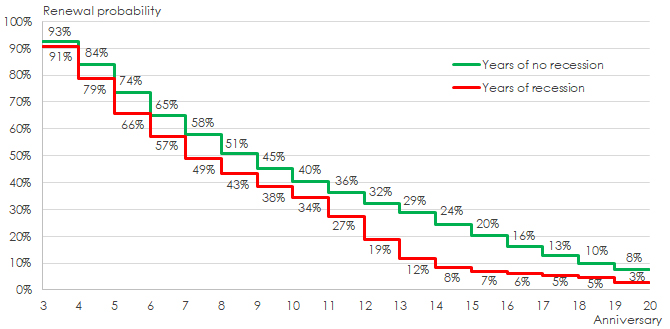
Figure 26 - Text version
| Anniversary | Years of no recession | Years of recession |
|---|---|---|
| 3 | 93% | 91% |
| 4 | 93% | 91% |
| 4 | 84% | 79% |
| 5 | 84% | 79% |
| 5 | 74% | 66% |
| 6 | 74% | 66% |
| 6 | 65% | 57% |
| 7 | 65% | 57% |
| 7 | 58% | 49% |
| 8 | 58% | 49% |
| 8 | 51% | 43% |
| 9 | 51% | 43% |
| 9 | 45% | 38% |
| 10 | 45% | 38% |
| 10 | 40% | 34% |
| 11 | 40% | 34% |
| 11 | 36% | 27% |
| 12 | 36% | 27% |
| 12 | 32% | 19% |
| 13 | 32% | 19% |
| 13 | 29% | 12% |
| 14 | 29% | 12% |
| 14 | 24% | 8% |
| 15 | 24% | 8% |
| 15 | 20% | 7% |
| 16 | 20% | 7% |
| 16 | 16% | 6% |
| 17 | 16% | 6% |
| 17 | 13% | 5% |
| 18 | 13% | 5% |
| 18 | 10% | 5% |
| 19 | 10% | 5% |
| 19 | 8% | 3% |
| 20 | 8% | 3% |
The main objective of this research was to better understand patent renewal behaviour in order to estimate the effect of the COVID-19 pandemic on patent renewals. There are many different factors affecting the lifespan of a patent. This section provided a view on three important factors: entity size, technology area and economic conditions. Future work could integrate the findings from previous studies that examined the relationship between the life of a patent and the number of citations,Endnotes 23 complexity,Endnotes 24 and value.Endnotes 25 Understanding all these factors will allow us to better estimate future revenues from patent renewals in Canada, both in normal economic times and during periods of economic uncertainty.
Patenting to Fight Pandemics: the Canadian Story
This section of the IP Canada Report 2020 highlights several findings from an upcoming IP Analytics study on the innovation undertaken by Canadian institutions during prior coronavirus outbreaks such as Severe Acute Respiratory Syndrome (SARS) and Middle East Respiratory Syndrome (MERS). The search strategy for this study has been developed in partnership with the National Research Council (NRC). As part of the efforts to mitigate the effect of the pandemic's detriments, NRC has established three programs. One of them is the Pandemic Response Challenge Program, put in motion to accelerate the development of diagnostics and medical countermeasures for a rapid front-line response. The structure of this program centers around three research areas: Therapeutics and Vaccine Development, Rapid Detection and Diagnosis, and Digital Health.
The IP Analytics study investigates patenting activity in the research areas related to the Pandemic Response Challenge Program. Using a thorough patent search strategy, more than 11,000 patented inventions were identified between 1999 and 2018. Of these, 178 were associated with Canadian institutions.
The patent filing trend for international and Canadian institutions across the three research areas between 1999 and 2018 is shown in Figure 27. Globally there has been steady growth in all three research areas during the time period of the study. Of particular interest is the surge in inventions patented related to Therapeutics and Vaccine Development between 2002 and 2004, during which the SARS outbreak was a top health concern for many countries.
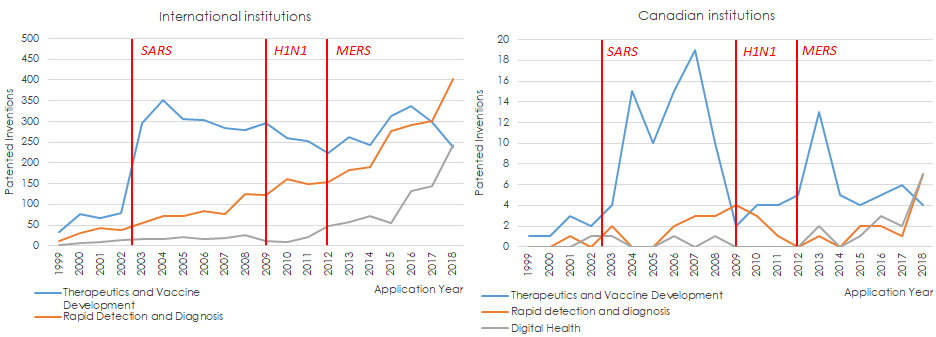
Figure 27 - Text version
Figure 27 consists of a line chart showing the patent filling trend for three research areas (Therapeutic and Vaccine Developmemt in blue, Rapid detection and diagnosis in orange, and digital health in gray). The onset of prior outbreaks (SARS in 2002, H1N1 in 2009, and MERS in 2012) is indicated in red.
| Research Area (international institutions) | 1999 | 2000 | 2001 | 2002 | 2003 | 2004 | 2005 | 2006 | 2007 | 2008 | 2009 | 2010 | 2011 | 2012 | 2013 | 2014 | 2015 | 2016 | 2017 | 2018 |
|---|---|---|---|---|---|---|---|---|---|---|---|---|---|---|---|---|---|---|---|---|
| Therapeutics and Vaccine Development | 32 | 76 | 67 | 80 | 296 | 352 | 307 | 304 | 284 | 280 | 297 | 259 | 253 | 224 | 263 | 242 | 313 | 337 | 299 | 239 |
| Rapid Detection and Diagnosis | 12 | 30 | 44 | 38 | 55 | 71 | 72 | 85 | 76 | 124 | 122 | 160 | 149 | 154 | 182 | 189 | 278 | 292 | 301 | 403 |
| Digital Health | 1 | 7 | 9 | 14 | 16 | 16 | 21 | 17 | 18 | 25 | 12 | 9 | 22 | 48 | 58 | 71 | 56 | 131 | 144 | 244 |
| Research Area (Canadian institutions) | 1999 | 2000 | 2001 | 2002 | 2003 | 2004 | 2005 | 2006 | 2007 | 2008 | 2009 | 2010 | 2011 | 2012 | 2013 | 2014 | 2015 | 2016 | 2017 | 2018 |
|---|---|---|---|---|---|---|---|---|---|---|---|---|---|---|---|---|---|---|---|---|
| Therapeutics and Vaccine Development | 1 | 1 | 3 | 2 | 4 | 15 | 10 | 15 | 19 | 10 | 2 | 4 | 4 | 5 | 13 | 5 | 4 | 5 | 6 | 4 |
| Rapid detection and diagnosis | 0 | 0 | 1 | 0 | 2 | 0 | 0 | 2 | 3 | 3 | 4 | 3 | 1 | 0 | 1 | 0 | 2 | 2 | 1 | 7 |
| Digital Health | 0 | 0 | 0 | 1 | 1 | 0 | 0 | 1 | 0 | 1 | 0 | 0 | 0 | 0 | 2 | 0 | 1 | 3 | 2 | 7 |
The trend in growth experienced by select leading countries for pandemic-fighting technologies between 1999 and 2018 is highlighted in Figure 28. With an average annual growth of 8% between 2009 and 2018, Canada is on par with leading economies such as Germany and Japan. Note that the patent filing trends for the United States and China are excluded from this figure since the level of activity significantly surpasses that of the selected countries and would make it difficult to observe the difference among those countries due to the difference in scale. Patented inventions by American institutions following the peak experienced during SARS in 2004 grew 30% over the 15-year period that followed, reaching close to 200 patented inventions. Chinese institutions have made notable headway over the past decade, with an average annual growth rate of 26%, reaching almost 500 patented inventions in 2018.
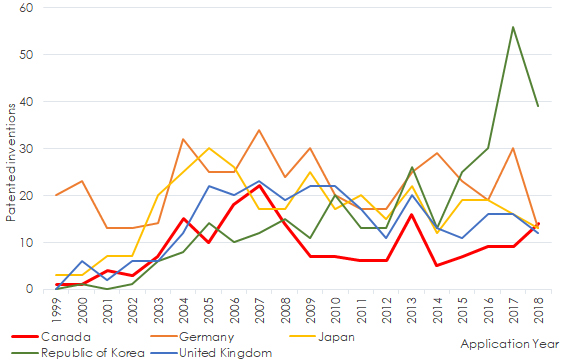
Figure 28 - Text version
| Application Year | Germany | Republic of Korea | Japan | United Kingdom | Canada |
|---|---|---|---|---|---|
| 1999 | 20 | - | 3 | - | 1 |
| 2000 | 23 | 1 | 3 | 6 | 1 |
| 2001 | 13 | - | 7 | 2 | 4 |
| 2002 | 13 | 1 | 7 | 6 | 3 |
| 2003 | 14 | 6 | 20 | 6 | 7 |
| 2004 | 32 | 8 | 25 | 12 | 15 |
| 2005 | 25 | 14 | 30 | 22 | 10 |
| 2006 | 25 | 10 | 26 | 20 | 18 |
| 2007 | 34 | 12 | 17 | 23 | 22 |
| 2008 | 24 | 15 | 17 | 19 | 14 |
| 2009 | 30 | 11 | 25 | 22 | 7 |
| 2010 | 20 | 20 | 17 | 22 | 7 |
| 2011 | 17 | 13 | 20 | 17 | 6 |
| 2012 | 17 | 13 | 15 | 11 | 6 |
| 2013 | 25 | 26 | 22 | 20 | 16 |
| 2014 | 29 | 13 | 12 | 13 | 5 |
| 2015 | 23 | 25 | 19 | 11 | 7 |
| 2016 | 19 | 30 | 19 | 16 | 9 |
| 2017 | 30 | 56 | 16 | 16 | 9 |
| 2018 | 13 | 39 | 13 | 12 | 14 |
The degree of relative specialization of Canadian institutions in pandemic-fighting technologies is shown in Figure 29, and is compared to institutions from other leading innovative economies. This comparison is made using the Relative Specialization Index (RSI), where an RSI of greater than 0 indicates a high level of specialization, while the opposite is true for values less than 0. The key takeaway is that Canadian institutions have one of the highest RSI values, thereby indicating a specialization in this field.
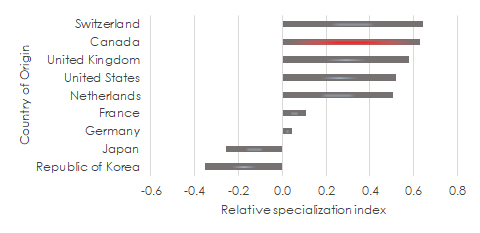
Figure 29 - Text version
| Country of Origin | RSI |
|---|---|
| Republic of Korea | -0.4 |
| Japan | -0.3 |
| Germany | 0.0 |
| France | 0.1 |
| Netherlands | 0.5 |
| United States | 0.5 |
| United Kingdom | 0.6 |
| Canada | 0.6 |
| Switzerland | 0.6 |
Figure 30 is a patent landscape map that provides a visual representation of the Canadian patent activity described in this report. Derwent Innovation's ThemeScape mapping tool was utilized to produce this visualization, using the frequency of keywords from a patents title and abstract and other algorithms to cluster patents based on shared language. The result is a patent landscape map, which resembles a typical topographic map. Sections are comprised of peaks, some of which have bright white peaks, representing the highest concentration of patents and are labelled with key terms that tie common themes together. Turquoise is used to separate terms where there is no commonality between them. Areas pertaining to Digital Health are highlighted in red, areas pertaining to Rapid Detection and Diagnosis are highlighted in purple and regions pertaining to Therapeutics and Vaccine Development are highlighted in yellow. Canada's strength in Therapeutics and Vaccine Development is clear as it takes up almost two-thirds of the map. In addition, most of these areas are related to chemical compositions of vaccines which could indicate that Canadian institutions are specialized in the development of vaccines.
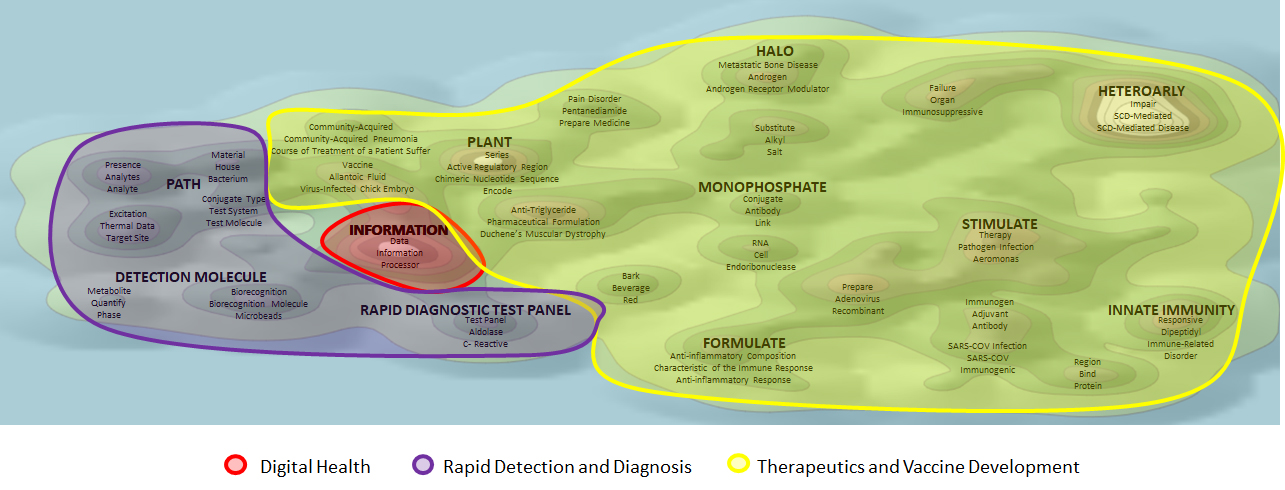
Figure 30 - Text version
Figure 30 is a patent landscape map that provides a visual representation of Canadian patent activities in data set in this report. Derwent Innovation's ThemeScape mapping tool was utilized to produce this visualization, using term frequency (keywords from a patents title and abstract) and other algorithms to cluster documents based on shared language. The result is a patent landscape map, a map very much resembling that of a topographic map, where there are sections of turquoise and white. Areas pertaining to Digital Health are highlighted in red, areas pertaining to Rapid Detection and Diagnosis are highlighted in purple and regions pertaining to Therapeutics and Vaccine Development are highlighted in yellow. Sections are comprised of peaks, some of which have bright white peaks, representing the highest concentration of patents and are labelled with key terms that tie common themes together. Turquoise is used to separate terms where there is no commonality between them. The legend provides more details on the top inventors and key words as described in the report.
Broad themes written in all capital letters include:
- Halo
- Heteroaryl
- Plant
- Path
- Information
- Monophosphate
- Stimulate
- Innate immunity
- Formulate
- Rapid diagnostic test panel
- Detection molecule
Common key words in this graph include:
- Metastatic bone disease
- Androgen
- Androgen receptor modulator
- Pain disorder
- Pentanediamide
- Prepare medicine
- Failure
- Organ
- Immunosuppressive
- Impair
- Scd-mediated
- Scd-mediated disease
- Community-acquired
- Community-acquired pneumonia
- Course of treatment of a patient suffer
- Vaccine
- Allantoic fluid
- Virus-infected chick embryo
- Series
- Active regulatory region
- Chimeric nucleotide sequence encode
- Material
- House
- Bacterium
- Presence
- Analytes
- Analyte
- Excitation
- Thermal data
- Target site
- Conjugate type
- Test system
- Test molecule
- Data
- Information
- Processor
- Anti-triglyceride
- Pharmaceutical formulation
- Duchene's muscular dystrophy
- Conjugate
- Antibody
- Link
- RNA
- Cell
- Endoribonuclease
- Therapy
- Pathogen infection
- Aeromonas
- Responsive
- Dipeptidyl
- Immune-related disorder
- Region
- Bind
- Protein
- Immunogen
- Adjuvant
- Antibody
- SARS-COV infection
- SARS-COV
- Immunogenic
- Prepare
- Adenovirus
- Recombinant
- Anti-inflammatory composition
- Characteristic of the immune response
- Anti-Inflammatory response
- Bark
- Beverage
- Red
- Test panel
- Aldolase
- C-reactive
- Biorecognition
- Biorecognition molecule
- Microbeads
- Metabolite
- Quantify
- Phase
Collaborations identified in the dataset involving at least one Canadian institution are presented in Figure 31. Each yellow node represents a patented invention where two or more institutions have been linked together if as joint applicants. It is encouraging to see institutions collaborating in this field as this increases the likelihood of earlier and more innovative solutions to overcome the current pandemic.
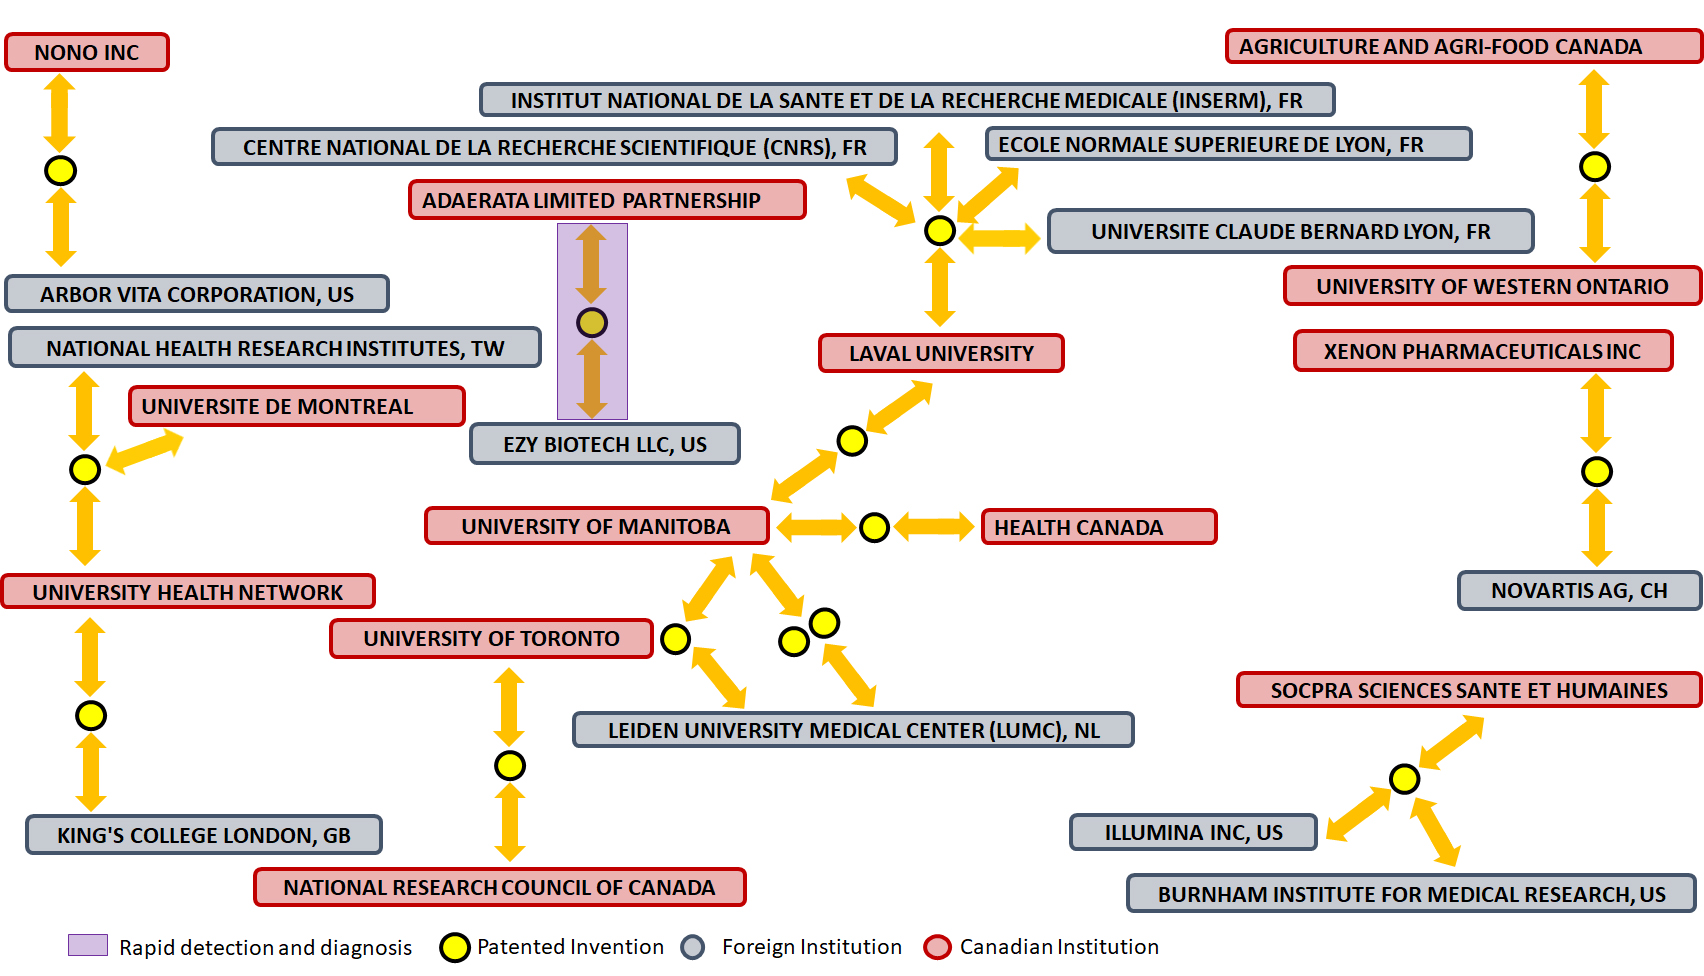
Figure 31 - Text version
Figure 31 shows the collaborations that have been identified using the patent data from Derwent Innovation. Each node indicates a patented invention and the vertices connected to them represent institutions that have been identified as joint applicants for the patented inventions. The figures presents the following information:
- Canadian institution: Nono Inc.; and foreign institution: Arbor Vita Corporation collaborated on 1 patented invention
- Canadian institutions: Universite de Montreal, University Health Network; and foreign institution: National Health Research Institutes collaborated on 1 patented invention
- Canadian institution: University Health Network; and foreign institution: King's College London collaborated on 1 patented invention
- Canadian institution: Adaerata Limited Partnership; and foreign institution: Ezy Biotech LLC collaborated on 1 patented invention
- Canadian institutions: University Of Toronto and National Research Council Of Canada collaborated on 1 patented invention
- Canadian institution: Laval University; and foreign institutions: Centre National de la Recherche Scientifique, Institut National de la Sante et de la Recherche Medicale, Ecole Normale Superieure de Lyon, Universite Claude Bernard Lyon collaborated on 1 patented invention
- Canadian institutions: Laval University and University of Manitoba collaborated on 1 patented invention
- Canadian institutions: Health Canada and University of Manitoba collaborated on 1 patented invention
- Canadian institution: University of Manitoba; and foreign institution: Leiden University Medical Center collaborated on 2 patented inventions
- Canadian institutions: University of Toronto, University of Manitoba; and foreign institution: Leiden University Medical Center collaborated on 1 patented invention
- Canadian institutions: Agriculture and Agri-Food Canada and University of Western Ontario collaborated on 1 patented invention
- Canadian institution: Xenon Pharmaceuticals Inc.; and foreign institution: Novartis AG collaborated on 1 patented invention
- Canadian institution: SOCPRA Sciences Sante et Humaines; and foreign institutions: Illumina Inc., Burnham Institute for Medical Research collaborated on 1 patented invention
The results shown above are highlights from the analysis conducted and for a more comprehensive view of the innovation undertaken by Canadian institutions in this field, a full report will be published in 2021 but, until that time, a summary captured in a blog titled Patenting to Fight Pandemics: the Canadian Story can be found on CIPO's website.Endnotes 26 In addition to this study, CIPO has undertaken a new research project that will explore the role that both IP and other important firm level attributes played in an organization's ability to pivot and retool to support the fight against COVID-19. As the COVID-19 pandemic has had a significant worldwide impact on business and industrial operations, it has provided an opportunity to undertake new and important research investigating organizations that have changed their line of business or added a new one. Based on the findings from this research, CIPO will be publishing an IP Analytics report that will highlight Canadian organizations that pivoted and the factors that played a key role in their ability to pivot successfully.
Conclusion
The 2020 edition of the IP Canada Report explores trends in IP usage in Canada and abroad by Canadians. Patent activity in Canada by resident applicants exhibited a downward trend, decreasing by 3% since last year and 7% in the last decade; however, non-resident filings have shown positive growth during the same time period, increasing by 1% and 4% respectively. While resident filings for industrial design in Canada and abroad have been relatively static since 2010, non-resident applications have grown by 33%, contributing to a 24% growth in total filings over the last decade. Finally, steady growth in trademark filings continued in 2019, with a 51% increase in filings at CIPO since 2010 and a spectacular 139% increase in filings abroad by Canadians since 2009.
This year's report also featured research on IP activity in the agriculture sector. The move to UPOV'91 was followed by a significant increase in applications at PBRO, for both vegetable and fruit varieties and foreign agriculture varieties. This signals an improvement in IP protection in the agriculture sector and the competitiveness of Canadian farmers in the global marketplace, highlighting the important consequences of amending the Plant Breeders' Rights Act.
A unique feature of this report is the inclusion of research on the impact and implications of the COVID-19 pandemic. What was found was that due to the once in a generation nature of the pandemic IP filing forecasting will has been more challenging than in the past. The recent accession to the Madrid Protocol and the Hague Agreement was expected to bring an increase in trademark and industrial design filings and it is hard to know the size and timing of these effects when they occur concurrently with a major economic event. Further analysis showed that the pandemic is expected to increase patent abandonment rates, with a higher impact on patents going through their third to sixth anniversaries. Canadian institutions exhibit a high degree of specialization in pandemic-fighting technologies, in comparison to international institutions, and Canada ranks on par with leading economies in the growth of pandemic-fighting technologies between 1999 and 2018.
These findings have several implications on Canadian businesses and inventors. They highlight the drastic changes in Canadian IP activity that may accompany the COVID-19 pandemic. They also demonstrate Canada's preparedness and ability to address the possible consequences of these crises. Through the implementation of several IP international agreements in recent years, Canada has demonstrated its dedication to encouraging Canadian participation in international markets, as well as international involvement in the Canadian market. The creativity of businesses, both at home and globally, will play an important role in managing the ramifications of the COVID-19 pandemic and ensuring resilience in the Canadian economy.
Appendix A
CIPO administers IP rights in Canada, including patents, trademarks, industrial designs, copyrights, geographical indicators and integrated circuit topographies. This report focuses on the first three of these IP rights. Each type of IP protection is designed for different circumstances. The fees applied by CIPO change yearly. For an updated list of fees and payment forms, pleas refer to the following link:
http://www.ic.gc.ca/eic/site/cipointernet-internetopic.nsf/eng/h_wr00023.html
Patents
Patents provide a time-limited, legally protected, exclusive right to make, use and sell an invention. In this way, patents serve as a reward for ingenuity. Patents apply to newly developed technology, as well as to improvements on products or processes.
Patent protection applies in the country or region that issues the patent. In Canada, a patent lasts for 20 years from the date that it is filed. Patents can have a great deal of value. They can be sold, licensed or used as assets to attract funding from investors.Endnotes 27
In exchange for these benefits, a full description of the invention must be provided when filing a patent. This helps enrich technical knowledge worldwide. Details of patent applications filed in Canada are disclosed to the public after an 18‑month period of confidentiality.
To be eligible for patent protection, an invention must be: new (first in the world), useful (functional and operative), and inventive (showing ingenuity and not obvious to someone of average skill who works in the field of the invention). The invention can be: a product (e.g. door lock); a composition (e.g. chemical composition used in lubricants for door locks); a machine (e.g. for making door locks); a process (e.g. a method for making door locks); an improvement on any of these.
In Canada, the first applicant to file a patent application is entitled to obtain the patent. The patent should be filed as soon as possible after an invention is completed in case someone else is on a similar track.
Any public disclosure of an invention before filing may make it impossible to obtain a patent. There is an exception in Canada and the United States if the public disclosure was made by the inventor or by someone who learned of the invention from the inventor less than one year before filing the patent application. Please be aware that in some countries disclosing the invention to the public anywhere in the world before filing a patent application may, in many circumstances, prevent the inventor from obtaining a patent.Endnotes 28
For applications using the PCT, please see https://www.wipo.int/pct/en/.
Trademarks
Trademarks can be one or many words, designs, tastes, textures, moving images, mode of packaging, holograms, sounds, scents, three-dimensional shapes, colours, or a combination of these used to distinguish the goods or services of one person or organization from those of others. Over time, trademarks stand for not only the actual goods or service a person or company makes, but also the reputation of the producer. Trademarks are very valuable IP.Endnotes 29 For example, suppose you started a courier business that you chose to call Giddy-up. You could register these words as a trademark (if you met all the legal requirements) for the service that you offer.
A certification mark, a type of trademark, can be licensed to many people or companies for the purpose of showing that certain goods or services meet a defined standard. For example, the Woolmark design, owned by Woolmark Americas Ltd., is used on clothing and other goods.
For applications using the Madrid Protocol, please see:
http://www.ic.gc.ca/eic/site/cipointernet-internetopic.nsf/eng/wr04619.html
Industrial Designs
Industrial design is about how something looks. It protects the visual features of shape, configuration, pattern or ornament, or any combination of these features applied to a finished article. In other words, it protects the appearance of an article. For example, industrial designs can be found in many everyday products, such as the unique contour of a car hood, the graphical user interface on a phone or the specific shape or pattern of your favourite shoes.Endnotes 30 If you want to register an industrial design, it has to be novel. Registering your industrial design will provide you with an exclusive right to your design for up to 15 years after you register.
You may file for registration through CIPO or through the Hague System. If you choose to file an application through CIPO you may protect your design only in Canada. If you choose to file an application through the Hague System, you may protect your design in multiple countries at the same time, including in Canada. For more information on the how to apply for registration, please see the Industrial Designs Guide.Endnotes 31
Appendix B
Interpreting Patent Data
Patent data is a good starting point for analysis of the development of new technologies as it provides important information on the specific innovation in the invention and who the inventors and applicant are. Like any data source, patent data has its strengths and weaknesses, and if used in the wrong way, it can lead to erroneous conclusions and poor policy. The following provides context on the use of patents in understanding innovation.
While patents measure the flow of new ideas, it has been argued that patents may not measure innovation for three important reasons: patents do not include non-patented innovations, not all patents result in commercialization, and many patents are strategic in nature.Endnotes 32 For this reason, the analysis is based on patent families that include applications in at least two jurisdictions. This makes it more likely that these patent families will be a higher-valued invention and that the firm expects to commercialize the invention.Endnotes 33
Another challenge presented is that many innovations or inventions remain hidden as trade secrets. These innovations will be missed in a measure that includes only patents. However, a 2008 study indicates that world-first innovators patent more frequently. Conversely, firms that patent infrequently tend to be imitators.Endnotes 34 In addition, the study finds that firms that protect their IP are more likely to increase their profits than those that do not. Moreover, SMEs that patent are more likely to be high-growth firms, which is important for success.Endnotes 35 These conclusions are reinforced by a Canadian study that noted that firms that are aggressive innovators, introducing radically new products that involve patent protection, have higher profits.Endnotes 36 Finally, while some inventions are not patented, patents are obtained for almost all economically significant inventions.Endnotes 37
Below are the primary ways to view or interpret patent data:
Market Reach
Patent filings in foreign markets are a good indicator of firms accessing those markets. Surveys have shown that firms that hold patents are more likely to be exporters.Endnotes 38
Innovative Activity
When we do not account for filings in multiple jurisdictions, we are double and triple counting the number of patented inventions or innovative activities. In order to address this, patent data allows for the formation of patent families whereby each family includes all related or similar patents in all jurisdictions.
Scientific Strength
It is possible to identify the researchers or scientists, rather than the company or applicant. While these can be the same, they are often different. In this way, we can see the inventive activity of Canadian researchers working in other countries or for non-Canadian companies.
Relative Advantage
Canada is a small open economy. For this reason, it is unlikely that our industries or innovators would have an absolute advantage in a particular area, be the most prolific IP users, or have the largest global market share. However, there are areas where we have a comparative or relative advantage. Much work has been done in the creation of metrics of relative technological advantage and relative specialization.