
On this page
- Canadian Trend for Patented Inventions
- Relative Specialization of Canadian Institutions
- Patent Concentration among Canadian Institutions
- Collaboration among Institutions
- Regional Clusters of Patent Activity
- Leading Canadian Institutions
- Canadian Patent Landscape
Analysis from a Canadian Perspective
This section provides a snapshot of the innovative efforts undertaken by Canadian institutions on a global scale for pandemic mitigation technologies between the application years 1999 and 2018. The 178 patented inventions considered to present this snapshot were assigned to at least one Canadian institution. Not only does this section showcase the growth in patenting inventions, but it highlights Canadian geographical clusters having a high patenting intensity and benchmarks Canadian institutions against their international counterparts.
Canadian Trend for Patented Inventions
Figure 11 shows the global trend for patented inventions by Canadian institutions between application years 1999 and 2018 where patented inventions grew annually by 15% on average. This growth is almost on par with the growth experienced by institutions worldwide during this timeframe. The figure also shows an increase in patent activity after the onset of the SARS outbreak in 2002. This upward trend continued until 2007 during which patent activity by Canadian institutions grew annually by 49% in comparison to the 23% experienced by institutions worldwide. The second uptick in patented inventions observed follows the MERS outbreak in 2012.
Figure 11: Patent activity by Canadian institutions for pandemic mitigation technologies between 1999 and 2018Footnote vi

Description of figure 11
| Application Year | CIPO | Intellectual Property India | United States Patent and Trademark Office | Intellectual Property Office of Singapore | Other IP Offices |
|---|---|---|---|---|---|
| 1999 | 1 | 0 | 0 | 0 | 0 |
| 2000 | 0 | 0 | 0 | 0 | 1 |
| 2001 | 3 | 0 | 0 | 0 | 1 |
| 2002 | 1 | 0 | 1 | 0 | 1 |
| 2003 | 4 | 0 | 2 | 0 | 1 |
| 2004 | 11 | 0 | 3 | 1 | 0 |
| 2005 | 4 | 2 | 2 | 1 | 1 |
| 2006 | 10 | 3 | 3 | 1 | 1 |
| 2007 | 4 | 3 | 1 | 5 | 9 |
| 2008 | 6 | 6 | 0 | 0 | 2 |
| 2009 | 3 | 2 | 0 | 0 | 1 |
| 2010 | 4 | 1 | 0 | 0 | 2 |
| 2011 | 1 | 1 | 0 | 2 | 1 |
| 2012 | 3 | 0 | 0 | 0 | 2 |
| 2013 | 2 | 4 | 3 | 1 | 6 |
| 2014 | 0 | 0 | 2 | 0 | 3 |
| 2015 | 3 | 1 | 0 | 0 | 3 |
| 2016 | 7 | 0 | 0 | 0 | 2 |
| 2017 | 5 | 1 | 0 | 1 | 2 |
| 2018 | 9 | 0 | 2 | 0 | 3 |
Figure 11 also identifies intellectual property offices targeted by Canadian institutions to patent inventions pertaining to pandemic mitigation technologies. Canadian institutions have been filing predominantly at CIPO (46%), Intellectual Property India (13%), United States Patent and Trademark Office (11%) and Intellectual Property Office of Singapore (7%) for this field. Interestingly, almost 39% of these inventions have been administered by the World Intellectual Property Organisation's through the Patent Cooperation Treaty (PCT), which could speak to the global importance of these inventions.
While Canada and the U.S. are prominent filing jurisdictions for Canadian institutions across most technology areas, the presence of India and Singapore may be explained by the specialisation these countries have held in pandemic mitigation technologies. India is a global manufacturing hub for pharmaceuticals, and may therefore be an attractive filing destination for Canadian institutions.Endnote 9 Similarly, Singapore is a regional hub for both pharmaceutical manufacturing and R&D, and may therefore also be a sought-after destination for Canadian institutions patenting in pandemic mitigation technologies.Endnote 10
Relative Specialization of Canadian Institutions
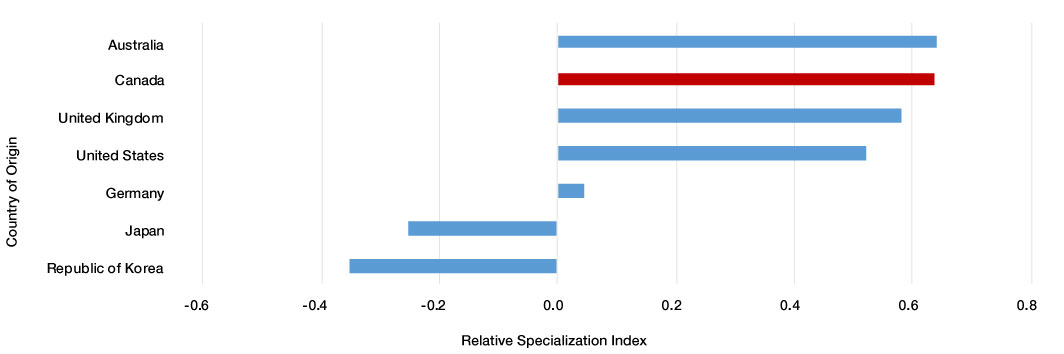
After gaining a better understanding of the jurisdictions targeted by Canadian institutions for pandemic mitigation technologies, the following figure examines the degree of specialization Canadian institutions hold in this field when compared to institutions from other countries using the Relative Specialization Index (RSI). This index uses patenting intensity to allow for institutions originating from countries of different sizes to be compared for a particular technology field on a relative basis (additional details in Annex D). If a country's institutions have an RSI value of greater than 0 for a particular technology field, they are considered to be more specialized in that particular field when compared to all institutions worldwide and vice-versa. Furthermore, a country's institutions having an RSI value of 0 would be considered just as specialized as all institutions combined for a particular technology field. In Figure 12, Canadian institutions have one of the highest RSI values thereby indicating a relatively high specialization for pandemic mitigation technologies.
Figure 12: Relative Specialization Index by institution's country of origin for pandemic mitigation technologies
Description of figure 12
| Country of Origin | Relative Specialization Index |
|---|---|
| Republic of Korea | -0.350 |
| Japan | -0.250 |
| Germany | 0.044 |
| United States | 0.523 |
| United Kingdom | 0.582 |
| Canada | 0.635 |
| Australia | 0.640 |
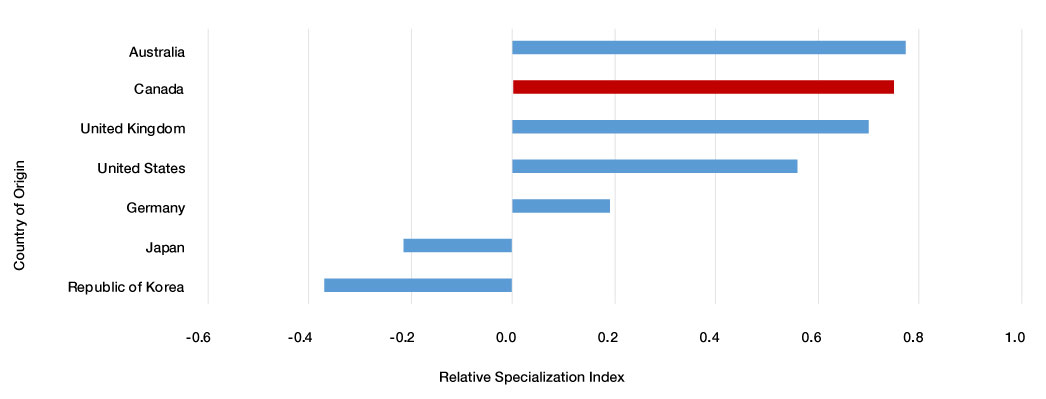
In reference to Figure 13, it is interesting to note that institutions originating from countries considered in Figure 12, including Canadian institutions, retain their level of relative specialization for the Therapeutics and Vaccine Development research area.
Figure 13: Relative Specialization Index by institution's country of origin for Therapeutics and Vaccine Development
Description of figure 13
| Country of Origin | Relative Specialization Index |
|---|---|
| Republic of Korea | -0.368 |
| Japan | -0.213 |
| Germany | 0.191 |
| United States | 0.564 |
| United Kingdom | 0.702 |
| Canada | 0.750 |
| Australia | 0.776 |
Having established the high relative specialization of Canadian institutions for the Therapeutics and Vaccine Development research area in Figure 13, Table 1 presents the evolution of Canadian institutions for this research area and benchmarks it against institutions from other countries. Upon breaking down the dataset over the two decades that were considered for this analysis, it is clear that, except for Medical Preparations and Human, the relative specialization of Canadian institutions has improved over time for all the sub-categories presented in the table.Footnote vii
| Institution's Country of Origin | Relative Specialization Index | |||||||||||
|---|---|---|---|---|---|---|---|---|---|---|---|---|
| Medical Preparations | Medical Preparations and Human | Medical Preparation Containing Antigens | Immunogenic Compositions (specific to coronaviridae) | |||||||||
| 1999 - 2008 | 2009 - 2018 | Trend | 1999 - 2008 | 2009 - 2018 | Trend | 1999 - 2008 | 2009 - 2018 | Trend | 1999 - 2008 | 2009 - 2018 | Trend | |
| Australia | 0.00 | 0.05 | increase | -0.06 | -0.10 | decrease | 0.43 | 0.39 | decrease | 0.10 | 0.34 | increase |
| Canada | 0.05 | 0.14 | increase | 0.05 | -0.01 | decrease | 0.08 | 0.24 | increase | 0.00 | 0.10 | increase |
| United Kingdom | 0.16 | 0.15 | decrease | 0.01 | 0.14 | increase | -0.24 | 0.12 | increase | -0.20 | -0.43 | decrease |
| United States | -0.02 | 0.09 | increase | -0.10 | 0.10 | increase | 0.09 | 0.19 | increase | -0.01 | -0.27 | decrease |
| Germany | 0.08 | 0.23 | increase | 0.17 | 0.35 | increase | -0.48 | 0.03 | increase | -1.31 | -0.33 | increase |
| Japan | -0.07 | 0.00 | increase | -0.04 | 0.03 | increase | 0.02 | 0.15 | increase | -0.18 | -0.14 | increase |
| Republic of Korea | 0.00 | 0.07 | increase | -0.10 | -0.05 | increase | -0.30 | -0.17 | increase | 0.05 | 0.02 | decrease |
Patent Concentration among Canadian Institutions
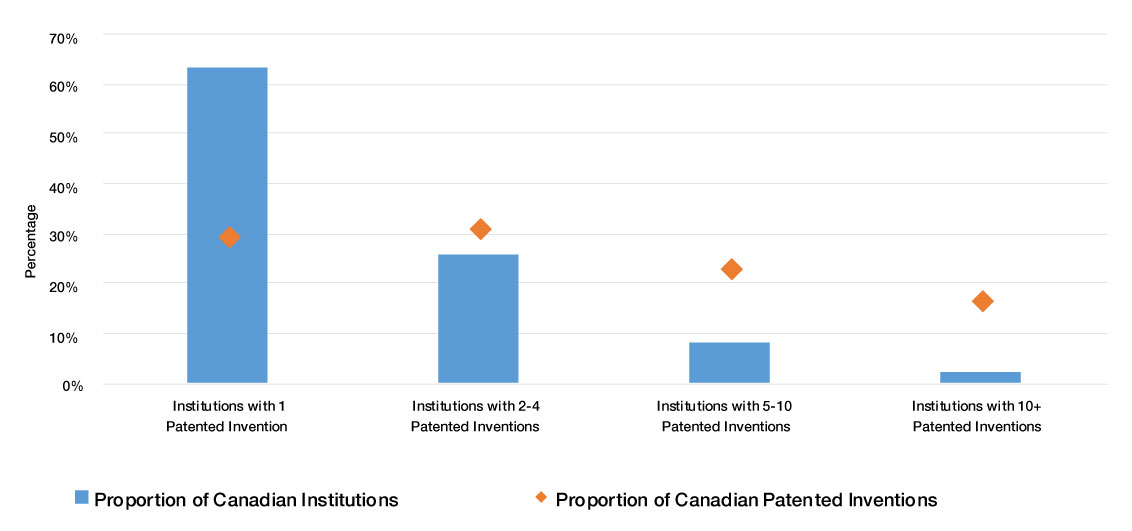
After understanding where Canadian institutions' strengths lie in pandemic mitigation technologies, this section seeks to understand whether this specialization stems from a few select Canadian institutions, or if it is a result of a large number of Canadian institutions patenting in this field. In Figure 14, Canadian institutions have been grouped together on the basis of the number of patented inventions globally by each institution. The blue bars depict the proportion of Canadian institutions present in each group whereas the orange dots indicate the proportion of Canadian patented inventions associated with each group. Based on this figure, one can infer that Canadian institutions who have patented less than five inventions for pandemic mitigation technologies account for more than 60% of the Canadian patented invention dataset. This not only highlights the presence of a large number of Canadian institutions actively patenting in this field but could also speak to the competitive global environment they operate in.
Figure 14: Canadian institutions grouped by their pandemic mitigation technologies patent portfolio size
Description of figure 14
| Patented Invention Count | Proportion of Canadian Institutions | Proportion of Canadian Patented Inventions |
|---|---|---|
| Institutions with 1 Patented Invention | 63.53% | 29.51% |
| Institutions with 2-4 Patented Inventions | 25.88% | 31.15% |
| Institutions with 5-10 Patented Inventions | 8.24% | 22.95% |
| Institutions with 10+ Patented Inventions | 2.35% | 16.39% |
Collaboration among Institutions
Collaborations, involving domestic and international institutions, are often associated with technological advancements, especially during a crisis as overwhelming as a global pandemic. Interestingly, many businesses and academic institutions in Canada have taken the Open COVID Pledge, which is aimed at fostering collaboration and working towards the common goal of mitigating the impacts of the pandemic.Endnote 11 As part of this initiative, institutions will provide royalty-free, limited-time licenses to their IP, so that other institutions can develop and deploy technologies on a greater scale without any impediment.Endnote 12
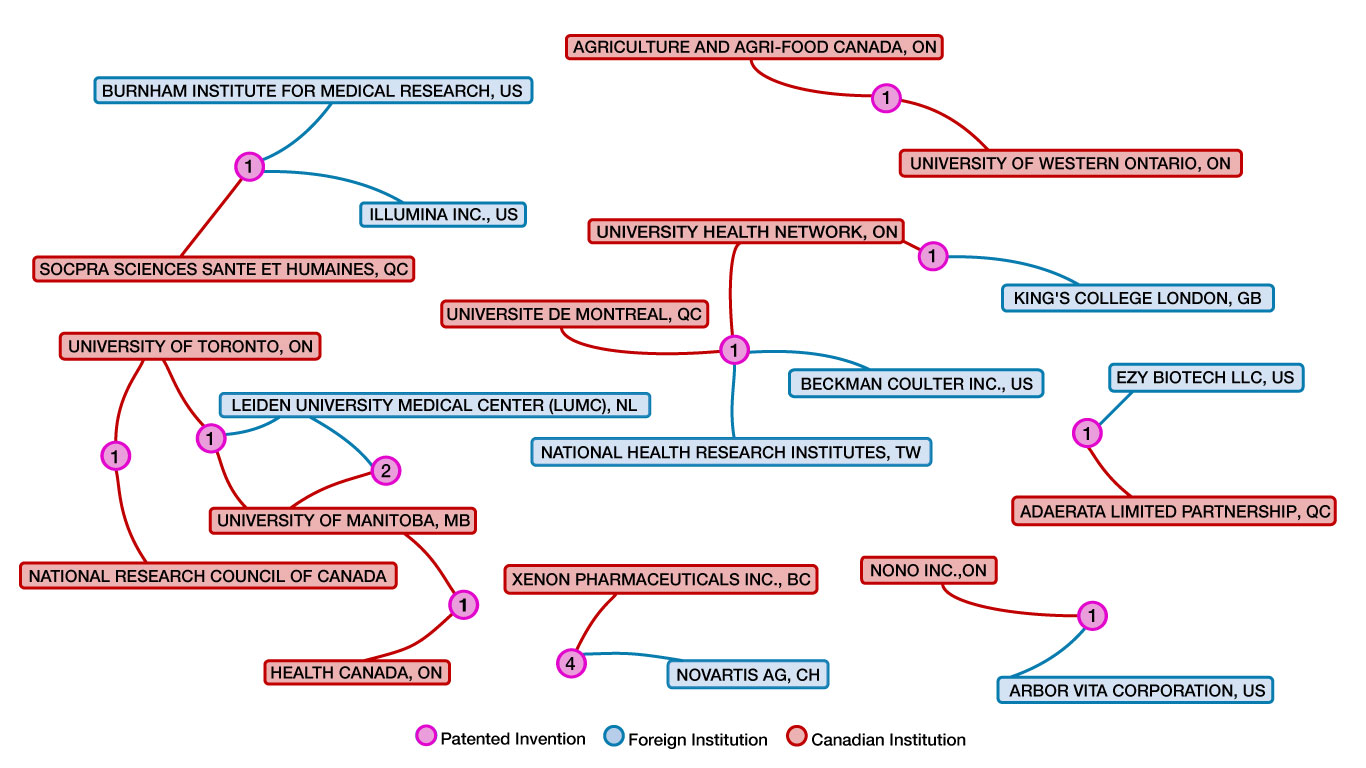
Figure 15 shows the collaborations involving at least one Canadian institution that have been identified using our dataset. The pink nodes in this figure indicate the number of patented inventions wherein two or more institutions were identified as joint assignees. In addition, Canadian institutions have been highlighted in red and international institutions have been highlighted in blue. Using this figure, it is encouraging to see different institution types (i.e., academic institutions, businesses, government departments and medical facilities) collaborating to develop solutions in this field. Interestingly, 7 out of the 15 patented inventions presented in this figure have at least one institution based out of the province of Ontario, followed by British Columbia (4 patented inventions), Manitoba (4 patented inventions) and Quebec (3 patented inventions). In addition, Canadian institutions have primarily collaborated with institutions from the U.S. (5 patented inventions), Switzerland (4 patented inventions) and the Netherlands (3 patented inventions) for pandemic mitigation technologies. It is also worth noting that all of the patented inventions involving a collaboration relate to Therapeutics and Vaccine Development except for the one collaboration between Adaerata and Ezy Biotech which is related to the Rapid Detection and Diagnosis research area.
Figure 15: Collaboration among institutions for pandemic mitigation technologies
Description of figure 15
Figure 15 shows the collaborations that have been identified using the patent dataset. The pink node indicates the number of collaborative patents and the vertices connected to them represent institutions which have been identified as joint applicants for the patented inventions. Canadian institutions are highlighted in red while foreign institution are highlighted in blue. Following are the collaborations observed:
- Canadian institutions: Agriculture and Agri-Food Canada (ON), and University of Western Ontario (ON) collaborated for 1 patented invention.
- Canadian Institution: Socpra Sciences Sante et Humaines (QC), and International Institutions: Burnham Institute for Medical Research (US) and Illumina Inc (US) collaborated for 1 patented invention.
- Canadian Institution: University of Health Network (ON), and International Institution: Kings College London (GB) collaborated for 1 patented invention.
- Canadian Institutions: University of Health Network (ON) and University of Montreal (QC), and International Institutions: Beckman Coultier Inc (US) and National Health Research Institutes (TW) collaborated for 1 patented invention.
- Canadian Institution: Adaerata Limited Partnership (QC), and International Institution: Ezy Biotech LLC (US) collaborated for 1 patented invention.
- Canadian Institutions: University of Toronto (ON) and National Research Council of Canada (ON) collaborated for 1 patented invention.
- Canadian Institutions: University of Toronto (ON) and University of Manitoba (MB), and International Institution: Leiden University Medical Center (NL) collaborated for 1 patented invention.
- Canadian Institution: University of Manitoba (MB), and International Institution: Leiden University Medical Center (NL) collaborated for 2 patented inventions.
- Canadian Institutions: University of Manitoba (MB) and Health Canada (ON) collaborated for 1 patented invention.
- Canadian Institution: Xenon Pharmaceuticals Inc (BC), and International Institution: Novartis AG (CH) collaborated for 4 patented inventions.
- Canadian Institution: Nono Inc (ON), and International Institution: Arbor Vita Corporation (US) collaborated for 1 patented invention.
Regional Clusters of Patent Activity
Figure 16 shows the distribution of patent activity by Canadian institutions across provinces in Canada for pandemic mitigation technologies. The number of patented inventions for each province has been normalized by its GDP value for 2016, to better reflect the contribution of each province to innovation on a relative basis.Footnote viii, Endnote 13 The outcome from applying this normalization reveals that the province of British Columbia has the highest patenting intensity followed by Quebec and Ontario. The red location pointers in the figure highlight the innovation hotspots that exist within Canada for pandemic mitigation technologies and indicate the total number of institutions that have been identified within prominent Census Metropolitan Areas (CMA) using our dataset. Montreal and Vancouver CMAs, each with 12 institutions, have the highest number of institutions that have been patenting in this field followed closely by Toronto with 10 institutions. At least three-quarters of these institutions, across these 3 prominent CMAs, are businesses and the remaining quarter are academic institutions.
Figure 16: Regional clusters of patent activity by Canadian institutions for pandemic mitigation technologies

Description of figure 16
| Province | Patented Inventions / GDP per trillion |
|---|---|
| British Columbia | 139.7353495 |
| Quebec | 103.0831072 |
| Ontario | 44.9737905 |
| Saskatchewan | 41.97929581 |
| Manitoba | 32.10803712 |
| Alberta | 17.09041204 |
| CMA | # of Institutions |
|---|---|
| Montréal | 12 |
| Vancouver | 12 |
| Toronto | 10 |
| None | 4 |
| Hamilton | 3 |
| Calgary | 2 |
| Saskatoon | 2 |
| Winnipeg | 2 |
| Sherbrooke | 2 |
| Ottawa-Gatineau | 2 |
| Québec | 2 |
| Guelph | 1 |
| London | 1 |
| Edmonton | 1 |
Leading Canadian Institutions
The following set of tables include a list of leading Canadian institutions for each of the three research areas along with their top patenting inventors. Upon closer inspection of these tables, it is apparent that most Canadian institutions are associated with leading inventors having a Canadian registered address.
| Canadian Institution | Patented Inventions | Leading Inventors | Patented Inventions |
|---|---|---|---|
| XENON PHARMACEUTICALS INC. (BC) | 19 | Kamboj Rajender | 7 |
| Kodumuru Vishnumurthy (BC) | 7 | ||
| Sun Shaoyi,Coquitlam (BC) | 7 | ||
| REPLICOR INC. (QC) | 8 | Vaillant Andrew (QC) | 7 |
| Bazinet Michel (QC) | 3 | ||
| Juteau Jean-Marc (QC) | 3 | ||
| MEDICAGO INC. (QC) | 6 | Vezina Louis-Philippe (QC) | 3 |
| Couture Manon (QC) | 3 | ||
| D'Aoust Marc-Andre (QC) | 3 | ||
| Lavoie Pierre-Olivier (QC) | 3 | ||
| MERCK CANADA INC. (QC) | 6 | Black Cameron (QC) | 4 |
| Crane Sheldon (QC) | 4 | ||
| Robichaud Joel | 2 | ||
| UNIVERSITY HEALTH NETWORK (ON) | 6 | Kelvin David (ON) | 3 |
| Persad Desmond (ON) | 2 | ||
| Cameron Mark J. (ON) | 2 |
| Canadian Institution | Patented Inventions | Leading Inventors | Patented Inventions |
|---|---|---|---|
| FIO CORPORATION (ON) | 9 | Chan Warren Che Wor (ON) | 5 |
| Greenberg Michael Mordinson (ON) | 3 | ||
| Kain Kevin Charles (ON) | 3 | ||
| YES BIOTECHNOLOGY INC. (BC) | 5 | Whitehead Peter (BC) | 5 |
| LUMEN ASSOCIATES INC. (AB) | 3 | Fry Jeffrey Donald | 2 |
| Gibson Hugh Stewart | 2 | ||
| Kemp Douglas Roy | 2 | ||
| Rosenstiel Leonie | 2 | ||
| EARLY WARNING INC. (QC) | 2 | Gordon Neil (QC) | 2 |
| Palmateer Garry (ON) | 2 |
| Canadian Institution | Patented Inventions | Leading Inventors | Patented Inventions |
|---|---|---|---|
| YES BIOTECHNOLOGY INC. (BC) | 4 | Whitehead Peter (BC) | 4 |
| FIO CORPORATION (ON) | 2 | Fine Ian (ON) | 2 |
| Liederman Adam (ON) | 2 | ||
| Qandil Bayan (ON) | 2 | ||
Canadian Patent Landscape
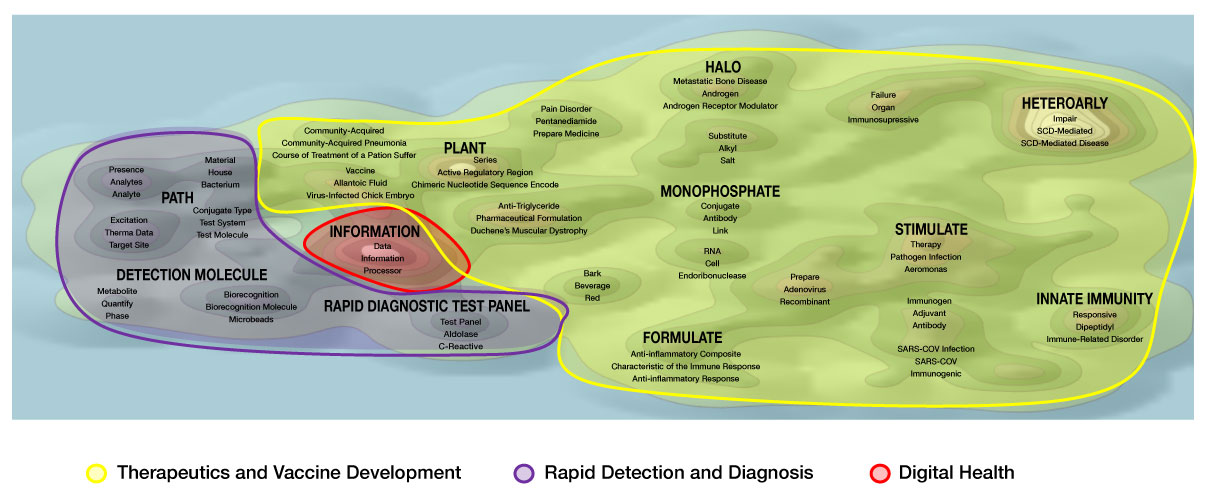
In Figure 17, the patent landscape map for Canadian institutions highlights the foundational technologies that were patented for pandemic mitigation technologies between 1999 and 2018. Upon comparing this figure with the international patent landscape map in Figure 10, the strength of Canadian institutions in Therapeutics and Vaccine Development is apparent as this research area encompasses almost two-thirds of the map.
There are two categories of inventions captured in Figure 17, disease-related inventions and technology-related inventions. The disease related category consists of infections (example: SARS-CoV), diseases (examples: pneumonia, blood disorders, sickle cell disease, bone and pain disorders), virus-receptor mechanisms (example: androgen-receptor modulator), immune responses (examples: innate immunity, anti-inflammatory responses and immunosuppression). The second category involves the underlying technologies used for the development of therapeutic interventions and includes nucleotide sequences, antibody constructs, virus-infected chicken embryos, and preparation of adenoviruses which are used as viral vectors, in addition to involving plant biology. Similarly, for the Rapid Detection & Diagnosis subcategory, the patented inventions related to conjugates, biorecognition and C-reactive proteins are valuable foundational technologies for the pandemic.
Figure 17: Canadian patent landscape map for pandemic mitigation technologies
Description of figure 17
Figure 17 is a patent landscape map that provides a visual representation of Canadian patent activities in data set in this report. Derwent Innovation's ThemeScape mapping tool was utilized to produce this visualization, using term frequency (keywords from a patents title and abstract) and other algorithms to cluster documents based on shared language. The result is a patent landscape map, a map very much resembling that of a topographic map, where there are sections of turquoise and white. Areas pertaining to Digital Health are highlighted in red, areas pertaining to Rapid Detection and Diagnosis are highlighted in purple and regions pertaining to Therapeutics and Vaccine Development are highlighted in yellow. Sections are comprised of peaks, some of which have bright white peaks, representing the highest concentration of patents and are labelled with key terms that tie common themes together. Turquoise is used to separate terms where there is no commonality between them. The legend provides more details on the top inventors and key words as described in the report.
Broad themes written in all capital letters include:
- Halo
- Heteroaryl
- Plant
- Path
- Information
- Monophosphate
- Stimulate
- Innate immunity
- Formulate
- Rapid diagnostic test panel
- Detection molecule
Prominent word sequences in this graph include:
- Metastatic bone disease
- Androgen
- Androgen receptor modulator
- Pain disorder
- Pentanediamide
- Prepare medicine
- Failure
- Organ
- Immunosuppressive
- Impair
- Scd-mediated
- Sch-mediated disease
- Community-acquired
- Community-acquired pneumonia
- Course of treatment of a patient suffer
- Vaccine
- Allantonic fluid
- Virus-infected chick embryo
- Series
- Active regulatory region
- Chimeric nucleotide sequence encode
- Material
- House
- Bacterium
- Presence
- Analytes
- Analyte
- Excitation
- Thermal data
- Target site
- Conjugate type
- Test system
- Test molecule
- Data
- Information
- Processor
- Anti-triglyceride
- Pharmaceutical formulation
- Duchene's muscular dystrophy
- Conjugate
- Antibody
- Link
- RNA
- Cell
- Endoribonuclease
- Therapy
- Pathogen infection
- Aeromonas
- Responsive
- Dipeptidyl
- Immune-related disorder
- Region
- Bind
- Protein
- Immunogen
- Adjuvant
- Antibody
- SARS-COV infection
- SARS-COV
- Immunogenic
- Prepare
- Adenovirus
- Recombinant
- Anti-inflammatory composition
- Characteristic of the immune response
- Anti-inflammatory response
- Bark
- Beverage
- Red
- Test panel
- Aldolase
- C-reactive
- Biorecognition
- Biorecognition molecule
- Microbeads
- Metabolite
- Quantify
- Phase