
This publication is available online at https://ised-isde.canada.ca/site/digital-technologies-ict/en.
To obtain a copy of this publication, or to receive it in an alternate format (Braille, large print, etc.), please contact:
Web Services Centre
Innovation, Science and Economic Development Canada
C.D. Howe Building
235 Queen Street
Ottawa, Ontario K1A 0H5
Canada
Telephone (toll-free in Canada): 1-800-328-6189
Telephone (international): 613-954-5031
TTY (for hearing impaired): 1-866-694-8389
Business hours: 8:30 a.m. to 5:00 p.m. (Eastern Time)
https://ised-isde.canada.ca/site/ised/en/contact-innovation-science-and-economic-development-canada
Permission to Reproduce
Except as otherwise specifically noted, the information in this publication may be reproduced, in part or in whole and by any means, without charge or further permission from the Department of Industry, provided that due diligence is exercised in ensuring the accuracy of the information reproduced; that the Department of Industry is identified as the source institution; and that the reproduction is not represented as an official version of the information reproduced, or as having been made in affiliation with, or with the endorsement of, the Department of Industry.
For permission to reproduce the information in this publication for commercial purposes, please fill out the Application for Crown Copyright Clearance at ised-isde.canada.ca/site/ised/en/terms-and-conditions/apply-crown-copyright-clearance-07413 or contact the Web Services Centre mentioned above.
© Her Majesty the King in Right of Canada, as represented by the Minister of Industry, 2025
Cat. No. Iu62-2E-PDF
ISSN 1913-0171
Aussi offert en français sous le titre Profil du secteur canadien des TIC 2024
PDF version
2024 ICT Sector Snapshot
| Revenue (est) | GDP | Good Exports | Services Exports (est) | |
|---|---|---|---|---|
| Size | $298B | $131.6B | $11.3B | $36.8B |
| 2024 Growth | +1.8% | +0.7% | -3.6% | +10.7% |
| Share of Economy | N/A | 5.8% | 1.4% | 27.0% |
|
48,393 companies |
||
| Innovation | 2024 Growth | Share of Economy |
|---|---|---|
| $15.0B in Business R&D spending | +5.8% | 45.4% |
|
59.6% of workers have a University Degree |
||
| Workforce | 2024 Growth | Share of Economy |
|---|---|---|
| 802,913 Workers | -1.2% | 3.9% |
| $103,460 in Annual Average Salary | +7.0% | N/A |
|
Average Salary 57.8% higher than Canadian Average |
||
Sub-Sector Trends
| Revenues (est.) ($millions) |
Employment | GDP ($millions) |
R&D ($millions) |
|||||
|---|---|---|---|---|---|---|---|---|
| 2024 | CAGR 5 Year | 2024 | AAGR 5 Year | 2024 | AAGR 5 Year | 2024 | CAGR 5 Year | |
| ICT Manufacturing | 10,737 | 2.1% | 32,057 | -1.7% | 3,903 | 0.6% | 908 | 5.1% |
| Software & Computer Systems | 147,494 | 10.0% | 594,202 | 5.7% | 75,676 | 8.4% | 9,975 | 12.7% |
| Communications Services | 68,590 | 0.9% | 118,138 | -2.1% | 43,234 | 2.4% | 1,473 | -0.5% |
| ICT Wholesaling | 70,947 | 5.7% | 58,516 | 0.5% | 8,820 | 3.5% | 2,599 | 16.2% |
Economic and Employment Impacts of ICT (2024)
| Impact on Canadian GDP ($millions) | Impact on Canadian Employment (Persons) | |||||||
|---|---|---|---|---|---|---|---|---|
| Direct | Indirect | Induced | Total | Direct | Indirect | Induced | Total | |
| ICT Manufacturing | 3,903 | 1,728 | 1,643 | 7,275 | 31,957 | 15,699 | 14,997 | 62,653 |
| Software & Computer Systems | 75,676 | 36,222 | 45,165 | 157,064 | 485,906 | 280,204 | 272,102 | 1,030,608 |
| Communications Services | 43,234 | 15,689 | 10,578 | 69,501 | 117,138 | 94,614 | 60,178 | 271,930 |
| ICT Wholesaling | 8,820 | 2,682 | 4,179 | 15,681 | 57,616 | 21,352 | 28,612 | 107,579 |
| ICT Total | 131,633 | 56,322 | 61,565 | 249,521 | 692,617 | 411,868 | 375,888 | 1,472,770 |
The ICT sector creates important economic and employment impacts within the economy. Indeed, each direct job in the ICT sector supports an additional 1.1 jobs within the Canadian economy and each $1 million of direct GDP generated within the ICT sector leads to an additional $895,580 in GDP generated for Canada. Within the ICT sector, software and computer services generates the highest impact multiplier in terms of GDP, whereas communications services has the highest impact multiplier in terms of employment (1.3 multiplier).
ICT Sector Industries
ICT Manufacturing
- Computer and peripheral equipment
- Communications equipment
- Electronic components
- Audio and video equipment
- Magnetic and optical media
Software and Computer Services
- Software publishers
- Computer systems design
- Computing infrastructure and data processing
- Electronic and precision equipment repair and maintenance
ICT Manufacturing
- Computer, computer peripheral and prepackaged software merchant wholesalers
- Electronic components, navigational and communications equipment and supplies merchant wholesalers
Software and Computer Services
- Wireless telecommunications carriers
- Wired telecommunications carriers
- Cable and other program distribution
Industry structure
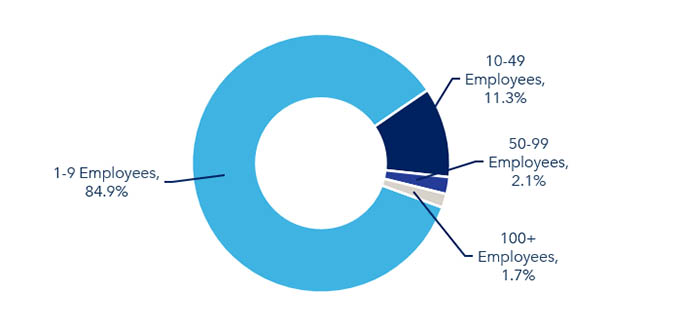
There are over 48,390 companies in the Canadian Information and Communications Technologies (ICT) sector and the large majority (over 44,870) fall within the software and computer services industries. The ICT sector consists mainly of small companies, with approximately 41,000 firms employing fewer than 10 people. There are 153 large companies employing over 500 individuals, including subsidiaries of foreign multinational corporations. Manufacturing stands out as the sub-sector with a larger share of larger firms. In 2024, 8.7% of ICT manufacturing companies had more than 100 employees, while across the whole ICT sector this share was 1.7%.
Figure 1: Companies by ICT sub-sector, 2024
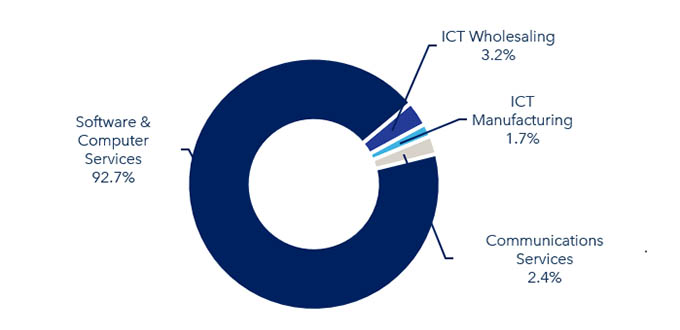
Figure 2: Companies by employee size for total ICT sector, 2024
GDP contribution
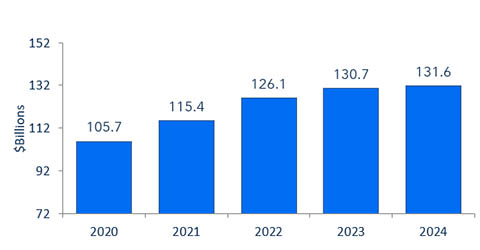
In 2024, the ICT sector’s GDP was $131.6 billion (in 2017 constant dollars), accounting for 5.8% of national GDP, continuing a trend of increasing its share of national GDP. The ICT sector accounts for 19.0% of national GDP growth between 2019 and 2024.
Since 2019, the ICT sector has posted a stronger annual growth than the total economy. On average, the compound annual growth rate in this sector has been 5.0% over a five year period, compared to 1.7% for the overall economy.
The sector’s growth continued in 2024 with GDP up 0.7%, but ceasing to outpace the Canadian economy, which grew by 1.6%, for the first time in 10 years. While the ICT sectors experienced positive growth in 2024, ICT manufacturing and software and computer services saw contractions in output of 3.2% and 0.6%, respectively. Meanwhile, communications services and ICT wholesaling expanded by 2.1% and 8.2%, respectively.
Annual GDP growth within ICT industries varied widely. Semiconductor and other electronic component manufacturing (-8.4%) and manufacturing and reproducing magnetic and optical media (-7.1%) industries posted the greatest annual GDP declines in 2024 for ICT industries. A bright spot in software and computer services industries was computing infrastructure and data processing with annual output growth of 2.6%.
Figure 3: GDP by ICT sub-sector, 2024
(Total: $131.6 Billion)
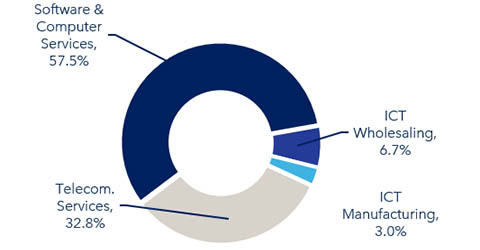
Figure 4: ICT sector GDP , 2020–2024
(2017 constant dollars)
Revenues
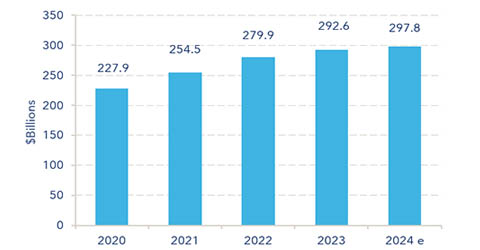
ICT sector revenues reached an estimated $298 billion in 2024. Growth in 2024 is projected to be concentrated in ICT wholesaling, up 15.6%. Software and computer services (-1.9%), ICT manufacturing (-8.5%) and communications services (-0.9%) sub-sectors experienced all are expected to have revenues drop.
From 2020 to 2024, ICT sector revenues grew from $228 billion to $298 billion, a 35% increase. During the same period, communications services saw their revenues grow by 4.7%. On the other hand, other ICT sub-sectors posted greater gains: the software and computer services, ICT wholesaling, and the ICT manufacturing sub-sectors increased by 60.8%, 32.1%, and 10.8% respectively. Over the same period, ICT manufacturing, ICT wholesaling and communications services saw their revenue shares within ICT drop from 4.4% to 3.6%, 24.3% to 23.8% and 29.7% to 23.0%, respectively. This highlights the growing dominance of the software and computer services sub-sector within the ICT sector.
Figure 5: Revenues by ICT sub-sector, 2024
(Total: $298 billion)
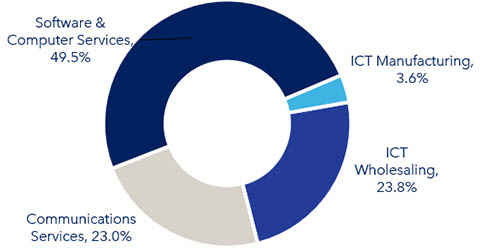
Figure 6: ICT sub-sector revenues, 2020–2024
Exports
The ICT manufacturing sub-sector relies heavily on the export market, which was significantly reduced as a result of the impacts of COVID-19, lowering economic activity throughout 2020 and 2021. ICT goods account for 1.4% of total Canadian goods exports, down from 2% pre-pandemic. Total Canadian exports of ICT goods remain at 2019 levels, at $11.3 billion, in 2024.
Figure 7: Exports of ICT goods by product group, 2024
(Total: $11.3 Billion)
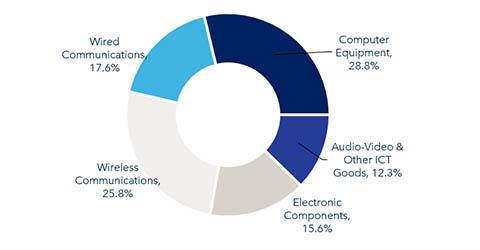
In 2024, the strongest growth in ICT exports were in wireless communications equipment and computer and peripheral equipment exports, up 4.4% and 3.3%, respectively. Other communications equipment also grew, up 6.9%, but from a small value of exports, $485 million up to $518 million.
Over the five year period to 2024, exports of ICT goods grew 3.6% compared to a 12.6% increase in imports over the same time period. Since 2019, exports of computer and peripheral equipment have experienced the largest decline (-8.5%) followed by other communications equipment manufacturing (-6.1%). All other ICT goods have showed an increases in exports over the five year period.
Exports of ICT goods to the United States increased (+3.6%) to about $7.6 billion in 2024 accounting for 67.0% of all ICT goods exported from Canada. Pre-pandemic the United States accounted for 70% of all ICT goods exports from Canada. In 2024, exports to the Asia-Pacific region fell by 22.4%, while they decreased slightly to the European Union and United Kingdom, down 3.5%. The Asia-Pacific region accounted for 11.4% of all Canadian exports of ICT goods, while the European Union and United Kingdom accounted for 10.6%. Exports to all other countries rose in 2023 (+10.7%), to reach an 11.0% share.
Figure 8: Exports of ICT goods by region, 2024
(Share of total)
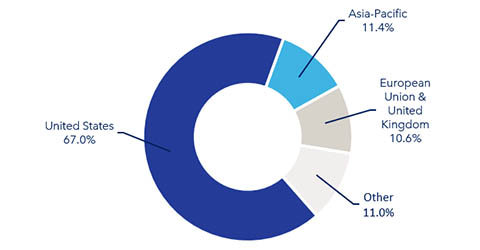
Figure 9: Exports of ICT goods and services,
2019–2024 ($ billions)
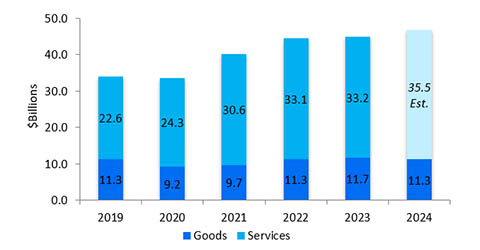
While ICT service industries are domestically oriented they also provide an important contribution to increasing export diversification. In 2023, exports of ICT communications services grew by 1.8%, to $2.1 billion, while software and computer service exports grew by 0.4% to $31.1 billion. Exports accounted for about 21% of software and computer services revenues, while the figure was 3% for communications services revenues. Overall exports of ICT services were worth $33.2 billion in 2023 and are projected to reach $35.5 billion in 2024.
Canadian exports of ICT goods and services grew at a 8.8% CAGR from 2018 to 2023 to reach $45.0 billion and are projected to approach $46.8 billion for 2024.
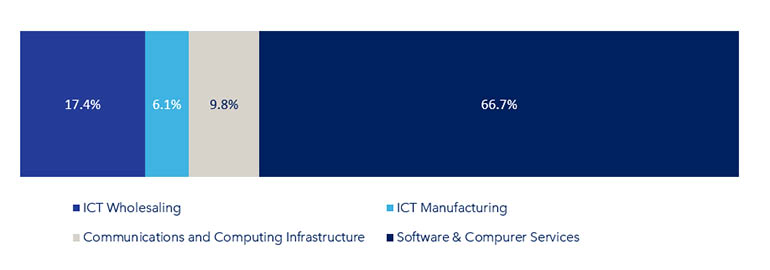
Research & development
The ICT sector is the largest performers of R&D in the Canadian private sector. In 2023, the sector held a 45.0% share of all private sector R&D expenditures in Canada and is projected to account for 45.4% in 2024. ICT sector R&D expenditures totaled $14.1 billion in 2023 and has R&D spending intentions of $15 billion for 2024. For 2024, R&D spending is expected to decline for ICT manufacturing (-2.5%) and ICT wholesaling (-1.6%) but increase for all other ICT industries. Communications and data hosting services project an R&D spending increase of 3.7%, while the largest increases are expected in software publishing (+7.2%) and computer systems design (+9.9%) industries.
Figure 10: R&D expenditures by ICT industry, 2024
(Total: $15.0 billion)
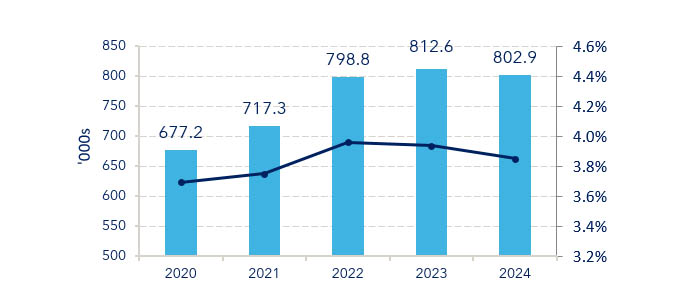
Employment
Employment growth in the ICT sector has been outpacing the overall economy for many years (2013 to 2023), between 2018 and 2023 average annual growth for ICT was 4.5%, and 1.5% for the overall economy. However, in 2024 the ICT sector saw a decline in employment of 1.2% compared to a 1.0% increase in the overall economy. In 2024, more than 802,900 individuals were working in the ICT sector, accounting for 3.9% of the Canada’s total employment.
In 2024, a 2.5% and 0.3% increase respectively in the computing infrastructure and computer systems design workforces was observed. Employment levels in communications services and ICT wholesaling sub-sectors decreased by 3.3% and 1.6% respectively while employment in software publishing and ICT manufacturing fell by 5.4% and 5.6% respectively.
Figure 11: ICT sector employment, 2020–2024
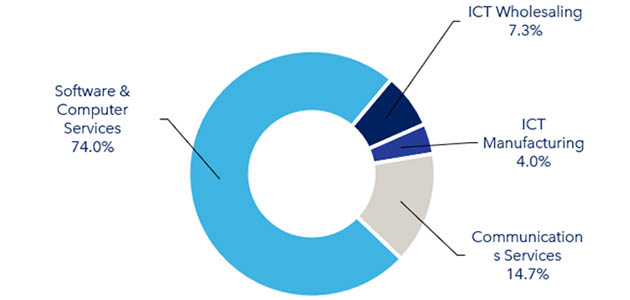
Between 2019 and 2024, total employment growth in software and computer services has outpaced overall growth in the ICT sector (33.1% vs. 19.8%). The total ICT sector workforce grew from 670,425 in 2019 to 802,900 in 2024. Software and computer services’ share of employment has increased from 67% to 74% over that same time period, reflecting the rising proportion of service firms in the ICT sector compared to other sub-sectors and the growing demand for ICT services.
Figure 12: Employment by ICT sub-sector, 2024
(Total: 802,913 workers)
Education
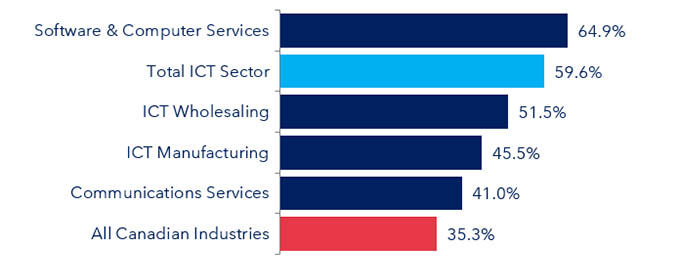
The ICT sector is characterized by a knowledge-intensive workforce, with 60% of its workers holding a university degree, compared to 35% across all Canadian industries. The software and computer services sub-sector employs the largest proportion of university educated workers within the ICT sector (64.9%).
Figure 13: Percentage of workers with a university degree by industry category, 2023
Employee earnings
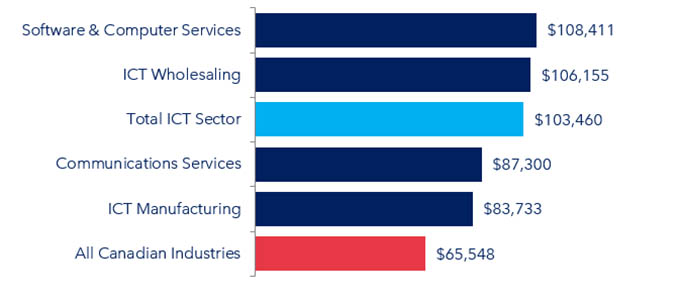
Employees in the ICT sector earned on average over $103,460 per year. In 2024, they earned 57.8% more than the economy-wide average, up from the 46.2% premium in 2020.
The highest earners in the ICT sector were those in software and computer services and wholesaling sub-sectors. Despite having the lowest average earnings in the ICT sector, employees in the communications services and ICT manufacturing sub-sectors still earned 33.2% and 27.7% more than the national average in 2024, respectively.
From 2019 to 2024, the average salary in the ICT sector grew by 5.0% per year compared to an average of 3.2% for salaries in the overall economy.
Figure 14: Average annual earnings by industry category, 2024
Labour Productivity
Figure 15: Labour productivity by industry category, 2024
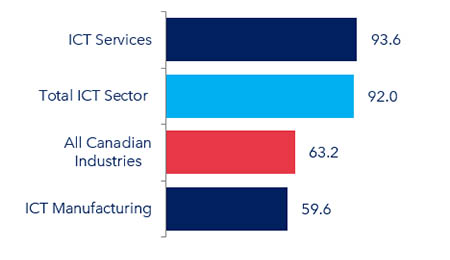
Labour productivity, the ratio between real value added and hours worked, is higher (+46%) for the ICT sector than for the average of all industries. ICT sector labour productivity resumed growth in 2024, rising by 11.7%, after declining by 1.2% in 2023 and up 8.0% over the level seen five years ago.
Year-over year, labour productivity was down by 1.8% for ICT manufacturing and up 12.2% for ICT services. Communications services, up 4.1% in 2024, had the highest labour productivity at 179.3, followed by computing infrastructure and data processing at 102.3, up 4.3%, and software publishing at 88.9, up 2.3%.
SMEs in the ICT Sector
Small- and medium-sized enterprises (SMEs) account for an estimated 49% of revenues and 61.6% of all ICT sector employment (excluding Communications Services), employing 355,360 people in the country in 2023. These SMEs represent about 99.4% of ICT sector firms.
Figure 16: Percentage of firms selling to location, 2023
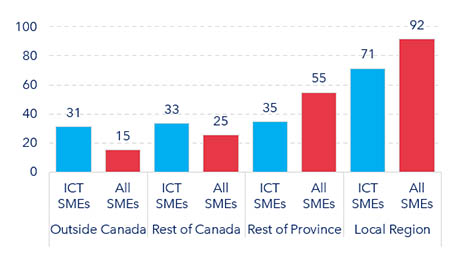
ICT SMEs are less focused on their local region for sales than all SMEs. ICT SMEs are twice as likely to export than all SMEs; 31.1% of ICT SMEs made sales outside Canada in 2023 versus 15.1% for all SMEs. Exports account for 20.1% of ICT SMEs sales, compared to exports making up 5.6% of sales value for all SMEs. ICT SME exporters were most likely to export services (72.7%), followed by goods and services (17.6%), with 9.7% exporting only goods.
ICT SMEs are innovative, 41.8% of ICT SMEs engaged in an innovation activity in 2023 compared to 27.1% of all SMEs. The most common innovation activity for ICT firms was a new or significantly improved good or service (product innovation) at 32.1%, followed by organizational innovation (8.5%), process innovation (8.3%), and marketing innovation (8.2%.)
ICT SMEs are early adopters of advanced technologies. In 2023, 77.1% of ICT SMEs reported adopting at least one advanced technology over the last three years compared to 50.9% of all SMEs. The most widely adopted technologies for ICT SMEs were business or enterprise software solutions (55.0%), information technology (IT) security and authentication systems (37.8%) and industry-specific business software (26.3%).
In 2023, 29.0% of ICT SMEs held at least one type of intellectual property (trademarks, patents, industrial designs, trade secrets, or non-disclosure agreements) compared to 15.4% of SMEs; 78% of ICT SMEs report being familiar with at least one type of intellectual property compared to 53.7% of all SMEs. The most common intellectual property (IP) held by ICT SMEs, according to this survey, was non-disclosure agreements and registered trademarks.
Software is protected by copyright, however this survey did list copyright or original software as IP options; this may have lowered the positive response rates for ICT SMEs. According to Statistics Canada, the ICT sector (including Communications Services) accounts for 80.7% of all business enterprise payments received for IP and other technological services in Canada. Over 77% of the value of IP payments to the ICT sector are for original software (worth $8.1 billion in 2022).
Data Sources
- Companies:
- ISED calculations using data from Statistics Canada’s Business Registry.
- Revenues:
- Manufacturing: Statistics Canada, Table 16-10-0117-01;
- Software and Computer Services: Statistics Canada, Table 22-10-0087-01 and custom tabulations;
- Communications Services: Statistics Canada, Table 22-10-0003-01;
- Wholesale: Statistics Canada Table, 20-10-0077-01; and
- ISED estimates for the most recent year presented (for all ICT industries).
- GDP :
- Statistics Canada custom tables.
- Employment:
- Statistics Canada, Survey of Employment, Payroll, and Hours (SEPH) for the number of employees and Labour Force Survey (LFS) for the number of self-employed (custom tables).
- Research & Development:
- Statistics Canada, Table 27-10-0333-01.
- Education:
- Statistics Canada, Labour Force Survey custom tables.
- Employee Earnings:
- ISED calculations using Statistics Canada, Tables 14-10-0202-01 and 14-10-0204-01.
- Exports:
- Goods: ISED calculations using Trade Data Online data;
- Services: Statistics Canada, Table 36-10-0006-01.
- Economic and Employment Impacts:
- ISED calculations using GDP (custom tables), Employment (Survey of Employment, Payroll, and Hours (SEPH)) and Statistics Canada, Input-output multipliers, Table: 36-10-0594-01
- Labour Productivity:
- Statistics Canada. Table 36-10-0480-01 Labour productivity by business sector industry.
- SMEs in the ICT Sector:
- Statistics Canada, Survey on Financing and Growth of Small and Medium Enterprises, 2024. The survey covers businesses that have 1 to 499 employees and annual revenue of at least $30,000. For the ICT sector it excludes Communications Services (NAICS 517) from its definition.
- Statistics Canada. Table 27-10-0349-01 Business enterprise payments made and received for intellectual property and other technological services by industry group based on the North American Industry Classification.