

PDF version

Features of Report
- Report Objective
- Report Development Process
- Report Overview
- Defence Industrial Base
- Revenues, 2014–2024
- Economic Impact
- Key Industrial Indicators by Firm Size
- Key Industrial Indicators by Domain
- Domestic Supply Chains by Domain
- Regional Breakdown
- Innovation
- STEM & Workforce Characteristics
- Exports
- Key Findings
- Annexes
- Annex 1 - Economic Impact Methodology Principles
- Annex 2 – Revenues of Canadian Civil Marine by Type of Customer
- Annex 3 – Revenues of the Canadian Defence Industry by Type of Customer
- Annex 4 – Canadian Defence Industry Key Industrial Indicators
- Annex 5 – Canadian Defence Industry Economic Impact
- Annex 6 – Canadian Defence SMB Key Industrial Indicators
- Annex 7 – Revenues of Defence Goods and Services Categories by Domain
- Annex 8 – Top Ten Regional Defence Activities, Ranked by Employment (2024)
- Annex 9 – R&D to Revenues Ratios of Defence Goods and Services Categories
- Annex 10 – Canadian Defence Industry R&D Expenditures by Source of Funds
- Annex 11 – STEM to Employment Ratios of Defence Goods and Services Categories
- Annex 12 – Share of Female Employees by Occupation (2024)
- Annex 13 – Canadian Defence Industry Exports by Destination
- Annex 14 – Exports to Revenues Ratios of Defence Goods and Services Categories
- Annex 15 – Official Definitions of Defence Goods and Services Categories by Domain
- Data Sources
Report Objective
Objective: Develop relevant, quality, and timely strategic information on Canadian production of defence goods and provision of services to brief policy and industry decision makers
- Canada is the first country from the Organisation for Economic Co-operation and Development (OECD) and North Atlantic Treaty Organization (NATO) to conduct an in-depth Government statistical agency survey on defence industry capabilities.
- ➢ Data from the survey produces statistical information on goods and services, sales, employment, exports, innovation, skills, and business practices among firms engaged in the defence industry in Canada.
- ➢ The development of a statistically reliable survey is required to effectively identify and measure defence goods and services where:
- Standard industrial classification systems mix defence and non-defence activities, and
- Publicly available firm-level data provide insufficient estimates of specific defence activities.
- This report is supported by a multi-year collaborative analytics agreement between Innovation, Science and Economic Development Canada (ISED) and the Canadian Association of Defence and Security Industries (CADSI).
- This report presents a statistical overview of Canadian defence industry activities in 2024, based on the most recent data available.
- ➢ It also provides a comparative analysis of the state of the Canadian defence industry between 2022 and 2024.
- The next iteration of the biennial survey will measure 2026 industrial activities.
- ➢ Statistics Canada’s publication of 2026 data is scheduled for 2028.
Report Development Process
- Critical Path to Data Development: Stakeholder Engagement (Spring – Autumn 2024)
- Consultation with industry and government stakeholders and policy decision-makers on their priority data requirements
- Development, field testing, and refinement of new survey questions
- Verification of priority firms and key contact information with industry association partners
- Data Development (Winter 2025 – Winter 2026)
- Administration of ISED-sponsored Statistics Canada biennial survey
- ➢ Distribution of survey questionnaire by Statistics Canada
- ➢ Completion of the survey is a legal requirement under the Statistics Act
- Outreach to membership by industry association partners to encourage firms’ participation
- Validation of data quality and imputation of firm-level data based on Government of Canada administrative data and independent subject matter expert data sources
- Administration of ISED-sponsored Statistics Canada biennial survey
- Research & Analysis (Winter – Spring 2026)
- Modelling of total economic impact (i.e., GDPFootnote 1 and jobs contributions)
- ➢ Methodology principlesFootnote 2 informed by experts at the OECD and Statistics Canada
- Preparation of customized tabulations data tables by Statistics Canada
- Review of results with industry association partners
- Joint release of the report by ISED and CADSI
- Modelling of total economic impact (i.e., GDPFootnote 1 and jobs contributions)
- Footnote
-
Gross Domestic Product (GDP) is the total unduplicated value of the goods and services produced in the economic territory of a country or region during a given period
-
See Annex 1or detailed methodology principles.
Report Overview
| Defence Industrial Base | Domestic Supply Chains by Domain |
| Revenues, 2014–2024 | Regional Breakdown |
| Economic Impact | Innovation |
| Key Industrial Indicators by Firm Size | STEM & Workforce Characteristics |
| Key Industrial Indicators by Domain | Exports |
Defence Industrial Base
The Canadian defence industrial base is interlinked with various industries including aerospaceFootnote 3, space , marineFootnote 4 and landFootnote 5
Figure 1: Intersection and Proportion of Revenues by IndustryFootnote 6, 2024

- Footnote
-
Civil-related space is based on the latest available figures (2023) and includes Canadian Space Agency industrial activities.
-
Civil-related marine includes Canadian Coast Guard industrial activities. See Annex 2 for a comparative analysis of civil marine revenues by type of customer between 2022 and 2024.
-
Civil-related land strictly includes Heavy-duty truck manufacturing and Motor vehicle body and trailer manufacturing industrial activities.
-
Based on Canada’s Defence Industrial Strategy, ‘digital systems’ as a sovereign capability include industrial activities in secure cloud; artificial intelligence; quantum computing and communications; integrated command, control, and communications; and high-assurance communications equipment. Some digital systems embedded in platform-specific mission, communications and/or simulation systems are captured in the industry to which they relate
Revenues, 2014–2024
In 2024, the Canadian defence industry’s revenuesFootnote 7 reached $17.3 billion, increasing more than 85% since 2014Footnote 8
Figure 2: Canadian Defence Industry Revenues, 2014–2024

- Footnote
-
Financial values are in nominal/current terms and are not adjusted for inflation. See Annex 3 for a comparative analysis of defence industry revenues by type of customer between 2022 and 2024
-
Estimates related to 2014 defence industry activities are based on updated 2014 data, which reflect the necessary revisions that occurred after Statistics Canada’s original data release and ISED-CADSI’s 2016 publication of the State of Canada’s Defence Industry, 2014 report. See Annex 4 for a comparative analysis of defence industry key industrial indicators between 2014 and 2024.
Economic Impact
In 2024, the Canadian defence industry contributed over $11.1B in GDP and 81,800 jobs to the Canadian economyFootnote 9
Figure 3: GDP Economic Impact, 2024
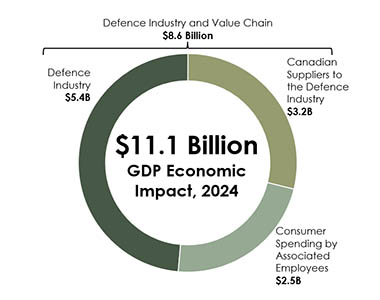
Figure 4: Jobs Economic Impact, 2024

- Between 2022Footnote 10 and 2024, the Canadian defence industry’s contribution to the Canadian economy increased by close to $500 million in GDP and 3,500 jobs
- Footnote
-
Excludes the economic impact of business activities undertaken through the Industrial and Technological Benefits (ITB) Policy that were not involved in defence industry production. Economic impact estimates are not comparable to older estimates reported in previous publications as past foundational data are regularly revised and updated. See Annex 1 for detailed methodology principles.
-
Economic impact estimates for defence activities performed in 2022, published in the State of Canada’s Defence Industry Report, Spring 2024, have been updated using the most relevant (2022) input-output multipliers. This aligns economic impact estimates with Canada’s economic structure at the time industrial activities were performed. See Annex 5 for a comparative analysis of defence industry economic impacts between 2022 and 2024.
Key Industrial Indicators By Firm Size
In 2024, SMBsFootnote 11 represented over 90% of firms in the Canadian defence industry
Figure 5: Key Industrial IndicatorsFootnote 12 by Firm Size

- Between 2022 and 2024, Canadian defence industry SMB revenues grew by more than $700 million to reach over $5.1 billion
- Footnote
-
Small- and medium-businesses (SMBs) are defined as firms with fewer than 500 employees. See Annex 6 for a comparative analysis of defence industry SMB key industrial indicators between 2022 and 2024.
-
Research & Development (R&D) expenditures relate to firms’ in-house R&D.
Key Industrial Indicators By Domain
Canadian defence industry domainsFootnote 13 have distinct industrial characteristics
Figure 6: Key Industrial Indicators by Domain, 2024

- Revenues across all domains grew between 2022 and 2024
- Footnote
-
The grouping of defence goods and services categories by ‘domain’ is determined here by the platform type to which they relate. See Annex 7 for a comparative analysis of category-level defence goods and services revenues by domain between 2022 and 2024, and Annex 15 for the full official titles and definitions of the survey’s defence goods and services categories by domain.
-
The survey’s measurement of ‘Space Systems’ is narrower in scope than the broader concept of the ‘Space Sector’ as measured by the Canadian Space Agency.
-
‘Other Activities’ includes non-platform and cross-domain defence goods and services categories.
Domestic Supply Chains by Domain
In 2024, defence companies operating in Canada sourced, on average, close to 55% of their supply chainFootnote 16 (goods and services) from Canadian-based firms
Figure 7: Share of Canadian Defence Industry’s Supply Chain Sourced from Canadian-based Firms, 2024

- The level of the Canadian defence industry’s domestic sourcing vary across domains
- Footnote
-
Supply chain expenditures reflect the subset of operating expenditures related to the purchase of mainly raw materials and components that are more directly used for/in manufacturing processes and similar maintenance, repair and overhaul (MRO)-type activities.
Regional Breakdown
Each region had specific areas of strength in 2024
Figure 8: Share of Canadian Defence Industry EmploymentFootnote 17 & List of Top Defence Activities by RegionFootnote 18, 2024

- Footnote
-
Shares of employment by region are based on businesses that specified their regional employment breakdown and reflect the 37,700 direct employees in the Canadian defence industry. See Annex 8 for the Top 10 regional defence activities, ranked by employment.
-
Rankings are approximate estimates based on employment shares derived from the ratio of category-level defence goods and services revenues to total defence industry revenues and from the breakdown of total employment by region. As these are simple rankings, the gap between ranked categories could be relatively small or relatively large
Innovation
In 2024, the Canadian defence industry was three times more R&D-intensiveFootnote 19 than the broader manufacturing sector
Figure 9: R&D Intensity, 2024

Figure 10: Share of Canadian Defence Industry R&D Expenditures by Source of FundsFootnote 20, 2024

- Between 2022 and 2024, the Canadian defence industry’s R&D expenditures increased nearly 8% to reach over $477 million
- The share of R&D funded by Canadian government sources increased from close to 15% in 2022 to nearly 25% in 2024
- Footnote
-
Industry-level R&D intensity is measured as the ratio of R&D performed by a given industry or sector relative to its own GDP. At the level of individual defence goods and services categories, R&D to GDP ratios are not available; instead, see Annex 9 for category-level defence goods and services R&D to revenues ratios.
-
Other sources may include universities, foreign governments, individuals, etc. See Annex 10 for a comparative analysis of defence industry R&D expenditures by source of funds between 2022 and 2024.
STEM & Workforce Characteristics
In 2024, the Canadian defence industry’s share of employment in STEMFootnote 21 occupations was over 2.5 times greater than the broader manufacturing sector
Figure 11: STEM Intensity, 2024

Figure 12: Canadian Defence Industry Workforce CharacteristicsFootnote 22, 2024

- Footnote
-
Science, Technology, Engineering, and Mathematics (STEM) occupations include survey categories on engineers, scientists and/or researchers, and technicians and technologists. Industry-level STEM intensity is measured as the ratio of employees in STEM-related occupations in a given industry or sector relative to its total employment. See Annex 11 for category-level defence goods and services STEM to employment ratios.
-
Gender breakdown reflects the 37,700 direct employees in the defence industry. Corporate functions include occupations in management, administration, marketing, and all other employees. See Annex 12 for a comparative analysis of the share of female employees between the defence industry and the broader manufacturing sector.
Exports
In 2024, the Canadian defence industry’s exports grew by $1.0 billion, reaching close to $8.0 billion, of which nearly 70% was to Canada’s Five Eyes partners
Figure 13: Share of Canadian Defence Industry Exports by DestinationFootnote 23, 2024

- An increased share of exports to Europe (excluding the UK) was a driver of Canada’s export growth
Key Findings
In 2022, Canada’s defence industry:
- Generated close to $17.3 billion in revenues
- ➢ Increased revenues across all air & space systems, land & other defence, and marine domains between 2022 and 2024
- Contributed 81,800 jobs to the Canadian economy
- ➢ An increase of 3,500 jobs between 2022 and 2024
- Had small- and medium-businesses (SMBs) that represented over 90% of firms
- ➢ SMB revenues grew by more than $700 million to reach over $5.1 billion between 2022 and 2024
- Had close to 55% of its supply chain sourced from Canadian-based suppliers
- Was three times more R&D-intensive and over 2.5 times more STEM-intensive than the broader manufacturing sector
- Exported close to $8.0 billion in goods and services, an increase of $1.0 billion, of which nearly 70% was to Canada’s Five Eyes partners
Annexes
Annex 1 – Economic Impact Methodology Principles
- ISED’s approach is informed by experts from the Organisation for Economic Co-operation and Development (OECD) and Statistics Canada.
- Foundation data is based on the latest (2024) ISED-sponsored and Statistics Canada-administered Canadian Defence, Aerospace, Marine, and Cybersecurity Industries Survey, released in 2026.
- ISED’s model reflects the economic structure of Canada through Statistics Canada’s latest (2022) Input-Output (I/O) economic impact multipliers.
- ➢ As there is no single statistical/industrial classification for defence activities, each defence industry goods and services category has been linked to the closest related and most relevant specific economic impact multiplier(s).
- ➢ Economic impact estimates for defence activities performed in 2022, published in the State of Canada’s Defence Industry Report, Spring 2024, have been updated using the most relevant (2022) I/O multipliers. This aligns economic impact estimates with Canada’s economic structure at the time industrial activities were performed.
- Total economic impact includes industrial activities performed by the Canadian defence industry value chain, which is specifically comprised of the defence industry (direct economic impact from survey participants) and its Canadian suppliers (indirect economic activity from the Canadian defence industry’s value chain partners), and consumer spending by associated employees (induced economic activity) across the Canadian economy.
- ➢ GDP impact is reported on an annual average basis.
- ➢ Jobs impact is reported on an annual average basis and measured in terms of full-time equivalent (FTE) employment./li>
- ➢ Economic impact estimates are reported at the national level and cannot be broken down at the regional level.
- ➢ Economic impact estimates are not comparable to older estimates reported in previous publications as past foundational data are regularly updated.
- All values are in Canadian nominal/current dollars and are not adjusted for inflation.
Annex 2 – Revenues of Canadian Civil Marine by Type of Customer
|
Type of Customer |
2022 Revenues |
2024 Revenues |
$ Value Change, |
% Change, |
|---|---|---|---|---|
|
Canadian Federal Government |
$659,260,462 |
$1,237,302,129 |
$578,041,667 |
87.7% |
|
Other Domestic Customers |
$836,502,399 |
$1,127,262,030 |
$290,759,631 |
34.8% |
|
Export Customers |
$537,502,744 |
$563,239,060 |
$25,736,315 |
4.8% |
|
Total Civil Marine Revenues |
$2,033,265,605 |
$2,927,803,218 |
$894,537,613 |
44.0% |
Annex 3 – Revenues of the Canadian Defence Industry by Type of Customer
|
Type of Customer |
2022 Revenues |
2024 Revenues |
$ Value Change, |
% Change, |
|---|---|---|---|---|
|
Canadian Federal Government |
$5,173,772,567 |
$6,507,284,764 |
$1,333,512,198 |
25.8% |
|
Other Domestic Customers |
$2,097,709,631 |
$2,757,757,899 |
$660,048,268 |
31.5% |
|
Export Customers |
$7,039,146,000 |
$7,992,053,019 |
$952,907,019 |
13.5% |
|
Total Defence Revenues |
$14,310,628,198 |
$17,257,095,682 |
$2,946,467,484 |
20.6% |
|
Total Defence Revenues |
$2,033,265,605 |
$2,927,803,218 |
$894,537,613 |
44.0% |
Annex 4 – Canadian Defence Industry Key Industrial Indicators
| Key Industry Indicators | 2014 | 2024 | $ Value Change, 2014–2024 |
% Change, 2014–2024 |
|---|---|---|---|---|
|
Revenues |
$9,231,524,542 |
$17,257,095,677 |
$8,025,571,135 |
86.9% |
|
Employment (Number of Direct Jobs) |
26,857 |
37,732 |
10,875 |
40.5% |
|
R&DFootnote 24 (2016 vs. 2024) |
$398,848,412 |
$477,152,939 |
$78,304,528 |
19.6% |
|
Exports |
$5,509,665,830 |
$7,954,511,988 |
$2,444,846,158 |
44.4% |
Annex 5 – Canadian Defence Industry Economic Impact
| GDP Economic Impact (Millions of Dollars) | 2022 | 2024 | $ Value Change, 2022–2024 |
|---|---|---|---|
|
Defence Industry |
$5,174 | $5,420 | $246 |
|
Canadian Suppliers to the Defence Industry |
$3,052 | $3,188 | $136 |
| Defence Industry and Value Chain | $8,226 | $8,608 | $382 |
|
Consumer Spending by Associated Employees |
$2,434 | $2,544 | $110 |
|
Total GDP Economic Impact |
$10,660 | $11,152 | $492 |
|
Jobs Economic Impact (Number of Employees) |
2022 |
2024 |
# Value Change, |
|
Defence Industry |
36,000 |
37,700 |
1,700 |
|
Canadian Suppliers to the Defence Industry |
23,400 |
24,400 |
1,000 |
|
Defence Industry and Value Chain |
59,400 |
62,100 |
2,700 |
|
Consumer Spending by Associated Employees |
18,900 |
19,700 |
800 |
|
Total Jobs Economic Impact |
78,300 |
81,800 |
3,500 |
Annex 6 – Canadian Defence SMB Key Industrial Indicators
|
SMB Key Industrial Indicator |
2022 |
2024 |
Value Change, |
% Change, |
|---|---|---|---|---|
|
Revenues |
$4,421,984,113 |
$5,125,357,418 |
$703,373,304 |
15.9% |
|
Employment (Number of Direct Jobs) |
13,938 |
14,187 |
249 |
1.8% |
|
R&D |
$137,957,342 |
$136,465,741 |
-$1,491,601 |
-1.1% |
|
Exports |
$2,062,469,778 |
$2,069,941,732 |
$7,471,954 |
0.4% |
Annex 7 – Revenues of Defence Goods and Services Categories by Domain
|
Air & Space Systems Defence Goods and Services Categories |
2022 Revenues |
2024 Revenues |
$ Value Change |
% Change |
|---|---|---|---|---|
|
Military Aircraft Maintenance, Repair Overhaul, Modernization or Upgrade Services |
$2,079,143,232 |
$2,165,741,706 |
$86,598,474 |
4.2% |
|
Aircraft Mission Systems & Simulation SystemsFootnote 25 |
$1,685,803,467 |
$2,012,812,491 |
$327,009,024 |
19.4% |
|
Aircraft Fabrication, Structures and Components |
$1,445,924,277 |
$1,754,982,973 |
$309,058,696 |
21.4% |
|
Unmanned Aerial Systems/Vehicles and Components |
$168,930,867 |
$270,868,992 |
$101,938,125 |
60.3% |
|
Military Systems Deployed in Space, Space Launch Vehicles, Land-based Systems for the Operation, Command and Control of Space Launch Vehicles or Systems Deployed in Space and Related Components |
$73,943,779 |
$86,024,784 |
$12,081,005 |
16.3% |
|
Total Air & Space Systems Revenues |
$5,453,745,622 |
$6,290,430,946 |
$836,685,324 |
15.3% |
|
Total Defence Revenues |
$14,310,628,198 |
$17,257,095,677 |
$2,946,467,479 |
20.6% |
|
Land & Other Defence Goods and Services Categories |
2022 Revenues |
2022 Revenues |
$ Value Change |
% Change |
|
Combat and Other Military Ground Vehicles and Components |
$1,975,060,892 |
$1,637,558,991 |
-$337,501,901 |
-17.1% |
|
Land-Based, Vehicle-Borne, Man-Portable or Non-Platform Specific Mission Systems & Simulation SystemsFootnote 26 |
$1,044,917,970 |
$1,133,491,787 |
$88,573,817 |
8.5% |
|
Ammunition, Missiles, and RocketsFootnote 27 |
$633,359,578 |
$847,328,194 |
$213,968,616 |
33.8% |
|
Other Defence |
$528,186,410 |
$804,686,225 |
$276,499,815 |
52.3% |
|
Military Training Services |
$365,918,369 |
$742,242,991 |
$376,324,622 |
102.8% |
|
Combat and Other Military Ground Vehicles Maintenance, Repair, Overhaul, Modernization or Upgrade Services |
$181,838,574 |
$672,983,045 |
$491,144,471 |
270.1% |
|
Military Personal Protective Equipment, Load Carriage Systems and Operational Clothing |
$198,234,077 |
$265,301,219 |
$67,067,142 |
33.8% |
|
Firearms and Other Weapons |
$88,640,495 |
$130,683,798 |
$42,043,303 |
47.4% |
|
Total Land & Other Defence Revenues |
$5,016,156,365 |
$6,234,276,250 |
$1,218,119,885 |
24.3% |
|
Total Defence Revenues |
$14,310,628,198 |
$17,257,095,677 |
$2,946,467,479 |
20.6% |
|
Marine Defence Goods and Services Categories |
2022 Revenues |
2024 Revenues |
$ Value Change |
% Change |
|
Naval Vessel Construction, Conversions, Architecture, Engineering and Related ServicesFootnote 28 |
$1,776,979,321 |
$1,809,206,744 |
$32,227,423 |
1.8% |
|
Naval Ship Maintenance, Repair, Overhaul, Modernization or Upgrade Services |
$1,070,632,031 |
$1,294,516,134 |
$223,884,103 |
20.9% |
|
Naval Vessel Mission Systems & Simulation SystemsFootnote 29 |
$660,399,613 |
$1,101,189,346 |
$440,789,733 |
66.7% |
|
Naval Ships' Structural Elements, Platform Systems, Parts and Components |
$332,715,246 |
$527,476,257 |
$194,761,011 |
58.5% |
|
Total Marine Revenues |
$3,840,726,211 |
$4,732,388,481 |
$891,662,270 |
23.2% |
|
Total Defence Revenues |
$14,310,628,198 |
$17,257,095,677 |
$2,946,467,479 |
20.6% |
Annex 8 –Top Ten Regional Defence Activities, Ranked by Employment (2024)
| Western and Northern Canada |
|---|
|
| Ontario |
|
| Quebec |
|
| Atlantic Canada |
|
Annex 9 – R&D to Revenues Ratios of Defence Goods and Services Categories
|
Rank |
Defence Goods and Services Categories |
2024 R&D to Revenues Ratio |
|---|---|---|
|
1 |
Unmanned Aerial Systems/Vehicles and Components |
6% < X ≤ 9% |
|
2 |
Aircraft Mission Systems and Simulation Systems |
3% < X ≤ 6% |
|
3 |
Other Defence |
3% < X ≤ 6% |
|
4 |
Combat Vehicles and Components & Combat Vehicles Maintenance, Repair and OverhaulFootnote30 |
3% < X ≤ 6% |
|
5 |
Military Training Services |
3% < X ≤ 6% |
|
6 |
Land-Based, Vehicle-Borne, Man-Portable or Non-Platform Specific Mission Systems & Simulation Systems |
3% < X ≤ 6% |
|
7 |
Aircraft Fabrication, Structures and Components |
3% < X ≤ 6% |
|
8 |
Naval Vessel Mission Systems & Simulation Systems |
3% < X ≤ 6% |
|
9 |
Military Systems Deployed in Space, Space Launch Vehicles, Land-based Systems for the Operation, Command and Control of Space Launch Vehicles or Systems Deployed in Space and Related Components |
3% < X ≤ 6% |
|
10 |
Military Personal Protective Equipment, Load Carriage Systems and Operational Clothing |
0% ≤ X ≤ 3% |
|
11 |
Ammunition, Missiles, and Rockets |
0% ≤ X ≤ 3% |
|
12 |
Firearms and Other Weapons |
0% ≤ X ≤ 3% |
|
13 |
Naval Ships' Structural Elements, Platform Systems, Parts and Components |
0% ≤ X ≤ 3% |
|
14 |
Military Aircraft Maintenance, Repair Overhaul, Modernization or Upgrade Services |
0% ≤ X ≤ 3% |
|
15 |
Naval Ship Maintenance, Repair, Overhaul, Modernization or Upgrade Services |
0% ≤ X ≤ 3% |
|
16 |
Naval Vessel Construction, Conversions, Architecture, Engineering and Related Services |
0% ≤ X ≤ 3% |
|
NA |
Total Defence Industry |
0% ≤ X ≤ 3% |
|
|
Annex 10 – Canadian Defence Industry R&D Expenditures by Source of Funds
|
Source of Funds |
2022 R&D |
2024 R&D |
$ Value Change |
% Change |
|---|---|---|---|---|
|
Defence Industry Firms’ Internal FundsFootnote31 |
$325,707,385 |
$313,044,905 |
-$12,662,480 |
-3.9% |
|
Contract Work for Other Firms & Private Non-profits |
$15,125,328 |
$8,541,734 |
-$6,583,594 |
-43.5% |
|
Total Defence Industry |
$340,832,714 |
$321,586,640 |
-$19,246,074 |
-5.6% |
|
Government Contracts |
$50,228,425 |
$62,205,726 |
$11,977,301 |
23.8% |
|
Government Grants |
$11,988,846 |
$49,086,987 |
$37,098,141 |
309.4% |
|
Total Government Contracts & Grants |
$62,217,271 |
$111,292,715 |
$49,075,444 |
78.9% |
|
Other Sources (Universities, Foreign Governments, Individuals, etc.) |
$40,542,755 |
$44,273,584 |
$3,730,829 |
9.2% |
|
Total R&D Expenditures |
$443,592,739 |
$477,152,939 |
$33,560,200 |
7.6% |
Annex 11 – STEM to Employment Ratios of Defence Goods and Services Categories
|
Rank |
Defence Goods and Services Categories |
2024 STEM to Employment Ratio |
|---|---|---|
|
1 |
Naval Vessel Mission Systems & Simulation Systems |
50% ≤ X ≤ 60% |
|
2 |
Aircraft Mission Systems and Simulation Systems |
40% ≤ X ≤ 50% |
|
3 |
Land-Based, Vehicle-Borne, Man-Portable or Non-Platform Specific Mission Systems & Simulation Systems |
40% ≤ X ≤ 50% |
|
4 |
Military Training Services |
40% ≤ X ≤ 50% |
|
5 |
Unmanned Aerial Systems/Vehicles and Components |
40% ≤ X ≤ 50% |
|
6 |
Military Systems Deployed in Space, Space Launch Vehicles, Land-based Systems for the Operation, Command and Control of Space Launch Vehicles or Systems Deployed in Space and Related Components |
40% ≤ X ≤ 50% |
|
7 |
Other Defence |
40% ≤ X ≤ 50% |
|
8 |
Naval Ships' Structural Elements, Platform Systems, Parts and Components |
40% ≤ X ≤ 50% |
|
9 |
Military Aircraft Maintenance, Repair Overhaul, Modernization or Upgrade Services |
20% ≤ X ≤ 30% |
|
10 |
Naval Vessel Construction, Conversions, Architecture, Engineering and Related Services |
20% ≤ X ≤ 30% |
|
11 |
Naval Ship Maintenance, Repair, Overhaul, Modernization or Upgrade Services |
20% ≤ X ≤ 30% |
|
12 |
Combat and Other Military Ground Vehicles Maintenance, Repair, Overhaul, Modernization or Upgrade Services |
20% ≤ X ≤ 30% |
|
13 |
Ammunition, Missiles, and Rockets |
20% ≤ X ≤ 30% |
|
14 |
Aircraft Fabrication, Structures and Components |
10% ≤ X ≤ 20% |
|
15 |
Combat and Other Military Ground Vehicles and Components |
10% ≤ X ≤ 20% |
|
16 |
Firearms and Other Weapons |
10% ≤ X ≤ 20% |
|
17 |
Military Personal Protective Equipment, Load Carriage Systems and Operational Clothing |
0% ≤ X ≤ 10% |
|
NA |
Total Defence |
30% ≤ X ≤ 40% |
Annex 12 – Share of Female Employees by Occupation (2024)
|
Occupation |
Canadian Defence Industry |
Broader Manufacturing Sector |
|---|---|---|
|
STEM Employees |
18% |
22% |
|
Production Workers |
25% |
23% |
|
Corporate Functions |
38% |
52% |
|
Total |
27% |
29% |
Annex 13 – Canadian Defence Industry Exports by Destination
|
Destination |
2022 Exports |
2024 Exports |
$ Value Change |
% Change |
|
United States |
$4,431,692,402 |
$5,005,966,280 |
$574,273,878 |
13.0% |
|
Europe (excludes UK) |
$750,267,518 |
$1,334,435,495 |
$584,167,977 |
77.9% |
|
Middle East and Africa |
$864,553,528 |
$691,100,459 |
-$173,453,069 |
-20.1% |
|
Asia and Oceania (excludes AU & NZ) |
$436,801,294 |
$385,720,936 |
-$51,080,358 |
-11.7% |
|
United Kingdom (UK) |
$341,528,766 |
$321,462,432 |
-$20,066,334 |
-5.9% |
|
Central America, the Caribbean, Mexico, and South America |
$163,095,058 |
$167,001,286 |
$3,906,228 |
2.4% |
|
Australia (AU) |
$48,812,468 |
$58,716,433 |
$9,903,965 |
20.3% |
|
New Zealand (NZ) |
$2,394,966 |
$27,649,697 |
$25,254,731 |
1054.5% |
|
Total Exports |
$7,039,146,000 |
$7,992,053,019 |
$952,907,019 |
13.5% |
Annex 14 – Exports' Share of Revenues, Defence Goods and Services Categories Ranked by Export Intensity (2022)
|
Rank |
Defence Goods and Services Categories |
2024 Exports to Revenues Ratio |
|
1 |
Aircraft Fabrication, Structures and Components |
60% ≤ X ≤ 80% |
|
2 |
Aircraft Mission Systems and Simulation Systems |
60% ≤ X ≤ 80% |
|
3 |
Ammunition, Missiles, and Rockets |
60% ≤ X ≤ 80% |
|
4 |
Combat Vehicles and Components & Combat Vehicles Maintenance, Repair and OverhaulFootnote 32 |
40% ≤ X ≤ 60% |
|
5 |
Military Systems Deployed in Space, Space Launch Vehicles, Land-based Systems for the Operation, Command and Control of Space Launch Vehicles or Systems Deployed in Space and Related Components |
40% ≤ X ≤ 60% |
|
6 |
Military Aircraft Maintenance, Repair Overhaul, Modernization or Upgrade Services |
40% ≤ X ≤ 60% |
|
7 |
Land-Based, Vehicle-Borne, Man-Portable or Non-Platform Specific Mission Systems & Simulation Systems |
40% ≤ X ≤ 60% |
|
8 |
Naval Ships' Structural Elements, Platform Systems, Parts and Components |
40% ≤ X ≤ 60% |
|
9 |
Unmanned Aerial Systems/Vehicles and Components |
40% ≤ X ≤ 60% |
|
10 |
Firearms and Other Weapons |
20% ≤ X ≤ 40% |
|
11 |
Other Defence |
20% ≤ X ≤ 40% |
|
12 |
Military Personal Protective Equipment, Load Carriage Systems and Operational Clothing |
20% ≤ X ≤ 40% |
|
13 |
Naval Vessel Mission Systems & Simulation Systems |
20% ≤ X ≤ 40% |
|
14 |
Military Training Services |
0% ≤ X ≤ 20% |
|
15 |
Naval Ship Maintenance, Repair, Overhaul, Modernization or Upgrade Services |
0% ≤ X ≤ 20% |
|
16 |
Naval Vessel Construction, Conversions, Architecture, Engineering and Related Services |
0% ≤ X ≤ 20% |
|
NA |
Total Defence Industry |
40% ≤ X ≤ 60% |
Annex 15 – Official Definitions of Defence Goods and Services Categories by Domain
| Air & Space SystemsFootnote 38 |
|---|
|
Aircraft fabrication, structures, and components This category includes sales related to production as well as research, development, design, engineering, testing, and evaluation services relating to: Military aircraft, and military aircraft structural elements, control surfaces, systems, sub-systems, parts and components of manned military aerial platforms, and complete manned military aerial platforms, intended for use in combat and military transport. This includes things like landing gear (e.g., wheels, shock absorbers and related parts for the retraction and extension of aircraft landing gear, helicopter pontoons); flight control actuators; and propulsion and power systems for military aircraft (e.g., aircraft gas turbine engines, compressors, fuel systems). Excluded from this category are sales related to military aircraft maintenance, repair and overhaul (MRO) services; aircraft communication systems; navigation systems; avionics; air-borne sensors; missiles, rockets and projectiles made to be fired from aerial platforms; display units; and other electronics for manned military aerial platforms—these are to be reported under separate defence product and service categories as appropriate. Military aircraft maintenance, repair, overhaul, modernization, or upgrade services
EXCLUDED from this category are:
Military systems deployed in space, space launch vehicles, land-based systems for the operation, command and control of space launch vehicles or systems deployed in space, and related components
Primarily airborne communications and navigation systems; and other information systems (including processing and dissemination), software, electronics and components
Note: sales relating to similar systems, but which are integrated into naval vessels should be reported under the category for “Naval Ship-Borne Mission Systems and Components.” Primarily airborne electro-optical, radar, sonar, and other sensor / information collection systems; fire control, warning and countermeasures systems, and related components
Note: sales relating to similar systems, parts, and components but which are integrated into naval vessels should be reported under the category for “Naval Ship-Borne Mission Systems and Components.” Simulation systems for aircraft Unmanned aerial systems and vehicles and components Excluded are sales relating to missiles; or to weapon systems (e.g., guns, missile launchers) and ammunition, munitions, and missiles carried on/delivered by unmanned aerial systems or vehicles. Such sales should be reported under either the category for “Firearms and other weapons” or under the category for “Missiles & rockets.” |
| Land and Other Defence |
|
Ammunition and other munitions This category includes sales related to production as well as research, development, design, engineering, testing and evaluation services, and disposal activities such as relating to:
Excluded are sales of missiles, rockets and other related parts and components which should be reported under the category for “Missiles and Rockets.” Combat and other military ground vehicles and components Excluded are sales such as of:
Excluded entirely from the survey are any sales relating to consumer, commercial or industrial vehicles sold to militaries. Combat and other military ground vehicles maintenance, repair, overhaul, modernization, and upgrade services
Excluded from this category are sales relating to
Excluded entirely from the survey any sales relating to consumer, commercial or industrial vehicles that happen to be sold to militaries. Firearms and other weapons
Military personal protective equipment, load carriage systems and operational clothing
Excluded from this category are sales relating to:
Military training services
Excluded are sales:
Missiles and Rockets Excluded here are sales relating to:
Those are to be reported under either the categories for “Ammunition and Other Munitions” or for military space systems as appropriate. Primarily land-based, ground vehicle-borne, man-portable, or non-platform specific communications and navigation systems; and other Information systems (including processing and dissemination), software, electronics and components
Note: sales relating to similar systems, but which are integrated into naval vessels should be reported under the category for “Naval Ship-Borne Mission Systems and Components.” Primarily land-based ground vehicle borne, man-portable or non-platform specific electro-optical, radar, sonar, and other sensor/information collection systems; fire control, warning, and countermeasures systems, and related components
Note: sales relating to similar systems, parts, and components but which are integrated into naval vessels should be reported under the category for “Naval Ship-Borne Mission Systems and Components.” Simulation systems for land vehicles or other applications This category includes sales related to production as well as research, development, design, engineering, testing and evaluation services for the hardware and software technologies used by military and security forces to develop, experiment and test operational doctrines and to train personnel using situational scenarios (e.g., intelligent software, visual systems, network simulations, real-time simulators) as primarily related to naval vessels and operations in the maritime-domain. All other defence (specify) This category includes sales that could not otherwise be captured under other specified defence goods and services categories, and which are earned from designing, engineering, testing, evaluating, producing, providing, maintaining, upgrading, modernizing or performing research and development for systems and services specifically designed or adapted for (and generally restricted to) use by militaries to conduct operations, and that perform military functions or missions; and related subsystems, components or parts limited in use or specific to such military systems or services and the performance of military specific functions. To be in-scope, the industrial activities of businesses must also involveactual production and provision of such goods and services by their employees located in Canada. Excluded are sales of:
|
| Marine |
|
Naval ship maintenance, repair, overhaul, modernization, or upgrade services This category includes sales of:
Excluded from this category are:
Sales of such goods and services should instead be reported as most appropriate under the goods and services categories for “Naval ship-borne mission systems and components” and “Naval ships structural elements, platform systems, parts and components.” Naval ship’s structural elements, platform systems, parts & components (excluding shipborne naval mission systems) Excluded from this category are sales:
Naval ship-borne mission systems and components Excluded from this category are sales related to the actual missiles, torpedoes and other munitions or projectiles launched or fired from/by naval vessels’ weapon systems, as well as associated warheads. Such sales are to be reported under either the category for “Missiles and Rockets” or the category for “Ammunition and Other Munitions” as appropriate. Naval vessel architecture, engineering, certification, and related professional services
Exclude from this category
New naval vessels constructed by shipyards, and naval conversions
Excluded from this category are sales:
Further exclusions or guidance: if the business is not a shipyard in Canada but was nonetheless responsible for, (and paid by a government/military for progress on) the eventual delivery of naval vessels being assembled by a shipyard in Canada that is not its subsidiary, or otherwise owned by the business or by a common parent company—then, such a business should not report sales figures which include the amount of associated sales made by the shipyard(s). For such businesses, they should only report any relevant sales relating to work done by their respective operations’ employees in Canada, which exclude the sales value of work the businesses contracted/subcontracted or passed through to shipyards in Canada. This is necessary to prevent potential large scale double counting of the actual value of naval vessels being delivered by shipyards in Canada, and hence overestimation of the actual volume of associated industrial activity at shipyards in Canada. Simulation systems for naval vessels
|
- Footnote
-
Defence industry R&D expenditures from 2014 could not be used for comparisons over time, with the 2016 value used instead. Among firms accounting for 50.1% of 2014 defence industry revenues, it could not be determined if they performed in-house R&D and/or the value of such spending. The 2014 R&D value is more likely to notably understate actual R&D in that year and cannot be regarded as statistically representative of the overall defence industry with sufficient confidence.
-
Data from the survey’s “Primarily Airborne Communications and Navigation Systems; and Other Information Systems (Including Processing and Dissemination), Software, Electronics and Components,” “Primarily Airborne Electro-Optical, Radar, Sonar and Other Sensor/Information Collection Systems; Fire Control, Warning and Countermeasures Systems and Related Components” and “Simulation Systems for Aircraft” categories were merged by Statistics Canada to meet the confidentiality requirements of the Statistics Act.
-
Data from the survey’s “Primarily Land-Based, Ground Vehicle-Borne, Man-Portable or Non-Platform Specific Communications and Navigation Systems; and Other Information Systems (Including Processing and Dissemination), Software, Electronics and Components,” “Primarily Land-Based, Ground Vehicle-Borne, Man-Portable or Non-Platform Specific Electro-Optical, Radar, Sonar and Other Sensor/Information Collection Systems; Fire Control, Warning and Countermeasures Systems and Related Components” and “Simulation Systems for Land Vehicles or Other Applications” categories were merged by Statistics Canada to meet the confidentiality requirements of the Statistics Act.
-
Data from the survey’s “Ammunition and Other Munitions” and “Missiles and Rockets” categories were merged by Statistics Canada to meet the confidentiality requirements of the Statistics Act.
-
Data from the survey’s “New Naval Vessels Constructed by Shipyards and Naval Conversions” and “Naval Vessel Architecture, Engineering, Certification, and Other Professional Services” categories were merged by Statistics Canada to meet the confidentiality requirements of the Statistics Act.
-
Data from the survey’s “Naval Ship-borne Mission Systems and Components” and “Simulation Systems for Naval Vessels” categories were merged by Statistics Canada to meet the confidentiality requirements of the Statistics Act.
-
The survey’s “Combat and Other Military Ground Vehicles and Components” and “Combat and Other Military Ground Vehicles Maintenance, Repair, Overhaul, Modernization and Upgrade Services” categories were merged by Statistics Canada to provide a R&D to revenues ratio estimate more certain to be representative of the combined set of associated activities than individual estimates.
-
Firm internal R&D funds also include funds from the firm’s parent, affiliates and subsidiary companies.
-
The survey’s “Combat and Other Military Ground Vehicles and Components” and “Combat and Other Military Ground Vehicles Maintenance, Repair, Overhaul, Modernization and Upgrade Services” categories were merged by Statistics Canada to provide an exports to revenues ratio estimate more certain to be representative of the combined set of associated activities than individual estimates.
Data Sources
|
|