
1. Introduction
This Quarterly Financial Report (QFR) has been prepared by management as required by section 65.1 of the Financial Administration Act, in the form and manner prescribed by the Treasury Board. This document should be read in conjunction with the Main Estimates and Supplementary Estimates for fiscal year 2020–21.
1.1 Our organization
Innovation, Science and Economic Development Canada (ISED) works with Canadians in all areas of the economy and in all parts of the country to improve conditions for investment, enhance Canada's innovation performance, increase Canada's share of global trade and build a fair, efficient and competitive marketplace.
ISED helps Canadian businesses grow, innovate and expand so they can create good-quality jobs and wealth for Canadians. It also supports science research and the integration of scientific considerations into investment and policy choices. The Department helps small businesses grow through trade and innovation and promotes increas ed tourism in Canada. The Department also works to position Canada as a global centre for innovation where investments support clean and inclusive growth, the middle class prospers through more job opportunities and companies become global leaders.
ISED's efforts focus on improving conditions for investment, supporting science, helping small and medium-sized businesses grow, building capacity for clean and sustainable technologies and processes, increasing Canada's share of global trade, promoting tourism, and building an efficient and competitive marketplace.
A summary description of Innovation, Science and Economic Development Canada's core responsibilities can be found in Part II of the Estimates.
1.2 Basis of presentation
The authority of Parliament is required before moneys can be spent by the government. Approvals are given in the form of annually approved limits through appropriation acts or through legislation for specific purposes. The accompanying Statement of Authorities includes the department's spending authorities granted by Parliament, and those used by the department consistent with the Main Estimates and Supplementary Estimates (as applicable) for the 2020–21 fiscal year. This report has been prepared using a special purpose financial reporting framework designed to meet financial information needs with respect to the use of spending authorities.
As part of the departmental performance reporting process, ISED prepares its annual departmental financial statements on a full accrual basis in accordance with Treasury Board accounting policies, which are based on Canadian Generally Accepted Accounting Principles for the public sector. The spending authorities are voted by Parliament on an expenditure basis. Therefore, management has prepared this report using an expenditure basis of accounting.
The accompanying Statement of Authorities includes ISED's spending authorities granted by Parliament, which includes the 2020–21 Main and Supplementary Estimates as well as any adjustments, warrants and transfers.
This report has not been subject to an external audit or review. However, it has been reviewed by ISED's Departmental Audit Committee (DAC) in accordance with Treasury Board guidance. No material misstatements or omissions have been identified.
In the event that Parliament is dissolved for the purposes of a general election, section 30 of the Financial Administration Act authorizes the Governor General, under certain conditions, to issue a special warrant authorizing the Government to withdraw funds from the Consolidated Revenue Fund. A special warrant is deemed an appropriation for the fiscal year in which it is issued.
1.3. General Descriptions
The following descriptions are referred to throughout the report:
- Authority: Approvals from Parliament to spend up to a specific amount.
- Operating (Vote 1): Amount approved for the fiscal year for the Department to spend on salary and operating expenditures.
- Capital (Vote 5): Amount approved for the fiscal year for the Department to spend on capital purchases or for the construction of assets.
- Grants and Contributions (Vote 10 and Statutory):
- Vote 10: Amount approved for the fiscal year for the Department to provide Grants and Contribution (G&C) funding to prospective recipients.
- Statutory: Amount approved through an existing Act of Parliament where additional annual approvals are not required by the Department to access G&C funding for recipients.
- Operating and Capital Carry Forward: Eligible funds lapsed in the previous fiscal year brought forward to the following year.
- Employee Benefit Plan (EBP): The department's contribution to public service employee benefit plans.
- Vote Netted Revenue (VNR): Authority to apply revenues earned by the organization to cover costs incurred for specific activities by that organization.
- Standard Object (SO): Classification or coding of transactions to permit the reporting of information about the nature of transactions in the Estimates and Public Accounts (i.e. personnel, professional and special services, and transfer payments).
2. Highlights of fiscal quarter and fiscal year-to-date (YTD) results
The variances in authorities available for use in 2020–21, versus 2019–20, primarily result from variances in the Grants and Contributions authorities and are attributable to the increases in funding for the Strategic Innovation Fund, the Innovation Superclusters Initiative, and the Canadian Foundation for Sustainable Development Technology. These amounts were largely offset by the winding down of Post-Secondary Institutions Strategic Investment Fund (PSI-SIF) as well as the reduced supply of Main Estimates. Variances in authorities used are mainly due to timing differences with regard to payments between periods for programs such as the Innovation Superclusters Initiative, Futurepreneur Canada and Canada Foundation for Sustainable Development Technology, as well as higher spending for the Community Futures program.
2.1 Authorities available for use and planned expenditures
ISED's current total authorities available for use of $3.0 billion at the end of the first quarter in 2020–21, is $70.4 million higher than the same period in 2019–20. This is illustrated in Graph 1 below, in the Statement of Authorities and in Table 1: Departmental Budgetary Expenditures by Standard Object (Table 1). However, it is important to note that $637.5 million of the Main Estimates was withheld as ISED is only expected to receive full supply for the 2020–21 Main Estimates in December 2020 due to the COVID-19 pandemic and limited sessions in the spring for Parliament to study supply. As a result, please note the reference to the funding decreases due to the reduced supply in the variance explanations.
Graph 1: Comparison of Total Net Budgetary Authorities Available for Use as of June 30, 2020 and June 30, 2019
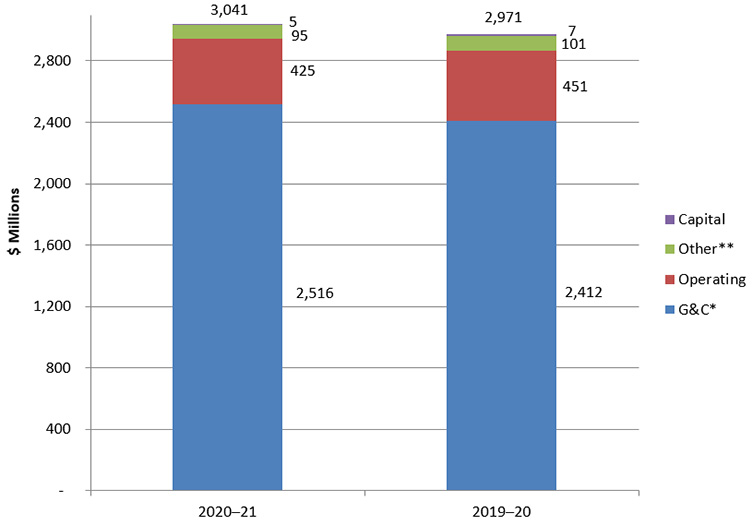
* Includes Vote 10 and Statutory Grants and Contributions expenditures
** Includes CIPO Revolving Fund
The overall increase includes:
- Grants and Contributions (Vote 10 and Statutory): $103.9 million
- Net Operating Expenditures (Vote 1): $25.7 million
- Capital Expenditures (Vote 5): $1.8 million
- Other: $6.0 million
- CIPO Revolving Fund: $6.1 million
- Employee Benefit Plan (EBP): $0.3 million
- Other: $0.2 million
Variances for each appropriation are explained in detail throughout this document.
2.1.1 Highlights of Changes by Authority (2020–21 compared to 2019–20)
The following tables highlight the larger changes in authorities available for use, as reported in the Statement of Authorities (unaudited):
| Grants and Contributions (Vote 10 and Statutory) | Increase/ (Decrease) in millions of dollars | |
|---|---|---|
| Vote 10 Authority | ||
| New Funding from COVID-19 Announcements | ||
| Strategic Innovation Fund | $ 538.7 | |
| Genome Canada | 25.9 | |
| Community Futures Program | 25.5 | |
| Regional Economic Growth through Innovation | 23.4 | |
| Futurpreneur Canada | 11.2 | |
| Funding increase for programs with new funding from Budget 2019 | ||
| Strategic Innovation Fund | 90.1 | |
| Genome Canada | 9.1 | |
| Funding increases based on cash flow requirements of existing programs | ||
| Innovation Superclusters Initiative | 75.8 | |
| Canada Foundation for Sustainable Development Technology | 72.1 | |
| Canada Foundation for Innovation | 13.6 | |
| CANARIE Inc. | 12.2 | |
| Funding decreases based on cash flow requirements of existing programs | ||
| Post-Secondary Institutions Strategic Investment Fund | (78.6) | |
| Connect to Innovate Program | (46.4) | |
| Strategic Aerospace Defence Initiative | (26.1) | |
| Patent Collective Pilot Program | (20.0) | |
| Programs for which funding has ended | ||
| Bombardier C-Series | (19.5) | |
| Other minor items, net | 0.4 | |
| For comparability purposes, total funding variance in Vote 10 includes total authorities requested in Main Estimates (Full Supply) | 707.4 | |
| Variance attributable to the reduced supply which represents 9/12th of the Main Estimates | (597.3) | |
| TOTAL CHANGE IN Vote 10 Authority | $110.1 | |
| Statutory Authorities | ||
| Programs for which funding has increased | ||
| Canada Small Business Financing Act | 3.7 | |
| Canadian Institute for Advanced Research (CIFAR) - Pan Canadian Artificial Intelligence | 1.5 | |
| Programs for which funding has decreased | ||
| Genome - Contributions | (11.4) | |
| TOTAL CHANGE IN Statutory Authorities | $ (6.2) | |
| TOTAL CHANGE IN Grants & Contributions (Vote 10 and Statutory) | $103.9 | |
| Net Operating Expenditures Authority (Vote 1) | Increase/ (Decrease) in millions of dollars |
|---|---|
| New Funding from COVID-19 Announcements: | |
National Medical Research Strategy | $ 2.7 |
Support small and medium-sized businesses | 0.4 |
| Funding increase for programs with new funding from Budget 2019: | |
Preparing for a New Generation of Wireless Tech - 5G | 10.0 |
| Changes in Approved Reference Levels for Operating Expenditure: | |
Collective agreements | 7.6 |
Business Innovation & Forest sector | 2.5 |
Advertising Initiatives | (1.0) |
Surveying the impact of Digital Technology | (1.8) |
Increasing Diversity in Science | (2.0) |
Strategic Innovation Fund | (4.8) |
| Other minor items, net | (1.0) |
| For comparability purposes, total funding variance in Vote 1 includes total authorities requested in Main Estimates (Full Supply) | 12.6 |
| Variance attributable to the reduced supply which represents 11/12th of the Main Estimates | (38.3) |
| TOTAL CHANGE IN Net Operating Expenditures Authority (Vote 1) | $ (25.7) |
| Capital Expenditures Authority(Vote 5) | Increase/ (Decrease) in millions of dollars |
|---|---|
| Preparing for a New Generation of Wireless Tech (5G) | $ 0.8 |
| New Intellectual Property Strategy | (0.7) |
| For comparability purposes, total funding variance in Vote 5 includes total authorities requested in Main Estimates (Full Supply) | 0.1 |
| Variance attributable to the reduced supply which represents 9/12th of the Main Estimates | (1.9) |
| TOTAL CHANGE IN Capital Expenditures Authority (Vote 5) | $ (1.8) |
| Other | Increase/ (Decrease) in millions of dollars |
|---|---|
| The increase in planned Employee Benefit costs is due to an increase to the prescribed EBP rate used to estimate the employee benefit plan costs, the funding received for the COVID-19 measures and various Budget 2019 initiatives. | $ 0.3 |
| CIPO's Revolving Fund Net expenditures variance is due to an increase of $16 million in planned revenues related to the new international trademark treaties, partially offset by a $12 million increase in planned salary expenditures. The remaining balance is mainly attributable to lower capital expenditures, as the legislative projects will be completed in 2020-21. | (6.1) |
| The decrease in the Ministers' Car Allowance is attributable to the reduction in the number of ministers responsible for the department's portfolio. There were four ministers in 2019–20 and only two in 2020-21. | (0.2) |
| TOTAL CHANGE IN Other | $ (6.0) |
2.1.2 Highlights of Changes in Planned Expenditures (2020–21 compared to 2019–20)
Table 1: Departmental Budgetary Expenditures by Standard Object displays initial planned expenditure plans. These plans are subject to change during the fiscal year. The annual variances in planned expenditures are primarily due to the following:
| Spending Category | Explanation of significant changes | Planned Increase/ (Decrease) in millions of dollars |
|---|---|---|
| (2020–21 compared to 2019–20) | ||
| Standard Object | ||
| Personnel | The increase is primarily related to new funding received from 2020 COVID-19 Announcements, Budget 2019 and compensation to employees (collective agreements). | $ 27.8 |
| Professional Services | The increase is mainly attributable to CIPO's reclassification of capital projects spending authorities from Acquisition of machinery and equipment to Professional Services to better reflect the nature of the expenditures. | 20.7 |
| Acquisition of machinery and equipment | As noted above, the decrease is mainly attributable to CIPO's reclassification of capital projects spending authorities from Acquisition of machinery and equipment to Professional Services. | (20.6) |
| Transfer Payments | Significant changes have been explained in Section 2.1.1. | 701.2 |
| Changes in Revenues netted against Program Expenditures | ||
| Revenues netted against expenditures: | The increase in CIPO's Revolving Fund planned revenues is mainly due to the new international trademark treaties. | (16.3) |
| Other minor items, net | (4.9) | |
| For comparability purposes, total funding variance includes total authorities requested in Main Estimates (Full Supply) | 707.9 | |
| Variance due to the reduced supply of the Main Estimates explained in Section 2.1.1 | (637.5) | |
| TOTAL CHANGE IN Planned Expenditures | $ 70.4 | |
2.2 Authorities used and actual expenditures
Authorities used and actual expenditures for the first quarter of 2020–21 have increased by $142.5 million when compared to the same period last year (see Graph 2 below, the Statement of Authorities, and Table 1: Departmental Budgetary Expenditures by Standard Object). The differences occurred primarily in Grants and Contributions (Vote 10) and are largely attributable to timing variances of payments, as well as higher spending requirements.
Graph 2: Comparison of Net First Quarter Authorities used and expended as at June 30, 2020 and June 30, 2019
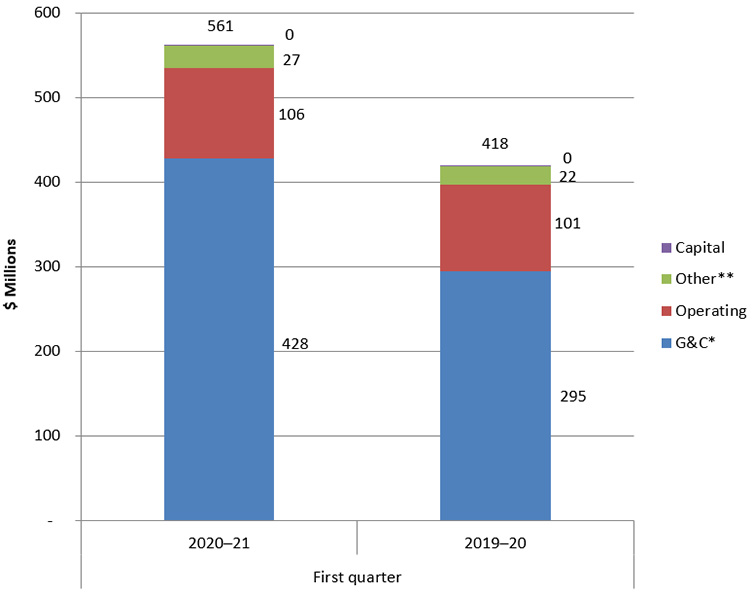
* Includes Vote 10 and Statutory Grants and Contributions expenditures
** Includes CIPO Revolving Fund
By category, the authorities used and expended compared to the same time last year has changed as follows:
- Grants and Contributions (Vote 10 and Statutory): $133.3 million
- Net Operating Expenditures (Vote 1): $4.5 million
- Capital Expenditures (Vote 5): $0.1 million
- Other: $4.6 million
- CIPO Revolving Fund: $4.4 million
- Other minor items including EBP: $0.2 million
Section 2.2.1 provides a detailed breakdown of the changes in authorities used in the First Quarter.
2.2.1 Highlights of Changes in Authorities used for the First Quarter
The following tables highlight, by authority, the larger changes in net expenditures:
| Grants and Contributions Authorities Used (Vote 10 and Statutory) | Increase/ (Decrease) in millions of dollars |
|---|---|
| Q1 | |
| Higher approved spending requirements submitted by recipients | |
| Community Futures Program | $ 26.2 |
| Timing variances between periods (payments are made in different quarters between fiscal years) | |
| Innovation Superclusters Initiative | 54.8 |
| Futurepreneur Canada | 27.8 |
| Canada Foundation for Sustainable Development Technology | 23.8 |
| Other minor items, net | 0.7 |
| TOTAL CHANGE IN Grants and Contributions Authorities Used (Vote 10 and Statutory) | $133.3 |
| Net Operating Expenditures Used (Vote 1) | Increase/ (Decrease) in millions of dollars |
|---|---|
| Q1 | |
Operating expenditures:
| $ (3.3) |
Revenue credited to vote:
| 7.8 |
| TOTAL CHANGE IN Net Operating Expenditures Authorities Used (Vote 5) | $ 4.5 |
| Capital Expenditures Used (Vote 5) | Increase/ (Decrease) in millions of dollars |
|---|---|
| Q1 | |
Other minor items, net | $ 0.1 |
| TOTAL CHANGE IN Capital Expenditures Used (Vote 5) | $ 0.1 |
| Other Authorities Used | Increase/ (Decrease) in millions of dollars |
|---|---|
| Q1 | |
Increase in Revolving Fund Net expenditures is attributed to a $6.7 million reduction in revenues and a $2.3 million decrease in expenses for CIPO. The revenue decrease is mainly attributable to a lower volume of applications (primarily due to COVID-19) for trademarks and industrial design, as well as trademark renewals and patent maintenance fees. Expenses are lower compared to the same period last year as a result of the close out of IT legislative projects. | $ 4.4 |
Other minor items, net | 0.2 |
| TOTAL CHANGE IN Other Authorities Used | $ 4.6 |
2.2.2 Highlights of Changes in Actual Expenditures (2020–21 compared to 2019–2020)
Variances in actual expenditures by standard object ( Table 1: Departmental Budgetary Expenditures by Standard Object) are primarily due to the following:
| Spending Category | Explanation of significant changes | Increase/ (Decrease) in millions of dollars |
|---|---|---|
| (2020–21 compared to 2019–20) | Q1 | |
| Standard Object | ||
| Personnel | The increase is primarily due to increased FTEs related to staffing for new programs as well as payments stemming from collective agreements. | $ 6.4 |
| Transportation and communications | The decrease in expenditures is primarily due to COVID-19 travel restrictions. | (2.5) |
| Information | The variance is due to lower database subscription fees, advertising and printing costs as a result of COVID-19. | (1.4) |
| Professional Services | The decrease in professional services is due to the slowdown of activities related to COVID-19. | (6.1) |
| Transfer payments | Significant changes have been explained in Section 2.2.1. | 133.3 |
| Revolving Fund Revenues | The decrease is due to a lower volume of applications (primarily due to COVID-19) for trademarks and industrial design, as well as trademark renewals and patent maintenance fees. | 6.7 |
| Sales of Services | The decrease in sales of services is related to the slowdown in activities related to COVID 19 and various delays/deferrals of payments. | 7.8 |
| Other minor items, net | (1.7) | |
| TOTAL CHANGE IN Budgetary expenditures | $ 142.5 | |
3. Significant changes in relation to operations, personnel and programs
The COVID-19 pandemic has had an unprecedented impact on global health and economic well-being. The unforeseen and sudden use of lockdown measures and the shutdown of borders, intended to limit the spread of COVID-19, had immediate consequences on workforce availability, supply chains and trade. Although they reduced the spread of the virus, these measures also led to a slowdown of economic activity across Canada, increasing unemployment.
Through the Government of Canada's COVID-19 Economic Response Plan, ISED has swiftly adjusted its programming to support measures aimed at protecting the health of Canadians and stabilizing the Canadian economy. These measures include investing in retooling industry to support the manufacturing of personal protective equipment, research in medical counter measures to identify, fight and prevent COVID-19, and the expansion of Canada's digital infrastructure to ensure that Canadians can make the most of the digital economy no matter where they live. For a more detailed breakdown on program and initiative funding due to COVID-19, please refer to Section 2.1.1.
With regard to operations, there has been significant shift to telework to encourage social distancing and to limit the spread of the virus. ISED has been very effective in ensuring sufficient access to virtual private networks (VPN) to allow their employees to continue with regular work activities and deliver on their work objectives. In particular, ISED has increased the number of VPN connections from 5,000 to 10,000 to accommodate the department's workforce of more than 5,000 employees. The department has also provided authorized connections to non-public servants when required.
ISED has also undertaken the following initiatives to manage the impact of COVID-19:
- Within the department, sectors have quickly and efficiently assessed and shifted their workforce to address COVID-19 impacts and workloads;
- A call-out was distributed to identify staff available to work on COVID-19 issues;
- A work assessment was conducted to ensure that employees experiencing a reduction in workload were reassigned to other areas;
- A talent bank of executive and non-executive applicants was established to identify resources that could be quickly and efficiently shifted to new priorities and opportunities; and
- A number of executives were reassigned, some to positions outside of the department, to assist the government in managing the pandemic.
4. Financial risks and uncertainties
The risk landscape has shifted across the globe as COVID-19 leads to greater uncertainty. Amid this uncertainty, ISED's priorities shifted to support the Government's response to the pandemic. ISED undertook decisive and swift action, including key investments for research and retooling industry, and increasing the flexibility of funding instruments.
In normal times, each investment and decision brings a potential for exposure to financial risk. During this time of a worldwide pandemic, that exposure tends to increase given the high level of uncertainty in the operating environment. For example, by their very nature, research-based investments may have greater uncertainty related to the timeliness of a return on the investment.
It is important to note that the majority of new Grant and Contribution funding approved for the response to COVD-19 is being provided through existing programs that have well-functioning internal controls and an established history of tracking and reporting on the results achieved. This has significantly mitigated the increased risk associated with the rapid delivery of new programming during a time of crisis.
Changes in the economy, some a normal occurrence and others caused by COVID-19, have also contributed to uncertainty related to revenue projections for both the Competition Bureau and the Canadian Intellectual Property Office. A potential decrease in revenue is being closely monitored and has been reflected in departmental forecasts.
ISED manages these financial risks effectively through a range of approaches and measures, including rigorous governance and review mechanisms.
The printed version was signed by:

Simon Kennedy
Deputy Minister
August 20, 2020
Date
Douglas McConnachie,
Assistant Deputy Minister/Chief Financial Officer
August 20, 2020
Date
| (in thousands of dollars) | Fiscal Year 2020–21 | Fiscal Year 2019–20 | |||||
|---|---|---|---|---|---|---|---|
| Total available for use for the year ending March 31, 2021Footnote 1 | Used during the quarter ended June 30, 2020 | Year to date used at quarter-end | Total available for use for the year ending March 31, 2020Footnote 1 | Used during the quarter ended June 30, 2019 | Year to date used at quarter-end | ||
| Vote 1 — Operating expenditures | 532,778 | 124,609 | 124,609 | 567,732 | 127,834 | 127,834 | |
| Vote 1 — Revenue Credited to the Vote | (108,065) | (18,587) | (18,587) | (117,364) | (26,347) | (26,347) | |
| Vote 1 — Net Operating Expenditures | 424,713 | 106,022 | 106,022 | 450,368 | 101,487 | 101,487 | |
| Vote 5 — Capital expenditures | 5,575 | 206 | 206 | 7,383 | 138 | 138 | |
| Vote 10 — Grants and contributions | 2,416,561 | 426,657 | 426,657 | 2,306,427 | 285,471 | 285,471 | |
| Total voted authorities | 2,846,849 | 532,885 | 532,885 | 2,764,178 | 387,096 | 387,096 | |
| Budgetary Statutory Authorities | |||||||
| Revolving Fund Gross expenditures | 211,854 | 43,259 | 43,259 | 202,186 | 45,513 | 45,513 | |
| Revolving Fund Revenues | (177,345) | (31,721) | (31,721) | (161,566) | (38,404) | (38,404) | |
| Revolving Fund Net expenditures | 34,509 | 11,538 | 11,538 | 40,620 | 7,109 | 7,109 | |
| Grants and Contributions | |||||||
| Genome Canada | - | - | - | 11,400 | 2,850 | 2,850 | |
| Liabilities under the Canada Small Business Financing Act and the Small Business Loans Act | 65,831 | 1,370 | 1,370 | 62,173 | 6,429 | 6,429 | |
| CIFAR — Pan-Canadian Artificial Intelligence | 34,000 | - | - | 32,500 | - | - | |
| Total Statutory Grants and Contributions | 99,831 | 1,370 | 1,370 | 106,073 | 9,279 | 9,279 | |
| Employee Benefit Plans | 59,687 | 14,761 | 14,761 | 59,434 | 14,482 | 14,482 | |
| Refunds of Previous Years Revenue | - | 125 | 125 | - | 169 | 169 | |
| Proceeds for Crown Asset Disposals | 171 | - | - | 216 | - | - | |
| Ministers' Salary and Motor Car Allowance | 179 | 67 | 67 | 351 | 87 | 87 | |
| Total budgetary statutory authorities | 194,377 | 27,861 | 27,861 | 206,694 | 31,126 | 31,126 | |
| Total Budgetary authorities | 3,041,226 | 560,746 | 560,746 | 2,970,872 | 418,222 | 418,222 | |
| Non-budgetary authorities | 800 | - | - | 800 | - | - | |
| Total authorities | 3,042,026 | 560,746 | 560,746 | 2,971,672 | 418,222 | 418,222 | |
| (in thousands of dollars) | Fiscal Year 2020–21 | Fiscal Year 2019–20 | |||||
|---|---|---|---|---|---|---|---|
| Planned expenditures for the year ending March 31, 2021Footnote 1 Footnote 2 | Expended during the quarter ended June 30, 2020 | Year to date used at quarter-end | Planned expenditures for the year ending March 31, 2020Footnote 1 | Expended during the quarter ended June 30, 2019 | Year to date used at quarter-end | ||
| Expenditures: | |||||||
| Personnel | 555,064 | 146,062 | 146,062 | 560,499 | 139,680 | 139,680 | |
| Transportation and communications | 15,237 | 361 | 361 | 16,726 | 2,898 | 2,898 | |
| Information | 12,386 | 1,116 | 1,116 | 12,556 | 2,496 | 2,496 | |
| Professional and special services | 165,260 | 27,318 | 27,318 | 153,979 | 33,438 | 33,438 | |
| Rentals | 18,013 | 4,782 | 4,782 | 20,231 | 4,612 | 4,612 | |
| Repair and maintenance | 13,479 | 240 | 240 | 16,751 | 596 | 596 | |
| Utilities, materials and supplies | 6,696 | 417 | 417 | 9,400 | 792 | 792 | |
| Acquisition of machinery and equipment | 23,938 | 930 | 930 | 46,652 | 1,543 | 1,543 | |
| Transfer payments | 2,516,392 | 428,027 | 428,027 | 2,412,500 | 294,750 | 294,750 | |
| Other subsidies and payments | 171 | 1,801 | 1,801 | 508 | 2,168 | 2,168 | |
| Total gross budgetary expenditures | 3,326,636 | 611,054 | 611,054 | 3,249,802 | 482,973 | 482,973 | |
| Less revenues netted against expenditures: | |||||||
| Revolving Fund Revenues | 177,345 | 31,721 | 31,721 | 161,566 | 38,404 | 38,404 | |
| Sales of Services and Other Revenue | 108,065 | 18,587 | 18,587 | 117,364 | 26,347 | 26,347 | |
| Total Revenues netted against expenditures: | 285,410 | 50,308 | 50,308 | 278,930 | 64,751 | 64,751 | |
| Total net budgetary expenditures | 3,041,226 | 560,746 | 560,746 | 2,970,872 | 418,222 | 418,222 | |