

Table of contents
- Abstract
- Acknowledgements
- 1. Introduction
- 2. Literature review
- 3. Data and descriptive statistics
- 4. Empirical strategy
- 5. Conclusion
- References
- Appendix
Abstract
This paper uses data from Canadian small and medium-sized enterprises to study the relationship between corporate social responsibility (CSR) and firm productivity, as well as the impact of competition against non-CSR firms on the productivity of CSR firms.
Accounting for several confounding factors, the results show that firms engaged in CSR practices, characterized by investments in a social, environmental or cultural mission, are more productive than non-CSR firms, and the productivity gap is largely driven by firms that allocate less than 5% of their profit to CSR initiatives, and by micro-enterprises (1 to 4 employees). Although between 23% and 44% of CSR firms are in competition with non-CSR firms, there is no significant impact of such competition on the productivity of CSR firms. This finding is robust to various definitions of competition and potential endogeneity issues.
Acknowledgements
The author wishes to thank Lyming Huang, Patrice Rivard, Mamour Fall, Jiong Tu, Shane Dolan, Aline Dimitri, Weimin Wang, Philippe Kaboré, and seminar participants at the University of Sherbrooke for their helpful comments and suggestions.
1. Introduction
Over the past few decades, many businesses have dedicated significant efforts to incorporate social, environmental, and cultural missions—commonly referred to as corporate social responsibility (CSR)—into their core business strategies and operations (Halkos and Nomikos, 2021).Footnote 1 This shift toward CSR has become a priority for many governments and international organizations, which aim to foster responsible and sustainable business conduct across industries.
For instance, the Canadian government actively promotes CSR among companies to enhance domestic investment conditions and strengthen the competitiveness of Canadian companies abroad. Thus, firms embrace CSR initiatives not only for legal compliance, sustainable development, or philanthropic reasons but also to gain competitive advantages (Rashid and Hamid, 2022; Hejjas et al., 2019; ISO, 2018).Footnote 2
The increasing prominence of CSR in business practices has prompted the advancement of research endeavours to understand the impact of CSR practices on firm performance. However, little is known about the performance of CSR firms in competitive markets. The aim of this study is twofold: first, it provides a comprehensive analysis of the correlation between CSR adoption and firm productivity among Canadian small and medium-sized businesses;Footnote 3 second, it investigates whether competing against non-CSR firms is an advantage or a threat to the productivity of CSR firms.
Theoretically, competition against non-CSR firms could either augment or stifle the productivity of CSR firms. On one hand, since CSR adoption may incur additional costs beyond those dictated by markets or laws (Vogel, 2007; McWilliams and Siegel, 2001; Aupperle et al., 1985), firms choosing to adopt CSR practices might face competition from non-CSR firms that choose not to bear those extra costs. Such competition can potentially hurt the efficiency of CSR firms, particularly in the absence of regulatory or industry standards mandating or enforcing CSR practices. On the other hand, competition with non-CSR firms can drive CSR firms to optimize resource allocation, potentially improving their productivity. What is the impact of competition against non-CSR firms on the productivity of CSR firms? From a policy point of view, the response to this question is critical for the effectiveness of industrial policies aimed at enhancing CSR adoption. Indeed, if competition against non-CSR firms negatively impacts the productivity of CSR firms, then policies aimed at promoting CSR adoption will be more effective if they help increase the competitive advantage of CSR firms.
So far, studies that examine the competitive advantage derived from CSR adoption have typically employed research methodologies that use measures of competition based on firms' market shares, such as the Herfindahl-Hirschman Index (HHI). In these frameworks (reviewed in section 2.3), firms with varying degrees of engagement in CSR are scrutinized across industries with different levels of competition, with the objective of understanding how the productivity gap between heterogeneous firms along their CSR dimension evolves with the industry level of competition. However, this measure of competition captures not only competition from non-CSR firms but also that from other CSR firms. Furthermore, a firm may be considered to be operating in a competitive industry according to the distribution of firms' market shares while exerting substantial control over specific segments of that industry due to product differentiation, which suggests a lack of real competition (Tirole, 1988; Carlton and Perloff, 2005). Unlike existing research, which uses competition measures derived from firms' market shares, this paper exploits unique firm-level data on how CSR firms specifically perceive competition from non-CSR firms.
The data for this study are from the 2020 wave of the Survey on the Financing and Growth of Small and Medium Enterprises (SFGSME), supplemented by firms' administrative records. The SFGSME provides rich insights into various firm characteristics, including information on whether a firm invests in social, environmental, and cultural missions, as well as its perception of the challenges posed by competition against firms that do not have such missions. In this study, the level of competition against non-CSR firms for a given CSR firm, is calculated as the proportion of CSR firms in the same location-industry-size group, excluding the firm in question, that identifies competition against non-CSR firms as a challenge. Using location-industry-size averages rather than individual firms' responses is common in empirical research to tackle endogeneity concerns that emerge during the estimation of the causal impact of firms' subjective perception on different outcomes (e.g., Aterido et al., 2011; Amin and Okou, 2020).
The results show that, on average, the labour productivity of CSR firms is about 21% higher than that of non-CSR firms. However, the labour productivity gap between CSR and non-CSR firms depends on the intensive margin of CSR, i.e., the percentage of profit a CSR firm invests to further its social, environmental, and cultural mission. Indeed, CSR firms that invest less than 5% of their profit in CSR initiatives are about 40% more productive than non-CSR firms, whereas CSR firms that allocate from 5% to 20% of their profit to CSR initiatives are only 18% more productive than non-CSR firms. On the contrary, the productivity gap between CSR and non-CSR firms is not significantly different from zero when CSR firms reinvest more than 20% of their profits in CSR activities. The productivity gap between CSR and non-CSR firms also varies according to firm size, measured by the number of employees. More specifically, the gap is positive and significant only in the subsample of micro-enterprises (1 to 4 employees).
Finally, employing diverse definitions of competition, which are based on how firms perceive the challenge of competing against non-CSR firms (ranging from no challenge to major challenge), this paper finds that between 23% and 44% of CSR firms compete with non-CSR firms. However, CSR firms that compete against non-CSR are similar in labour productivity to CSR firms that are not engaged in such competition. Thus, competing against non-CSR firms neither enhances nor diminishes the productivity of CSR firms. This suggests that the productivity advantage of CSR firms over non-CSR firms is not significantly influenced by the level of competition that CSR firms face from non-CSR firms.
The rest of the paper is structured as follows:
- Section 2 presents the literature review including a discussion on the concept of CSR.
- Section 3 describes the dataset and provides descriptive statistics.
- Section 4 presents the empirical strategy and discusses the results.
- Section 5 concludes.
2. Literature review
2.1 CSR: definitions and measures
The different views about CSR can be classified into two groups. The first group defines CSR as the voluntary actions of firms to fulfill "responsibilities beyond those dictated by markets or laws" (e.g., McWilliams and Siegel, 2001). The second group defines CSR in broader terms, encompassing the economic, legal, and ethical responsibilities of businesses. For instance, according to the European Commission (2011), "CSR at least covers human rights, labour and employment practices (such as training, diversity, gender equality and employee health and well-being), environmental issues (such as biodiversity, climate change, resource efficiency, life-cycle assessment and pollution prevention), and combating bribery and corruption. Community involvement and development, the integration of disabled persons, and consumer interests, including privacy, are also part of the CSR agenda". The OECD (2023) Guidelines for Multinational Enterprises on Responsible Business encompass all significant aspects of business responsibility.
These include human rights, labour rights, environmental concerns, bribery, consumer interests, as well as information disclosure, science and technology, competition, and taxation. The Canadian government also adheres to these international guidelines on responsible business conduct.Footnote 4
The variety of definitions of CSR implies a diversity of measures. Many rating agencies propose indicators to measure a firm's involvement in CSR. However, their data only cover a few firms worldwide, which limits the representativeness of a study at the country level. For instance, many researchers and practitioners use the KLD dataset, now part of the MSCI ESG (Environmental, Social, and Governance) Index.
This dataset typically includes information on environmental practices (such as carbon emissions and energy efficiency), social factors (like labour practices and diversity policies), and governance aspects (such as board structure and executive compensation).Footnote 5 The company Thomson and Reuters also proposes a set of indicators to assess the ESG performance of businesses.Footnote 6
The present study uses information on CSR practices available in the 2020 SFGSME, which only capture beyond-compliance indicators of CSR, but has the advantage of being representative of Canadian small and medium-sized enterprises, which represent 99.7% of employer businesses in Canada (Innovation, Science and Economic Development Canada, 2024). The use of survey data is also employed by Newman et al. (2020), even though they have access to more detailed CSR indicators than this paper does.
2.2 Firm productivity and CSR
There is a growing discussion on the influence of CSR on firm productivity. For instance, there is evidence suggesting that socially responsible firms effectively leverage their responsible practices to attract highly skilled, motivated, and eventually productive employees (e.g., Crifot and Forget, 2015; Nyborg, 2014; Delmas and Pekovic, 2013). Hasan et al. (2018) posit that productivity is an accumulation of productive intangibles, and CSR helps improve such intangibles. Their study is based on a comprehensive longitudinal dataset of US manufacturing firms from 1992 to 2009.
Using Chinese firm-level data and a measure of Total Factor Productivity (TFP), Liang et al. (2022) show that CSR increases firm-level TFP. They also document the heterogeneous impacts of CSR on firms' TFP. For example, the impact is greater for family than non-family firms, and for private than state-owned firms. Børing (2019) uses Norwegian manufacturing firms' data and two CSR objectives for innovations (reducing environmental impacts and improving health or safety of the employees) to examine the impact of these objectives on firm-level labour productivity. Their results show that the predicted probability of adopting the objective of reducing environmental impacts has a significant negative effect on the productivity level among large firms while this effect is not significant among small firms.
Regarding Canadian firms, most studies on CSR focus on its impact on firms' financial performance, primarily relying on publicly traded firms (e.g., Mahoney and Roberts, 2007; Donker et al., 2008; Makni et al., 2009; Bouslah, 2010). To the best of our knowledge, this paper is one of the first to examine the relationship between CSR and firm productivity using data from Canadian small and medium-sized businesses.
2.3 On the competitive advantage of CSR
Newman et al. (2020) are the first to study empirically how competition influences the relationship between CSR and firm productivity. Their study uses a representative sample of Vietnamese enterprises, and an industry-level measure of competition based on the HHI. They find that CSR adoption increases firm labour productivity, but the impact is lower in highly competitive industries. Using a similar methodology, Kamarudin et al. (2022) show that firms with high board gender diversity (a dimension of CSR) exhibit high corporate sustainability performance. They also find that the effect diminishes in highly competitive industries. The present study deviates from the aforementioned ones in two ways: first, it focuses on the impact of competition against only non-CSR firms on the productivity of CSR firms. Second, it uses a measure of competition based on firms' perception on their competitive environment rather than their market share.
3. Data and descriptive statistics
3.1 Data
Throughout this paper, a firm is considered an enterprise, which is defined by Statistics Canada as "one or more domestic establishments that are specified under common ownership or control". Three datasets are used to conduct the empirical analysis. The main one is the Survey on Financing and Growth of Small and Medium Enterprises (SFGSME),Footnote 7 a repeated cross-section of Canadian small and medium-sized enterprises, which has been collected by Statistics Canada since 2011 on behalf of a consortium led by Innovation, Science and Economic Development Canada. The survey is collected on an occasional frequency with the objective of understanding what kind of financing Canadian small and medium-sized enterprises are using and recent attempts to obtain new financing. Moreover, the survey provides valuable information on firm-level characteristics, including barriers to growth, circumstances that affect a business's operations, and characteristics of ownership.
This study uses the 2020 wave of the SFGSME, which is the most recent round available and the first to include data both on whether a firm invests in social, environmental, and cultural missions, as well as its perceptions of the challenges posed by competing against firms lacking such missions. Leveraging this information, a firm is considered to engage in CSR initiatives when it reinvests a positive percentage of its profits to further its social, environmental, or cultural objective to impact or improve communities.Footnote 8
The 2020 SFGSME is representative of Canadian firms with 1 to 499 employees and more than $30,000 in gross revenue, excluding non-profit organizations, joint ventures, government agencies, and enterprises in specific industries.Footnote 9 Thus, the sample consists of small and medium-sized enterprises (SMEs) whose primary objective is to maximize profit. The target population consists of 859,735 firms, of which 19,283 were surveyed. Among these, 9,957 responses were received. However, only the subsample of enterprises that reported a positive profit in 2020 is included in the analysis.
For this research, the survey data is combined with two Canada Revenue Agency's administrative records. The first is the corporation income tax return (T2), an administrative record of corporations' financial information based on the General Index of Financial Information (GIFI). GIFI is an extensive list of financial statement items where each item is assigned a unique code. The second is the Payroll Deductions Account (PD7), which provides diverse information on firms' workforces, including total payroll, and the federal income tax withheld from employees' pay.
The statistics provided in this paper are derived using sample weights, in accordance with the confidentiality requirements of the Statistics Act. The weights are calculated by Statistics Canada so that each observation in the sample represents both unsampled and non-responding enterprises. However, not all of the 9,957 firms that constitute our final sample have information on every single variable. Therefore, the sum of the sampling weights may not always match the size of the target population for all the variables of this study.Footnote 10
3.2 Distribution of CSR and non-CSR firms and their productivity
Figure 1 presents the distribution of the extensive margin of CSR (i.e., the number of CSR firms) and the intensive margin of CSR (i.e., the percentage of profit reinvested in CSR). As Panel A of Figure 1 shows, only 15.1% of firms engage in CSR practices. Figure A1 in the Appendix shows that CSR firms are more concentrated in the mining, quarrying, and oil and gas extraction industry (27%), retail trade (23%), and arts, entertainment and recreation (23%). The industries that have the lowest shares of CSR firms are other services (13%), construction (8%), and administrative and support, waste management and remediation services (8%). Among CSR firms, roughly 80% reinvest less than 20% of their profit to further their social, environmental, or cultural objective to impact or improve communities (Figure 1, Panel B).
Figure 1: Extensive and intensive margin of CSR

Note: The distributions are weighted, and the rounding rules are set to meet confidentiality requirements of the Statistics Act.
Sources: Statistics Canada, Survey on Financing and Growth of Small and Medium Enterprises, 2020; and author's calculation.
Figure 2 contrasts the average of the log labour productivity of CSR firms with that of non-CSR firms and shows how the difference changes along the intensive margin of CSR. Firm-level labour productivity is measured as the ratio of sales per worker. Panel A of Figure 2 shows that, on average, the labour productivity of CSR firms exceeds that of non-CSR firms by 35%.Footnote 11 However, the difference in labour productivity between CSR and non-CSR firms depends on the intensity of CSR activities. Firms allocating less than 20% of their profits to CSR demonstrate higher productivity than non-CSR firms. Conversely, higher levels of CSR investment correlate with decreased labour productivity among CSR firms relative to their non-CSR counterparts (Figure 2, Panel B).Footnote 12
Figure 2: Productivity gap and intensive margin of CSR
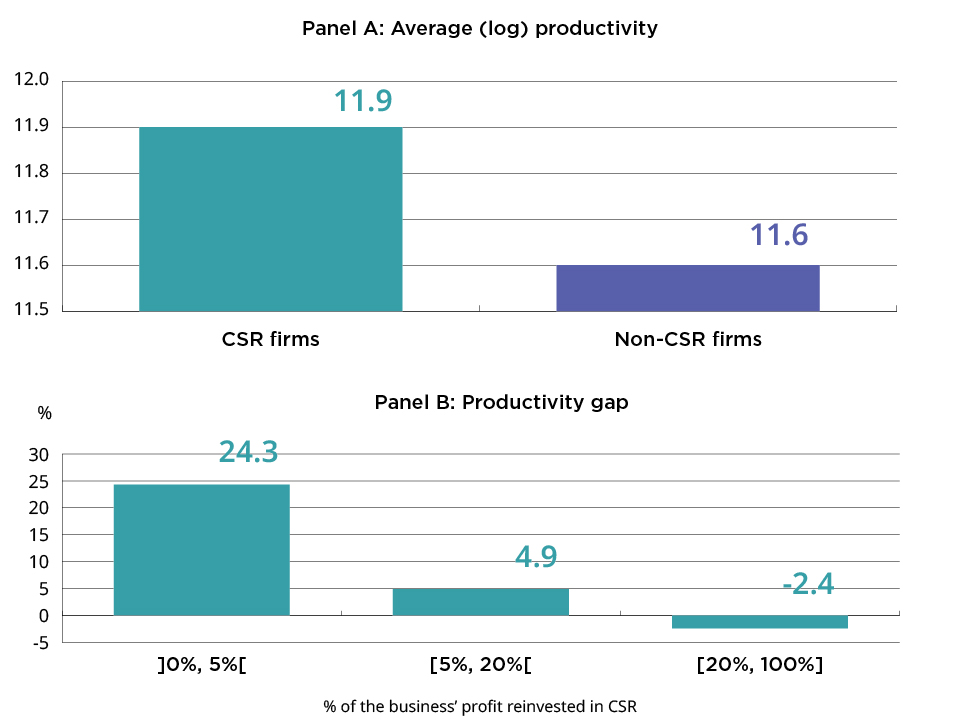
Note: The productivity gap in Panel B is calculated as the difference in the mean logarithm of labour productivity between CSR and non-CSR firms multiplied by 100. The distributions are weighted to meet confidentiality requirements of the Statistics Act.
Sources: Statistics Canada, Survey on Financing and Growth of Small and Medium Enterprises, 2020; Payroll Deductions Account (PD7) 2020, and author's calculation.
3.3 CSR firms in competition against non-CSR firms
One important assumption of this paper is that CSR firms encounter varying degrees of competition from non-CSR firms, even when operating within the same industry. Figure 3 shows that more than half (56%) of CSR firms perceive no challenge in competing against non-CSR firms, one out of five (21%) regards competition from non-CSR firms as a minor challenge, while 13% see it as a moderate challenge, and 10% as a major challenge.
Considering CSR firms as in competition against non-CSR firms when they perceive this competition as a minor, moderate, or major challenge (Definition 1), 44% of CSR firms are in competition and non-CSR firms. It is also possible that CSR firms are genuinely competing against non-CSR firms only when they perceive this competition as a moderate or major challenge (Definition 2). Using this alternative definition, 23% of CSR firms are in competition against non-CSR firms. Figures A2 and A3 in the Appendix show that firms are heterogenous in their perception of the challenge posed by competition against non-CSR firms even within industries defined by two-digit NAICS codes.Footnote 13
Figure 3: Distribution of CSR firms in competition against non-CSR firms

Note: The distributions are weighted, and the rounding rules are set to meet confidentiality requirements of the Statistics Act.
Sources: Statistics Canada, Survey on Financing and Growth of Small and Medium Enterprises, 2020; and author's calculation.
CSR firms facing challenges when competing against non-CSR firms could experience adverse effects from such competition. Consequently, lower performance from these CSR firms compared to those facing no challenges when competing against non-CSR firms could be anticipated. Yet, there is also a plausible scenario where CSR firms for whom competing against non-CSR counterparts represents a challenge might experience a productivity boost due to improved resource allocation.
Figure 4 presents the average log productivity of CSR firms depending on whether they compete against non-CSR firms. According to Definition 1 of competition, the picture in Panel A of Figure 4 reveals no disparity in the productivity of CSR firms, regardless of whether they actively compete against non-CSR firms. Using Definition 2, CSR firms engaged in competition against non-CSR firms are about 15% less productive than CSR firms not involved in such competition (Figure 4-Panel B).
Figure 4: CSR firms' productivity by level of competition with non-CSR firms

Note: The distributions are weighted to meet confidentiality requirements of the Statistics Act.
Sources: Statistics Canada, Survey on Financing and Growth of Small and Medium Enterprises, 2020; Payroll Deductions Account (PD7) 2020, and author's calculation.
It is important to note that the descriptive results presented in the form of figures, namely the productivity gap between CSR and non-CSR firms, as well as the productivity difference among CSR firms depending on whether they are in competition with non-CSR firms or not, are mere correlations.
The following section outlines the methodology for estimating the productivity gap between CSR and non-CSR firms after controlling for various confounding factors as well as the impact of competition with non-CSR firms on the productivity of CSR firms.
4. Empirical strategy
This paper's approach to estimating the productivity gap between CSR and non-CSR firms, as well as the impact of competition from non-CSR firms on the productivity of CSR firms, draws significant inspiration from Amin and Okou's (2020) study. They conducted a similar investigation, albeit one focusing on formal and informal firms across a wide array of countries.Footnote 14
4.1 Estimation of the productivity gap between CSR and non-CSR firms
The productivity gap between CSR and non-CSR firms is estimated using the following linear model:
where the subscript i denotes a specific firm, prodi is the dependent variable, representing labour productivity measured as the log of the ratio of sales per worker, and CSRi is the main explanatory variable, a dummy variable signalling whether a firm falls under CSR status or not. The parameter of interest is IFEi and RFEi represent the industry (defined by a four-digit NAICS code) and region fixed effects, respectively. These fixed effects are computed as dummy variables indicating the industry and region of operation for each firm.Footnote 15 Therefore, the estimation results control for differences in economic development across regions, as well as any undisclosed industry-specific factors that could impact firm productivity. is a set of controls, and is the error term.
All variables in this study are observed in 2020, unless otherwise indicated. The list of controls used to estimate equation 1 is derived from the literature on the determinants of firm productivity. The list of controls includes:
- Innovation: Increased innovation activities are expected to have a positive and significant impact on productivity (e.g., Gu and Tang, 2004). The SFGSME 2020 captures various dimensions of innovation by non-franchised businesses during their last three years of operation. In this paper, innovation is defined as a dummy variable equal to 1 if, during the last three years, a non-franchised business has implemented at least one of the four types of the following innovations: new or significantly improved good or service, a new or significantly improved production process or method (e.g., a new or improved production process, distribution method or support activity for your goods and services), a new organizational method in business practices, workplace organization or external relations (e.g., strategic decision taken by management), or a new way of selling goods or services (significant changes in product design or packaging, product placement, product promoting or pricing). The innovation variable takes the value of 0 otherwise.
- Firm age (in log): There are several channels through which age can influence firm productivity. For example, firms established during significant technological shifts may surpass others in terms of sales and productivity (e.g., Jovanovic and Rousseau, 2005; Klepper, 1996). Hamano and Okubo (2023) observe that century-old firms exhibit the highest sales and TFP compared with their peers. Conversely, the productivity of young firms may be lower, as startups often are more likely to offer job opportunities to younger and less skilled workers (e.g., Ouimet and Zarutskie, 2014).
- Number of workers (in log): A large labour productivity gap may exist between the largest and smallest firms. A series of papers document a positive relationship between firm size and productivity (e.g., Van Ark and Monnikhof, 1996; Baldwin, Jarmin, and Tang, 2002; Leung et al., 2008). On the contrary, as argued by Amin and Okou (2020), diminishing returns to labour may arise when a large number of workers are assigned to a fixed amount of physical capital, potentially resulting in a negative relationship between size and productivity (e.g., Amin and Islam, 2015).
- Capital (in log): As argued previously, the amount of capital may influence labour productivity. Thus, this study controls for the total amount of tangible assets, which are physical assets that can be seen, touched, and felt. Examples include equipment, buildings, land, vehicles, and furniture.
- Foreign Direct Investment (FDI): The theoretical model of Helpman et al. (2004) predicts that only the more productive firms choose to serve foreign markets via FDI. This prediction aligns with empirical evidence across various countries (e.g., Girma et al., 2005 for the UK; Girma et al., 2004 for Ireland; and Wagner, 2006 for Germany). This research uses a dummy variable that takes the value 1 if the firm engages in foreign direct investments, and 0 otherwise.
- Export: Firm heterogeneity in exporting is a robust stylized fact in many countries. Just like for FDI, exporters are known to be more productive relative to non-exporters (e.g., Bernard et al., 2003, Gu et al., 2018). This could be attributed to trade barriers such as fixed export costs and iceberg costs (where 100% of exported goods do not reach their destination), which are such that only the most productive firms manage to export while remaining profitable (e.g., Melitz, 2003; Helpman et al., 2004). In the model, the export variable is a dummy that takes the value 1 for an exporter and 0 for a non-exporter.
- Number of years of experience (in log) of the top manager: Sociodemographic characteristics such as human capital in general and the experience of the top manager, in particular, are likely to influence firm productivity (e.g., Black and Lynch, 1996; Pfeifer, 2015).
- Ownership gender: According to certain research findings, there exists a significant disparity in labour productivity between businesses owned by females and those owned by males (e.g., Grekou et al., 2023). However, contrasting results are found by other studies (e.g., Hoang et al., 2021), which observe no difference in labour productivity between firms owned predominantly by females versus those owned mainly by males. Consequently, this paper incorporates gender ownership control into the analysis using a categorical variable distinguishing between firms predominantly owned by females, males, or equally owned by males and females.
Table 1 summarizes the means and proportions of most of the control variables. On average, CSR firms are larger, utilize more capital, and are more likely to engage in exporting, innovation, and FDI activities compared with non-CSR firms. However, there is no significant difference in the age or years of managerial experience between CSR and non-CSR firms.
| CSR | Non-CSR | Comparison | Total (CSR + non-CSR) | ||
|---|---|---|---|---|---|
| Continuous | Mean | Mean | Difference | Mean | Observation |
| Firm age | 18.73 (16.82) | 17.73 (14.87) | 0.99 (0.764) | 17.89 (15.19) | 655,110 |
| Size | 18.78 (42.05) | 10.39 (26.14) | 8.38*** (0.099) | 11.66 (29.26) | 655,110 |
| Years of experience | 21.89 (12.52) | 21.86 (12.72) | 0.03 (0.689) | 21.87 (12.69) | 655,110 |
| Capital (in log) | 12.18 (2.12) | 11.86 (2.06) | 0.32*** (0.115) | 11.91 (2.08) | 531,345 |
| Binary | (%) | (%) | Odds ratio | (%) | Observation |
| Export | 18 | 10.9 | 1.767*** (0.243) | 11.9 | 655,110 |
| Innovation | 47 | 24.9 | 2.622*** (0.289) | 28.1 | 613,025 |
| FDI | 1 | 0.2 | 7.362*** (4.521) | 0.3 | 655,110 |
Note: The table statistics are weighted, and the rounding rules are set to meet confidentiality requirements of the Statistics Act. Standard deviations are in parentheses. Column 4 shows the estimated mean difference between CSR and non-CSR firms, as well as the odds ratio from a logistic regression, with standard errors provided in parentheses. *p<0.1, **p<0.05, ***p<0.01.
Sources: Statistics Canada, Survey on Financing and Growth of Small and Medium Enterprises, 2020; Payroll Deductions Account (PD7) and T2 Corporation Income Tax Return 2020; and author's calculation.
Equation (1) is estimated using ordinary least square (OLS) and heteroskedasticity-robust standard errors. The results are presented in Table 2. Three specifications are displayed, varying in the number of controls used for estimation. In every specification, the labour productivity of CSR firms surpasses that of non-CSR firms, with the productivity gap statistically significant at 1%.
According to the complete model, i.e., the model with all the controls (specification 3), CSR firms are 20.92% more productive than non-CSR firms.Footnote 16 The remaining results are also consistent with the literature as exporters and innovators demonstrate higher productivity compared with non-exporters and non-innovators, respectively. Finally, the smallest SMEs and those with more capital exhibit higher labour productivity.
| Lab. prod. (log) | (1) | (2) | (3) |
|---|---|---|---|
| CSR | 0.194*** (0.052) | 0.196*** (0.052) | 0.190*** (0.051) |
| Firm age (log) | -0.017 (0.026) | -0.017 (0.026) | -0.018 (0.026) |
| Size (log) | -0.183*** (0.021) | -0.184*** (0.021) | -0.187*** (0.021) |
| Capital (log) | 0.124*** (0.017) | 0.124*** (0.017) | 0.125*** (0.018) |
| Years of experience (log) | -0.024 (0.029) | -0.024 (0.029) | -0.023 (0.029) |
| Export | 0.278*** (0.055) | 0.278*** (0.055) | 0.278*** (0.055) |
| Innovation | 0.022 (0.055) | 0.021 (0.055) | 0.027 (0.054) |
| FDI | - | -0.193 (0.210) | -0.226 (0.217) |
| Ownership | |||
Maj. female |
- | - | -0.056 (0.055) |
Equally owned |
- | - | -0.178** (0.077) |
| Industry FE | Yes | Yes | Yes |
| Region FE | Yes | Yes | Yes |
| Constant | 3.897* (2.344) | 3.889* (2.345) | 3.883* (2.356) |
| N | 455,680 | 455,680 | 455,680 |
| R2 | 0.363 | 0.363 | 0.366 |
Note: CSR = 1 if Yes and 0 if No. Export = 1 if Yes and 0 if No. Innovation = 1 if Yes and 0 if No. FDI = 1 if Yes and 0 if No. Ownership = 0 if majority-male, 1 if majority-female, and 2 if equally owned. The omitted category in the estimation is 0. Sample weights are applied to meet confidentiality requirements of the Statistics Act. Standard errors in parentheses. *p<0.1, **p<0.05, ***p<0.01.
Sources: Statistics Canada, Survey on Financing and Growth of Small and Medium Enterprises, 2020; Payroll Deductions Account (PD7) and T2 Corporation Income Tax Return 2020; and author's calculation.
To examine how the results change with the level of investment in CSR, Equation 1 is estimated using a categorical variable representing various levels of CSR intensity, rather than merely CSR status. Four CSR intensity categories are considered: 0 for non-CSR firms, 1 for SMEs allocating less than 5% of their profit to CSR, 2 for SMEs investing between 5% and 20% in CSR initiatives, and 3 for SMEs devoting over 20% of their profit to CSR. The results are presented in Table 3 and show that the relationship between CSR adoption and firm productivity is heterogenous across CSR firms.
Indeed, compared with non-CSR firms, SMEs allocating less than 5% of their profit to CSR demonstrate higher productivity (39.24% higher) than those investing between 5% and 20% (17.59% higher). However, the labour productivity of CSR firms is not significantly different from that of non-CSR firms when more than 20% of their profit is invested in CSR initiatives. This finding seems intuitive, as firms allocating a significant portion of profits to CSR initiatives likely prioritize objectives other than profit maximization.
| Lab. prod. (log) | |
|---|---|
| Intensive margin of CSR | |
]0%, 5%[ |
0.331*** (0.089) |
[5%, 20%[ |
0.162** (0.066) |
[20%, 100%] |
-0.003 (0.085) |
| Firm age (log) | -0.018 (0.026) |
| Size (log) | -0.189*** (0.021) |
| Capital (log) | 0.124*** (0.018) |
| Years of experience (log) | -0.020 (0.029) |
| Export | 0.273*** (0.055) |
| Innovation | 0.029 (0.054) |
| FDI | -0.206 (0.218) |
| Ownership | |
Maj. female |
-0.060 (0.055) |
Equally owned |
-0.178** (0.077) |
| Industry FE | Yes |
| Region FE | Yes |
| Constant | 3.899* (2.356) |
| N | 455,680 |
| R2 | 0.368 |
Note: Intensive margin = 0 for non-CSR firms, 1 if Intens. Marg. in ]0%, 5%[, 2 if Intens. Marg. in [5%, 20%[, and 3 if Intens. Marg. in [20%, 100%]. Export = 1 if Yes and 0 if No. Innovation = 1 if Yes and 0 if No. FDI = 1 if Yes and 0 if No. Ownership = 0 if majority-male, 1 if majority-female, and 2 if equally owned. The omitted category in the estimation is 0. Sample weights are applied to meet confidentiality requirements of the Statistics Act. Standard errors in parentheses. *p<0.1, **p<0.05, ***p<0.01.
Sources: Statistics Canada, Survey on Financing and Growth of Small and Medium Enterprises, 2020; Payroll Deductions Account (PD7) and T2 Corporation Income Tax Return 2020; and author's calculation.
Table 4 presents the estimation of the labour productivity gap within firm size categories. The results show that the productivity advantage of CSR firms over non-CSR firms is driven by micro-enterprises, i.e., enterprises with a number of employees comprised between 1 and 4. Indeed, the main estimated parameter is positive and significant only for micro-enterprises. Specifically, within micro-enterprises, CSR firms are about 26.36% more productive than non-CSR firms. Within medium-sized enterprises, the labour productivity of CSR firms is 13.06% lower than the labour productivity of non-CSR firms.
| Lab. prod. (log) | 1–4 employees | 5–19 employees | 20–99 employees | 100–499 employees |
|---|---|---|---|---|
| CSR | 0.234*** (0.086) | 0.115 (0.074) | 0.127 (0.080) | -0.140** (0.062) |
| Firm age (log) | -0.026 (0.036) | -0.076 (0.053) | 0.068* (0.040) | 0.140*** (0.039) |
| Size (log) | -0.304*** (0.064) | -0.288*** (0.077) | -0.105 (0.076) | -0.343*** (0.079) |
| Capital (log) | 0.082*** (0.021) | 0.171*** (0.039) | 0.144*** (0.034) | 0.200*** (0.026) |
| Years of experience (log) | -0.041 (0.045) | 0.019 (0.058) | 0.010 (0.042) | -0.070 (0.052) |
| Export | 0.298*** (0.096) | 0.198** (0.094) | 0.152** (0.078) | 0.016 (0.078) |
| Innovation | 0.041 (0.072) | -0.068 (0.105) | 0.068 (0.069) | 0.017 (0.061) |
| FDI | 0.066 (0.349) | -0.683** (0.313) | -0.338* (0.198) | -0.026 (0.185) |
| Ownership | ||||
Maj. female |
-0.087 (0.084) | -0.015 (0.088) | -0.201** (0.101) | -0.123 (0.118) |
Equally owned |
-0.059 (0.094) | -0.265 (0.193) | -0.157 (0.101) | -0.019 (0.102) |
| Industry FE | Yes | Yes | Yes | Yes |
| Region FE | Yes | Yes | Yes | Yes |
| Constant | 4.535* (2.521) | 8.888*** (0.912) | 7.042*** (0.519) | 4.605* (2.443) |
| N | 237,680 | 155,300 | 54,655 | 8,045 |
| R2 | 0.387 | 0.421 | 0.726 | 0.763 |
Note: CSR = 1 if Yes and 0 if No. Export = 1 if Yes and 0 if No. Innovation = 1 if Yes and 0 if No. FDI = 1 if Yes and 0 if No. Ownership = 0 if majority-male, 1 if majority-female, and 2 if equally owned. The omitted category in the estimation is 0. Sample weights are applied to meet confidentiality requirements of the Statistics Act. Standard errors in parentheses. *p<0.1, **p<0.05, ***p<0.01.
Sources: Statistics Canada, Survey on Financing and Growth of Small and Medium Enterprises, 2020; Payroll Deductions Account (PD7) and T2 Corporation Income Tax Return 2020; and author's calculation.
Finally, there may exist a scenario wherein only productive firms opt for CSR adoption, implying that the link between CSR adoption and firm productivity might not stem from CSR adoption leading to productivity enhancement as assumed in Equation 1, but rather from productivity influencing CSR adoption (reverse causality). In such a scenario, the productivity gap estimated from Equation 1 could be biased. Therefore, as a robustness check, a version of Equation 1 that mitigates the influence of the reverse causality concern is estimated. It consists of a regression of firm productivity in 2021 (dependent variable) on firm CSR status and characteristics in 2020 (independent variables). Since firm productivity is observed one year later after a firm chooses to adopt CSR initiatives or not, a firm productivity is less likely to influence its CSR status, particularly if CSR adoption or productivity were non-stationary. The results, in Table 5, show that the productivity advantage of CSR firms holds and is robust to reverse causality since CSR firms are 17.12% more productive than non-CSR firms.
| Lab. prod. in 2021 (log) | |
|---|---|
| CSR | 0.158*** (0.054) |
| Firm age (log) | -0.040* (0.024) |
| Size (log) | -0.017 (0.020) |
| Capital (log) | 0.081*** (0.014) |
| Years of experience (log) | -0.014 (0.033) |
| Export | 0.209*** (0.065) |
| Innovation | 0.105** (0.049) |
| FDI | -0.204 (0.180) |
| Ownership | |
Maj. female |
-0.107* (0.060) |
Equally owned |
-0.123* (0.066) |
| Industry FE | Yes |
| Region FE | Yes |
| Constant | 3.475 (2.965) |
| N | 437,145 |
| R2 | 0.356 |
Note: All independent variables are observed in 2020. CSR = 1 if Yes and 0 if No. Export = 1 if Yes and 0 if No. Innovation = 1 if Yes and 0 if No. FDI = 1 if Yes and 0 if No. Ownership = 0 if majority-male, 1 if majority-female, and 2 if equally owned. The omitted category in the estimation is 0. Sample weights are applied to meet confidentiality requirements of the Statistics Act. Standard errors in parentheses. *p<0.1, **p<0.05, ***p<0.01.
Sources: Statistics Canada, Survey on Financing and Growth of Small and Medium Enterprises, 2020; Payroll Deductions Account (PD7) and T2 Corporation Income Tax Return 2020; and author's calculation.
It is crucial to acknowledge that Equation 1 aims to estimate the productivity gap between CSR and non-CSR firms. This gap measures the residual difference in productivity levels between CSR and non-CSR firms, after controlling for various confounding factors. Therefore, the parameter of interest should be understood as the correlation between CSR and firm productivity, conditional on those control variables, rather than implying causality.
4.2 Estimation of the impact of competition against non-CSR firms on the labour productivity of CSR firms
The preceding section has demonstrated that CSR firms outperform non-CSR firms in terms of labour productivity. The present section examines the extent to which the distinctive performance of CSR firms is influenced by competition against non-CSR firms. To do so, a regression equation in which the dependent variable is the productivity level of a CSR firm, and the main explanatory variable is competition against non-CSR firms is estimated.
So far, a CSR firm is considered as competing with non-CSR firms if it perceives such competition as a minor, moderate, or major challenge (Definition 1), or as a moderate or major challenge (Definition 2). However, as argued by Amin and Okou (2020) in another context, using a dichotomic variable of competition against non-CSR firms (yes or no) directly in a regression is problematic due to potential endogeneity for the following reasons: (1) not all CSR firms can accurately assess if they are competing against non-CSR firms, leading to endogeneity due to measurement error; (2) there may be firm-level characteristics omitted from our regression equation that are correlated with how a CSR firm perceives competition against non-CSR firms, leading to endogeneity due to omitted variables; (3) whether a CSR firm considers competition from non-CSR firms as a challenge might depend on its level of productivity, leading to endogeneity due to reverse causality.
To tackle the potential endogeneity concerns related to using a raw competition variable, this study adopts the approach of Amin and Okou (2020), assigning to each CSR firm the level of competition from non-CSR firms faced by all other CSR firms in the same location, industry, and size group. The average level of competition faced by a particular CSR firm is proxied by the proportion of all other CSR firms in the same region, industry, and size group (referred to as a "cell") that falls into either Definition 1 or Definition 2. Therefore, even if a CSR firm does not provide a direct response regarding its perception of competition from non-CSR firms, it is still possible to estimate the value of such competition based on the responses of other firms within the same cell. Furthermore, given that the measure of competition for each CSR firm does not include the firm itself, it is unlikely that the level of competition would be correlated with the characteristics of the firm in question. Finally, assigning each firm the average value of competition within its cell, excluding itself, helps address endogeneity concerns related to measurement error if that firm happens to be an outlier.Footnote 17
The regression equation takes the following form:
where the subscript i indicates CSR firm i, prodCSRi is labour productivity, Compi the main explanatory variable representing the average level of competition faced by all other CSR firms in the same cell. The remaining control variables are defined as in Equation 1. The only addition to the set of control variables is the intensive margin of CSR.
To create the cells, as a first strategy, this paper defines industry using 4-digit NAICS codes and adheres to standard classifications for firm size: 1 = between 1 and 4 employees, 2 = between 5 and 19 employees, 3 = between 20 and 99 employees, and 4 = between 100 and 499 employees.Footnote 18 Only CSR firms with values for region, industry,Footnote 19 and size are considered in the analysis.
Each created cell contains a weighted average of about 3 firms. However, cells with fewer than three firms are excluded to have enough firms over which firm-level of competition is calculated. Thus, the weighted average number of firms within cells is 5 in the final sample. Equation 2 is estimated using OLS and heteroskedasticity-robust standard errors. The results are presented in Table 6 and show that regardless of the definition used to categorize CSR firms into those in competition against non-CSR firms and those that are not, competition against non-CSR firms does not have a significant influence on the productivity of CSR firms. This suggests that the productivity gap between CSR and non-CSR firms is independent of how CSR firms perceive competition against non-CSR firms.
| Lab. prod. (log) | Definition 1 | Definition 2 |
|---|---|---|
| Comp | 0.176 (0.240) | 0.217 (0.309) |
| Firm age (log) | 0.135 (0.084) | 0.138* (0.083) |
| Size (log) | -0.191*** (0.067) | -0.185*** (0.067) |
| Capital (log) | 0.128*** (0.046) | 0.126*** (0.045) |
| Years of experience (log) | -0.074 (0.100) | -0.076 (0.100) |
| Export | 0.310** (0.138) | 0.313** (0.136) |
| Innovation | 0.225 (0.158) | 0.225 (0.158) |
| FDI | -1.404*** (0.253) | -1.419*** (0.248) |
| Ownership | ||
Maj. female |
-0.131 (0.172) | -0.136 (0.171) |
Equally owned |
-0.050 (0.135) | -0.055 (0.133) |
| Intensive margin of CSR | ||
[5, 20%[ |
-0.156 (0.126) | -0.162 (0.128) |
[20, 100%] |
-0.162 (0.168) | -0.168 (0.167) |
| Industry FE | Yes | Yes |
| Region FE | Yes | Yes |
| Constant | 9.079*** | 9.120*** |
| N | 26,435 | 26,435 |
| R2 | 0.577 | 0.577 |
Note: Export = 1 if Yes and 0 if No. Innovation = 1 if Yes and 0 if No. FDI = 1 if Yes and 0 if No. Ownership = 0 if majority-male, 1 if majority-female, and 2 if equally owned. Intensive margin of CSR = 0 if in ]0%, 5%[, 1 if in [5%, 20%[, and 2 in [20, 100%]. The omitted category in the estimation is 0. Sample weights are applied to meet confidentiality requirements of the Statistics Act. Standard errors in parentheses. *p<0.1, **p<0.05, ***p<0.01.
Sources: Statistics Canada, Survey on Financing and Growth of Small and Medium Enterprises, 2020; Payroll Deductions Account (PD7) and T2 Corporation Income Tax Return 2020; and author's calculation.
Although defining cells at a more granular level increases the likelihood of accurately capturing the degree of competition from non-CSR firms felt by CSR firms—since these cells are more likely to contain homogenous CSR firms—it reduces the number of observations. Indeed, small bins may not always meet the minimum requirement of three firms needed for inclusion in the analysis. Therefore, there is a trade-off between precision from firm homogeneity within cells and precision from having sufficient observations in each cell to estimate firm-level of competition. To improve the later form of precision, Equation 2 has also been estimated using more aggregated cells.
The results are presented in Table 7. Column (1) of Table 7 displays the estimation results of Equation 2, with firms categorized by identical region, two-digit NAICS,Footnote 20 and size cells. In column (2), the cell construction considers only two dimensions of homogeneity: two-digit NAICS X size. Lastly, column (3) aggregates firm size into two categories: small firms (1 to 99 employees) and medium-sized firms (100 to 499 employees), and cells are constructed as combinations of these two categories of size and two-digit NAICS.Footnote 21 The results show that, in general, competition against non-CSR firms does not significantly impact the productivity of CSR firms. However, when constructing cells as shown in column 2 and applying Definition 2 of competition, the average labour productivity of a CSR firm that faces the highest level of competition from non-CSR firms (i.e., Compi = 1) is 59.34% lower than that of a CSR firm that encounters no competition from non-CSR firms. Note that this result is only significant at 10%.
| Lab. prod. (log) | (1) | (2) | (3) | |||
|---|---|---|---|---|---|---|
| Definition 1 | Definition 2 | Definition 1 | Definition 2 | Definition 1 | Definition 2 | |
| Comp | -0.355 (0.241) | -0.048 (0.237) | -0.577 (0.524) | -0.900* (0.489) | -1.138 (0.737) | -1.086 (0.679) |
| Firm age (log) | -0.006 (0.058) | -0.012 (0.059) | 0.016 (0.056) | 0.010 (0.056) | 0.014 (0.056) | 0.013 (0.056) |
| Size (log) | -0.165*** (0.047) | -0.173*** (0.046) | -0.143*** (0.047) | -0.149*** (0.047) | -0.153*** (0.048) | -0.156*** (0.048) |
| Capital (log) | 0.111*** (0.037) | 0.113*** (0.037) | 0.091** (0.038) | 0.09** (0.038) | 0.088** (0.038) | 0.089** (0.038) |
| Years of experience (log) | -0.016 (0.080) | -0.012 (0.079) | 0.065 (0.072) | 0.068 (0.072) | 0.070 (0.073) | 0.071 (0.073) |
| Export | 0.350*** (0.105) | 0.364*** (0.105) | 0.256** (0.103) | 0.256** (0.102) | 0.268*** (0.103) | 0.268*** (0.102) |
| Innovation | 0.249** (0.104) | 0.254** (0.106) | 0.249** (0.097) | 0.242** (0.097) | 0.232** (0.096) | 0.230** (0.096) |
| FDI | -0.757*** (0.148) | -0.746*** (0.166) | -0.843*** (0.170) | -0.839*** (0.169) | -0.842*** (0.68) | -0.846*** (0.166) |
| Ownership | ||||||
Maj. female |
-0.140 (0.121) | -0.124 (0.125) | -0.171 (0.114) | -0.174 (0.115) | -0.170 (0.116) | -0.172 (0.116) |
Equally owned |
-0.259** (0.125) | -0.251** (0.125) | -0.294** (0.119) | -0.292** (0.119) | -0.290** (0.119) | -0.290** (0.119) |
| Intensive margin of CSR | ||||||
[5, 20%[ |
-0.026 (0.10) | -0.027 (0.098) | -0.010 (0.096) | -0.008 (0.096) | -0.035 (0.098) | -0.036 (0.098) |
[20, 100%] |
-0.220* (0.120) | -0.230* (0.121) | -0.18 (0.124) | -0.17 (0.124) | -0.203 (0.124) | -0.207* (0.124) |
| Industry FE | Yes | Yes | Yes | Yes | Yes | Yes |
| Region FE | Yes | Yes | Yes | Yes | Yes | Yes |
| Constant | 11.159*** (0.565) | 11.103*** (0.566) | 10.624*** (0.588) | 10.543*** (0.553) | 10.961*** (0.669) | 10.701*** (0.606) |
| N | 62,520 | 62,520 | 74,440 | 74,440 | 75,110 | 75,110 |
| R2 | 0.575 | 0.571 | 0.553 | 0.554 | 0.554 | 0.554 |
Note: Export = 1 if Yes and 0 if No. Innovation = 1 if Yes and 0 if No. FDI = 1 if Yes and 0 if No. Ownership = 0 if majority-male, 1 if majority-female, and 2 if equally owned. Intensive margin of CSR = 0 if in ]0%, 5%[, 1 if in [5%, 20%[, and 2 if in [20, 100%]. The omitted category in the estimation is 0. Column (1): region, two-digit NAICS, and size cells; Column (2): two-digit NAICS X size cells; Column (3): two-digit NAICS X size (small and medium) cells. Sample weights are applied to meet confidentiality requirements of the Statistics Act. Standard errors in parentheses. *p<0.1, **p<0.05, ***p<0.01.
Sources: Statistics Canada, Survey on Financing and Growth of Small and Medium Enterprises, 2020; Payroll Deductions Account (PD7) and T2 Corporation Income Tax Return 2020; and author's calculation.
Recall that one reason why firms' responses to their perception of competition against non-CSR firms cannot be used directly as the main explanatory variable in Equation 2 is because of potential reverse causality problem. To overcome this issue, as a last robustness check, Equation 2 is estimated using the labour productivity of a CSR firm in 2021 as the dependent variable and the raw measure of competition based on whether the firm where in competition against non-CSR firms in 2020 (Definition 1 and Definition 2) as the main explanatory variable. This strategy also makes the estimation results independent of cell construction.
The results are presented in Table 8. Once again, there is no significant impact of competition from non-CSR firms on the productivity of CSR firms.
| Lab. prod. in 2021 (log) | Definition 1 | Definition 2 |
|---|---|---|
| Comp | -0.086 (0.077) | -0.042 (0.085) |
| Firm age (log) | 0.016 (0.044) | 0.013 (0.044) |
| Size (log) | 0.048 (0.048) | 0.049 (0.048) |
| Capital (log) | 0.027 (0.035) | 0.027 (0.035) |
| Years of experience (log) | 0.059 (0.072) | 0.063 (0.072) |
| Export | 0.173 (0.110) | 0.182* (0.111) |
| Innovation | 0.125 (0.086) | 0.127 (0.085) |
| FDI | -0.404 (0.249) | -0.392 (0.250) |
| Ownership | ||
Maj. female |
-0.251** (0.109) | -0.246** (0.110) |
Equally owned |
-0.239** (0.113) | -0.234** (0.114) |
| Intensive margin of CSR | ||
[5, 20%[ |
-0.033 (0.089) | -0.040 (0.090) |
[20, 100%] |
-0.230** (0.111) | -0.238** (0.111) |
| Industry FE | Yes | Yes |
| Region FE | Yes | Yes |
| Constant | 11.732*** (0.457) | 11.728*** (0.458) |
| N | 72,460 | 72,460 |
| R2 | 0.620 | 0.619 |
Note: Comp = 1 if Yes and 0 if No. Export = 1 if Yes and 0 if No. Innovation = 1 if Yes and 0 if No. FDI = 1 if Yes and 0 if No. Ownership = 0 if majority-male, 1 if majority-female, and 2 if equally owned. Intensive margin of CSR = 0 if in ]0%, 5%[, 1 if in [5%, 20%[, and 2 if in [20, 100%]. The omitted category in the estimation is 0. Sample weights are applied to meet confidentiality requirements of the Statistics Act. Standard errors in parentheses. *p<0.1, **p<0.05, ***p<0.01.
Sources: Statistics Canada, Survey on Financing and Growth of Small and Medium Enterprises, 2020; Payroll Deductions Account (PD7) and T2 Corporation Income Tax Return 2020; and author's calculation.
5. Conclusion
A widely recognized idea suggests that implementing CSR initiatives can potentially provide firms with a competitive edge. To test this assumption, this study uses data from Canadian small and medium-sized businesses and establishes the following findings:
- First, firms that adopt CSR practices exhibit higher productivity levels compared with those that do not.
- Second, there is no discernible productivity gap between CSR firms in competition against non-CSR firms and those that are not. This suggests that firms do not experience significant changes in productivity when competing against non-CSR firms. As a result, the productivity gap between CSR and non-CSR firms is not significantly influenced by the level of competition that CSR firms face from non-CSR firms.
The main innovation in this paper lies in the ability to identify CSR firms engaged in competition with non-CSR firms with the help of a unique dataset. This enables the estimation of the level of competition from non-CSR firms faced by each CSR firm. However, the paper can be expanded in several ways. First, the estimation of the productivity gap between CSR and non-CSR firms does not represent a causal impact of CSR adoption on firm productivity, as it fails to address issues such as selection bias. Employing impact evaluation methods would help mitigate the biases associated with the estimated productivity gap in this paper, enabling a more accurate interpretation of causal effects.
Furthermore, the CSR variable in this research does not encompass various dimensions of CSR. It would be interesting to investigate how the findings of this paper change across specific CSR dimensions. Finally, this research only focuses on the influence of competition from non-CSR firms on the productivity of CSR firms. However, assessing the impact of such competition on other performance variables such as profits, employment growth, and innovation remains a task for future research.
References
Amin, M., & Islam, A. (2015). Are large informal firms more productive than the small informal firms? Evidence from firm-level surveys in Africa. World Development, 74, 374–385.
Amin, M., & Okou, C. (2020). Casting a shadow: Productivity of formal firms and informality. Review of Development Economics, 24(4), 1610–1630.
Amin, M., & Soh, Y. C. (2021). Does greater regulatory burden lead to more corruption? Evidence using firm-level survey data for developing countries. The World Bank Economic Review, 35(3), 812–828.
Aterido, R., Hallward-Driemeier, M., & Pagés, C. (2011). Big constraints to small firms' growth? Business environment and employment growth across firms. Economic Development and Cultural Change, 59(3), 609–647.
Aupperle, K. E., Carroll, A. B., & Hatfield, J. D. (1985). An empirical examination of the relationship between corporate social responsibility and profitability. Academy of Management Journal, 28(2), 446–463.
Baldwin, J. R., Jarmin, R. S., & Tang, J. (2002). The trend to smaller producers in manufacturing: A Canada/US comparison. Statistics Canada, Analytical Studies—Economic Analysis, Series 1F0027MIE, (003).
Bernard, A. B., Eaton, J., Jensen, J. B., & Kortum, S. (2003). Plants and productivity in international trade. American Economic Review, 93(4), 1268–1290.
Black, S. E., & Lynch, L. M. (1996). Human-capital investments and productivity. American Economic Review, 86(2), 263–267.
Børing, P. (2019). The relationship between firm productivity, firm size and CSR objectives for innovations. Eurasian Business Review, 9(3), 269–297.
Bouslah, K., M'Zali, B., Turcotte, M. F., & Kooli, M. (2010). The impact of forest certification on firm financial performance in Canada and the US. Journal of Business Ethics, 96, 551–572.
Carlton, D. W., & Perloff, J. M. (2005). Modern industrial organization (4th ed.). Addison Wesley.
Crifo, P., & Forget, V. D. (2015). The economics of corporate social responsibility: A firm‐level perspective survey. Journal of Economic Surveys, 29(1), 112–130.
De Rosa, D., Gooroochurn, N., & Görg, H. (2010). Corruption and productivity: firm-level evidence from the BEEPS survey. World Bank Policy Research Working Paper, (5348).
Delmas, M. A., & Pekovic, S. (2013). Environmental standards and labour productivity: Understanding the mechanisms that sustain sustainability. Journal of Organizational Behavior, 34(2), 230–252.
Dollar, D., Hallward-Driemeier, M., & Mengistae, T. (2006). Investment climate and international integration. World development, 34(9), 1498–1516.
Donker, H., Poff, D., & Zahir, S. (2008). Corporate values, codes of ethics, and firm performance: A look at the Canadian context. Journal of Business Ethics, 82, 527–537.
European Commission: "Communication from the commission to the European parliament, the council, the European economic and social committee and the committee of the regions: A renewed EU strategy 2011–14 for Corporate Social Responsibility," October 2011, COM(2011) 681 final, p. 7.
Fisman, R., & Svensson, J. (2007). Are corruption and taxation really harmful to growth? Firm level evidence. Journal of Development Economics, 83(1), 63–75.
Girma, S., Görg, H., & Strobl, E. (2004). Exports, international investment, and plant performance: evidence from a non-parametric test. Economics Letters, 83(3), 317–324.
Girma, S., Kneller, R., & Pisu, M. (2005). Exports versus FDI: an empirical test. Review of World Economics, 141, 193–218.
Grekou, D., Watt, J., & Morgan, H. M. (2023). Gender productivity gap: does gender-equal ownership compensate for female entrepreneurs' lack of prior industry experience? Small Business Economics, 60(4), 1543–1571.
Gu, W., & Tang, J. (2004). Link between innovation and productivity in Canadian manufacturing industries. Economics of Innovation and New Technology, 13(7), 671–686.
Gu, W., Yan, B., & Ratté, S. (2018). Long-run Productivity Dispersion in Canadian Manufacturing. Statistics Canada.
Halkos, G., & Nomikos, S. (2021). Corporate social responsibility: Trends in global reporting initiative standards. Economic Analysis and Policy, 69, 106–117.
Hamano, M., & Okubo, T. (2023). The Macroeconomic Dynamics of Generations of Firms (No. 2307).
Hasan, I., Kobeissi, N., Liu, L., & Wang, H. (2018). Corporate social responsibility and firm financial performance: The mediating role of productivity. Journal of Business Ethics, 149, 671–688.
Hejjas, K., Miller, G., & Scarles, C. (2019). "It's like hating puppies!" Employee disengagement and corporate social responsibility. Journal of Business Ethics, 157, 319–337.
Helpman, E., Melitz, M. J., & Yeaple, S. R. (2004). Export versus FDI with heterogeneous firms. American economic review, 94(1), 300–316.
Hoang, N., Nahm, D., & Dobbie, M. (2021). Innovation, gender, and labour productivity: Small and medium enterprises in Vietnam. World Development, 146, 105619.
Innovation, Science and Economic Development Canada (2024). Key Small Business Statistics.
ISO (2018). Social responsibility—Discovering ISO 26000 (accessed on April 17, 2024).
Jovanovic, B., & Rousseau, P. L. (2005). General purpose technologies. Handbook of economic growth (Vol. 1, pp. 1181–1224). Elsevier.
Kamarudin, K. A., Ariff, A. M., & Wan Ismail, W. A. (2022). Product market competition, board gender diversity and corporate sustainability performance: International evidence. Journal of Financial Reporting and Accounting, 20(2), 233–260.
Klepper, S. (1996). Entry, exit, growth, and innovation over the product life cycle. The American economic review, 562–583.
Leung, D., Meh, C., & Terajima, Y. (2008). Firm size and productivity (No. 2008-45). Bank of Canada.
Liang, Y., Cai, C., & Huang, Y. (2022). The effect of corporate social responsibility on productivity: Firm-level evidence from Chinese listed companies. Emerging Markets Finance and Trade, 58(12), 3589–3607.
Mahoney, L., & Roberts, R. W. (2007, September). Corporate social performance, financial performance and institutional ownership in Canadian firms. Accounting Forum (Vol. 31, No. 3, pp. 233–253). No longer published by Elsevier.
Makni, R., Francoeur, C., & Bellavance, F. (2009). Causality between corporate social performance and financial performance: Evidence from Canadian firms. Journal of Business Ethics, 89, 409–422.
McWilliams, A., & Siegel, D. (2001). Corporate social responsibility: A theory of the firm perspective. Academy of Management Review, 26(1), 117–127.
Melitz, M. J. (2003). The impact of trade on intra‐industry reallocations and aggregate industry productivity. Econometrica, 71(6), 1695–1725.
Newman, C., Rand, J., Tarp, F., & Trifkovic, N. (2020). Corporate social responsibility in a competitive business environment. The Journal of Development Studies, 56(8), 1455–1472.
Nyborg, K. (2014). Do responsible employers attract responsible employees? IZA World of Labor
OECD (2023), OECD Guidelines for Multinational Enterprises on Responsible Business Conduct, OECD Publishing, Paris.
Ouimet, P., & Zarutskie, R. (2014). Who works for startups? The relation between firm age, employee age, and growth. Journal of financial Economics, 112(3), 386–407.
Pfeifer, C. (2015). The nexus between top managers' human capital and firm productivity. Applied Economics Letters, 22(12), 982–986.
Rashid, M. H. U., & Hamid, M. A. (2022). Measurement of CSR Performance in Manufacturing Industries: A SEM Approach. International Journal of Social Ecology and Sustainable Development (IJSESD), 13(6), 1–18.
Tirole, J. (1988). The theory of industrial organization. MIT press.
Van Ark, B., & Monnikhof, E. (1996). Size distribution of output and employment: A data set for manufacturing industries in five OECD countries, 1960s–1990.
Vogel, D. (2007). The market for virtue: The potential and limits of corporate social responsibility. Brookings Institution Press.
Wagner, J. (2006). Exports, foreign direct investment, and productivity: Evidence from German firm level data. Applied Economics Letters, 13(6), 347–349.
Appendix
Figure A1: Within-industry distribution of CSR firms

Note: The distributions are weighted, and the rounding rules are set to meet confidentiality requirements of the Statistics Act.
Sources: Statistics Canada, Survey on Financing and Growth of Small and Medium Enterprises, 2020; and author's calculation.
Figure A2: Within-industry distribution of CSR firms' perception of competition against non-CSR firms (definition 1 of competition)
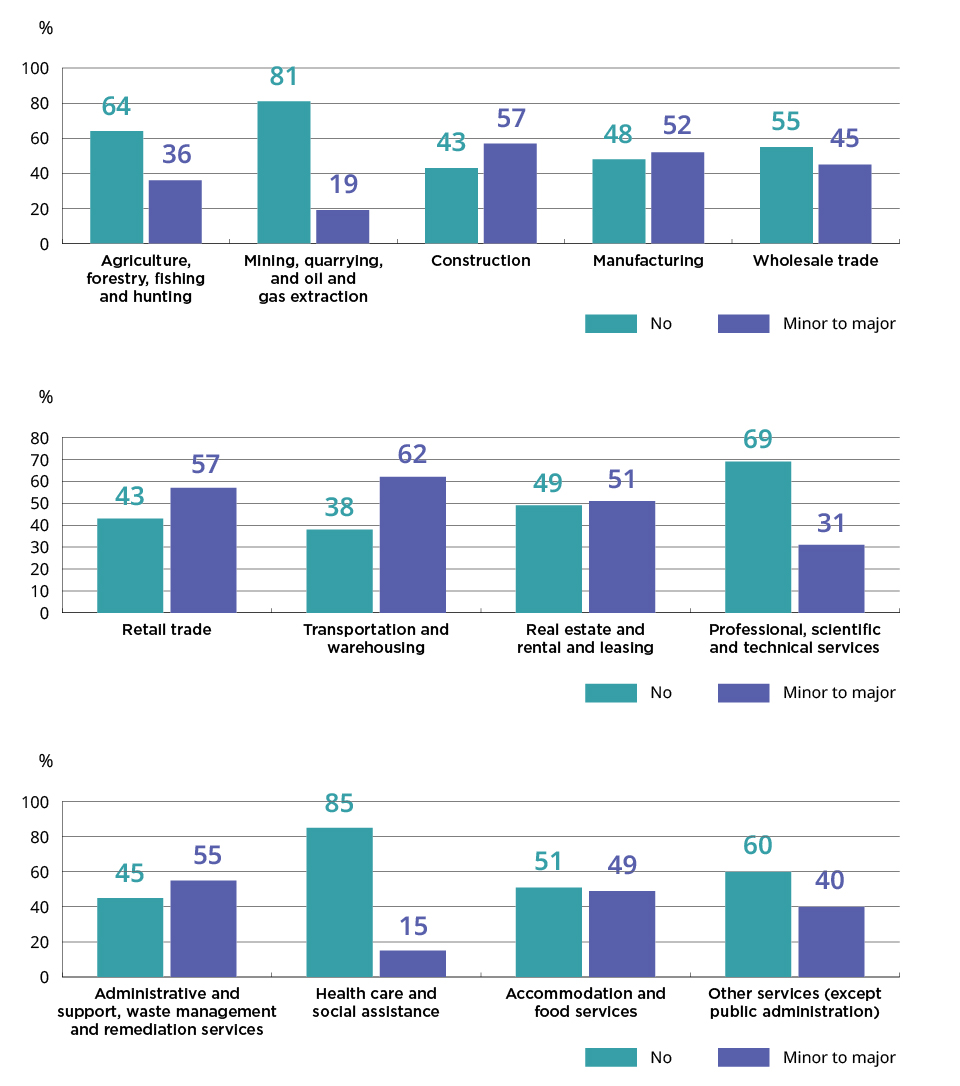
Note: The distributions are weighted, and data from the information and cultural industries, as well as the arts, entertainment and recreation industries, are suppressed to meet the confidentiality requirements of the Statistics Act.
Sources: Statistics Canada, Survey on Financing and Growth of Small and Medium Enterprises, 2020; and author's calculation.
Figure A3: Within-industry distribution of CSR firms' perception of competition against non-CSR firms (definition 2 of competition)

Note: The distributions are weighted, and data for the mining, quarrying, and oil and gas extraction, real estate and rental and leasing, information and cultural industries, as well as the arts, entertainment and recreation industries, are suppressed to meet the confidentiality requirements of the Statistics Act.
Sources: Statistics Canada, Survey on Financing and Growth of Small and Medium Enterprises, 2020; and author's calculation.