
Table of contents
- Abstract
- 1. Introduction
- 2. Interprovincial trade in Canada
- 3. Data source and definitions
- 4. Firm characteristics
- 5. Ownership characteristics
- 6. Growth-related activities
- 7. Conclusion
Abstract
This report presents findings from Statistics Canada's Survey on Financing and Growth of Small and Medium Enterprises 2023 on businesses involved in interprovincial trade, that is, small and medium-sized enterprises (SMEs) that made sales to customers located in another province or territory.
In 2023, nearly one-quarter of SMEs traded goods and services across interprovincial lines in Canada and this represented an average of 5.6% of the total sales. Larger and older enterprises were more likely to be involved in interprovincial trade.
Innovative SMEs, intellectual property holders and exporter SMEs were also more likely to have made sales in another province or territory in 2023.
Finally, businesses involved in interprovincial trade experienced higher sales growth over the period 2021–2023 than those not involved in interprovincial trade.
1. Introduction
Canada's reputation as a globally open economy is well established: as of 2021, Canada had negotiated 15 free trade agreements (FTAs) over the past 25 years, opening market access to 1.5 billion consumers worldwide.Footnote 1 However, Canada's domestic trade remains equally important, especially in the context of economic and geopolitical worldwide disruptions. In 2023, a total value of $532.0 billion in goods and servicesFootnote 2 were exchanged between provinces and territories in Canada.Footnote 3 In comparison, the total value of international exports was $978.4 billion (and international imports was $976.4 billion). Ontario is top-ranked with a total value of $183.9 billion in interprovincial exports and Quebec ranks second with a total value of $103.9 billion. In terms of interprovincial imports total value, Ontario and Quebec ranked first and second, respectively, with $142.7 billion and $95.9 billion. Both provinces have a positive interprovincial trade balance (i.e. the value of interprovincial exports is higher than the value of interprovincial imports). The only other province to have a positive balance in 2023 was Alberta.
The purpose of this profile is to outline the characteristics of small and medium-sized enterprises (SMEs) that made sales outside their province or territory of location. The Survey on Financing and Growth of Small and Medium Enterprises 2023 from Statistics Canada provides a useful source of information on various topics such as business and ownership characteristics, which will help characterize this particular type of SMEs.
The survey reveals that 25.3% of SMEs in Canada were engaged in interprovincial trade in 2023, representing an average of 5.6% of the total sales made that year. Larger and older SMEs were more likely to have made sales in another province or territory. Innovative SMEs, exporters and intellectual property holders were also more likely to be involved in interprovincial trade.
The remainder of this profile is structured as follows:
- Section 2 presents the data and definitions used.
- Section 3 and section 4 outline, respectively, the firm characteristics and ownership characteristics related to businesses involved in interprovincial trade.
- Section 5 presents the findings on growth-related activities.
- The final section concludes this report.
2. Interprovincial trade in Canada
In 2023, the total value of interprovincial tradeFootnote 4 was $532.0 billion: $231.2 billion in goods and $300.8 billion in services (Figure 1). Services were the type of product mostly exchanged by provinces or territories over the period 2009–2023.
Figure 1: Interprovincial trade flow in Canada ($ billions)

Source: Statistics Canada. Table 36-10-0222-01 Gross domestic product, expenditure-based, provincial and territorial, annual (x 1,000,000).
Table 1 shows that the three provinces that had the highest values of interprovincial exports and imports are: Ontario, Quebec and Alberta. The three of them also had a positive trade balance (the total value of interprovincial exports surpassed the total value of interprovincial imports).
| Region | Interprovincial exports | Interprovincial imports | Trade balance |
|---|---|---|---|
| Newfoundland and Labrador | 4.2 | 11.0 | -6.8 |
| Prince Edward Island | 2.2 | 4.1 | -1.9 |
| Nova Scotia | 10.1 | 19.0 | -8.9 |
| New Brunswick | 14.6 | 16.5 | -1.9 |
| Quebec | 103.9 | 95.9 | 8.0 |
| Ontario | 183.9 | 142.7 | 41.2 |
| Manitoba | 25.6 | 28.9 | -3.3 |
| Saskatchewan | 25.9 | 33.9 | -8.0 |
| Alberta | 102.1 | 91.5 | 10.6 |
| British Columbia | 56.4 | 81.2 | -24.8 |
| Yukon | 0.8 | 1.6 | -0.8 |
| Northwest Territories | 1.1 | 2.8 | -1.7 |
| Nunavut | 1.2 | 2.7 | -1.5 |
| Source: Source: Statistics Canada. Table 36-10-0222-01 Gross domestic product, expenditure-based, provincial and territorial, annual (x 1,000,000). | |||
The products representing the highest values involved in the interprovincial trade flow in 2021Footnote 5 were: conventional crude oil ($16.6 billion), personal and household goods ($11.6 billion), computer systems design and related services (except software development) ($11.3 billion), machinery, equipment and supplies and food ($10.0 billion), beverages and tobacco products ($7.2 billion).Footnote 6
3. Data source and definitions
The data used in this report are from Statistics Canada's Survey on Financing and Growth of Small and Medium Enterprises 2023 (SFGSME 2023). The survey was designed to collect various information on SMEs such as financing activities, growth, ownership characteristics and innovation activities.
The target population consisted of enterprises with 1 to 499 employees and a gross revenue of $30,000 or more.Footnote 7 This corresponds to the definition of SME used in this report. The survey's target population was constituted of 901,516 enterprises and the base sample size was 22,084. The response rate was computed as 52.4%.
In particular, the survey gathered information on the destination of sales made by the enterprises, such as within the local municipality or in another province or territory (rest of Canada). Therefore, SMEs involved in interprovincial trade in 2023 are those that made sales outside of the province or territory where they are located. They will be referred to as ‟interprovincial traders" in the rest of the paper.
4. Firm characteristics
In 2023, 25.3% of SMEs were interprovincial traders, and sales in the rest of Canada represented an average of 5.6% of the total sales made by SMEs (Figure 2 and Figure 3).
Figure 2: Sales destination by percentage of SMEs

Source: Statistics Canada, Survey on Financing and Growth of Small and Medium Enterprises, 2023.
Figure 3: Average percentage of sales by sales destination

Source: Statistics Canada, Survey on Financing and Growth of Small and Medium Enterprises, 2023.
More than half of the sales made by interprovincial traders were destined for consumers and 40.1% were destined for businesses. Around 5% of sales made by interprovincial traders were for the government (Figure 4).
Figure 4: Interprovincial traders' sales breakdown (%)

Source: Statistics Canada, Survey on Financing and Growth of Small and Medium Enterprises, 2023.
As shown in Figure 5, interprovincial traders tend to be larger firms. Around 18% of interprovincial trader SMEs had between 20 and 499 employees compared with 9.7% of non-interprovincial traders.
Figure 5: Distribution of interprovincial traders and non-interprovincial traders by firm size

Source: Statistics Canada, Survey on Financing and Growth of Small and Medium Enterprises, 2023.
Older firms are more likely to have made sales in the rest of Canada than younger ones (Table 2). For example, only 18.0% of SMEs aged two years or less were interprovincial traders compared with 27.9% of SMEs aged more than 20 years.
| Firm age | Interprovincial traders | Non-interprovincial traders |
|---|---|---|
| Two years or younger | 18.9 | 81.1 |
| 3 to 10 years old | 25.0 | 75.0 |
| 11 to 20 years old | 25.0 | 75.0 |
| More than 20 years old | 27.9 | 72.1 |
| Source: Statistics Canada, Survey on Financing and Growth of Small and Medium Enterprises, 2023. | ||
The percentage of interprovincial traders varies greatly among regions. Quebec had the lowest percentage with 22.2% of SMEs that made sales in the rest of Canada in 2023 and Manitoba had the highest percentage, with 35.3% (Figure 6).
Figure 6: Percentage of interprovincial traders and non-interprovincial traders by region

Source: Statistics Canada, Survey on Financing and Growth of Small and Medium Enterprises, 2023.
Approximately 59% of SMEs in the wholesale trade sector made sales in the rest of Canada (Table 3), followed by manufacturing (46.7%) and transportation and warehousing (34.1%). Construction had the lowest percentage of interprovincial traders, with 9.4%.
| Industry sector | Interprovincial traders | Non-interprovincial traders |
|---|---|---|
| Primary† | 22.9 | 77.1 |
| Construction | 9.4 | 90.6 |
| Manufacturing | 46.7 | 53.3 |
| Wholesale Trade | 58.7 | 41.3 |
| Retail Trade | 32.6 | 67.4 |
| Transportation and Warehousing | 34.1 | 65.9 |
| Professional, Scientific and Technical Services | 32.8 | 67.2 |
| Accommodation and Food Services | 23.6 | 76.4 |
| Other Services | 16.3 | 83.7 |
| Other Sectors†† | 17.9 | 82.1 |
|
Notes: † The primary sector consists of the following sectors: Agriculture, Forestry, Fishing and Hunting (NAICS 11), Mining and Oil and Gas Extraction (NAICS 21). †† The other sectors are: Information and Cultural Industries (NAICS 51), Real Estate and Rental and Leasing (NAICS 53), Administrative and Support, Waste Management and Remediation Services (NAICS 56), Health Care and Social Assistance (NAICS 62), Arts, Entertainment and Recreation (NAICS 71). Source: Statistics Canada, Survey on Financing and Growth of Small and Medium Enterprises, 2023. |
||
Exporters tend to be interprovincial traders in contrast with non-exporters: 75.0% of exporters made sales in the rest of Canada while only 16.5% of non-exporters did (Figure 7).
Figure 7: Percentage of SMEs by export status

Source: Statistics Canada, Survey on Financing and Growth of Small and Medium Enterprises, 2023.
In terms of legal status, more interprovincial traders were incorporated than non-interprovincial traders (94.5% versus 90.8%) (Figure 8). It is worth nothing that 57.4% of unincorporated interprovincial traders were sole proprietors in comparison with 74.2% of unincorporated non-interprovincial traders.
Figure 8: Distribution of interprovincial and non-interprovincial traders by legal status

Source: Statistics Canada, Survey on Financing and Growth of Small and Medium Enterprises, 2023.
5. Ownership characteristics
SFGSME 2023 collects, in particular, information on the primary decision maker, that is, the person primarily responsible for making decisions about the business. This person could be the majority owner, the chairperson of the board, etc.
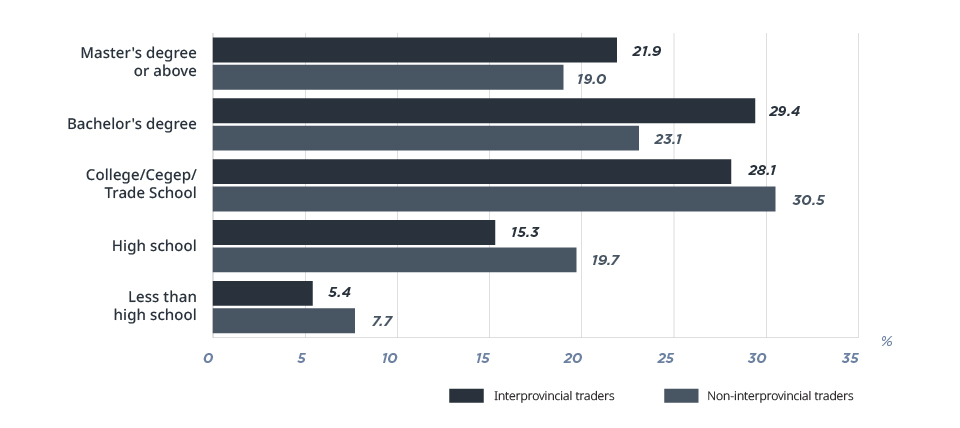
Figure 9 shows that the primary decision makers of interprovincial trader SMEs tend to be more highly educated than the primary decision makers of non-interprovincial traders. Approximately half (51.3%) of the primary decision makers of interprovincial traders had a university degree compared with 42.1% of non-interprovincial traders.
Figure 9: Highest level of education attained by the primary decision maker (percentage of SMEs)
Source: Statistics Canada, Survey on Financing and Growth of Small and Medium Enterprises, 2023.
The percentage of SMEs that are interprovincial traders is similar for majority men-owned businesses (25.7%) and for majority women-owned businesses (25.1%) (Figure 10). Around 30.8% of majority black-owned businesses were interprovincial traders and 32.2% of SMEs majority owned by 2SLGTQ+ were also interprovincial traders. This is higher than the percentage of all SMEs (25.3%).Footnote 8
Figure 10: Percentage of interprovincial and non-interprovincial traders by majority ownership demographics

Source: Statistics Canada, Survey on Financing and Growth of Small and Medium Enterprises, 2023.
6. Growth-related activities
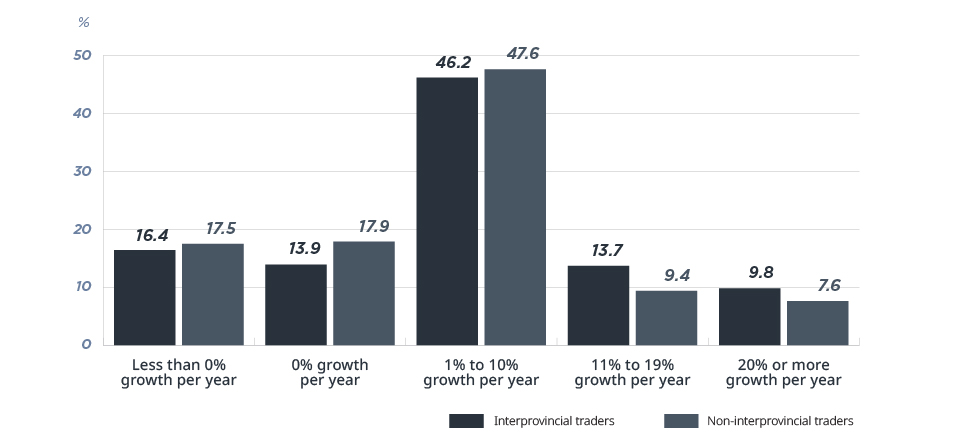
Results from the survey show that interprovincial traders experienced higher sales growth over the period 2021–2023 than non-interprovincial traders (Figure 11). In particular, 23.5% of SMEs that were interprovincial traders had an average yearly growth rate of more than 10% compared with 17.0% for SMEs that were non-interprovincial traders.
Figure 11: Percentage of SMEs by average yearly growth sales categories, 2021–2023
Source: Statistics Canada, Survey on Financing and Growth of Small and Medium Enterprises, 2023.
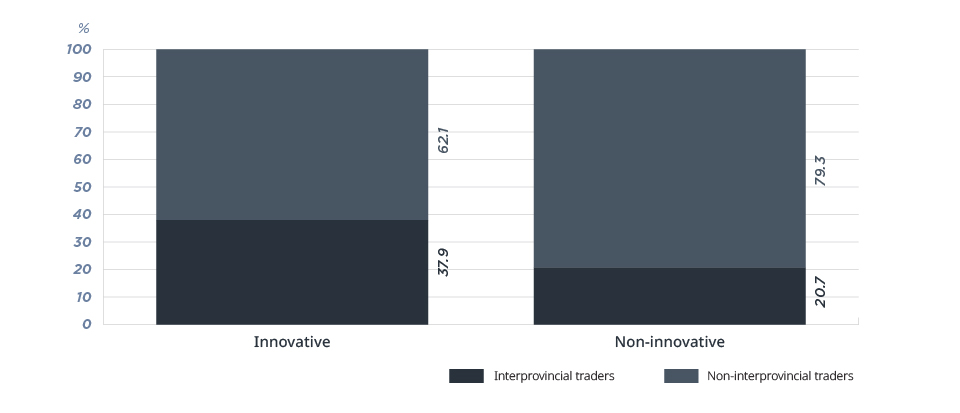
Moreover, SMEs that intended to expand into new markets were more likely to be interprovincial traders than SMEs without expansion plans (27.6% versus 21.2%). SMEs that were innovativeFootnote 9 tended to be SMEs that were interprovincial traders in comparison with non-innovative SMEs (37.9% versus 20.7%) (Figure 12).
Figure 12: Percentage of interprovincial traders and non-interprovincial traders by innovation status
Source: Statistics Canada, Survey on Financing and Growth of Small and Medium Enterprises, 2023.
Figure 13 shows that near half (47.9%) of SMEs that hold formalFootnote 10 intellectual property (IP) in 2023 were also interprovincial traders. Only 21.6% of SMEs that did not hold IP were interprovincial traders in 2023.
Figure 13: Percentage of interprovincial traders and non-interprovincial traders by intellectual property status

Source: Statistics Canada, Survey on Financing and Growth of Small and Medium Enterprises, 2023.
7. Conclusion
The Survey on Financing and Growth of Small and Medium Enterprises 2023 (SFGSME) contains insightful information that helps characterize small and medium-sized enterprises (SMEs) that were involved in interprovincial trade in 2023.
The SFSGME reveals that approximately 25% of SMEs made sales outside their province or territory location. On average, that represented 5.6% of the total sales made by the SMEs during that year. By comparison, the total sales made within the local municipality or region represented 72.4% of total sales. Manitoba had the highest percentage of interprovincial traders with 35.3% of SMEs and Quebec had the lowest percentage with 22.2%.
In terms of industry sector, the top three sectors with the highest proportion of SMEs that were interprovincial traders were the wholesale trade sector (58.7%), the manufacturing sector (46.7%) and the transportation and warehousing sector (34.1%). Interprovincial traders were also more likely to be larger, older and incorporated businesses. Those SMEs experienced higher growth rates in sales over the period 2021–-2023 in comparison with non-interprovincial traders.
SMEs engaged in growth-related activities such as export, innovation and holding intellectual property tended to be involved in interprovincial trade as well. Finally, the survey shows that the primary decision maker of interprovincial traders tended to be more highly educated than those from non-interprovincial traders (51.3% versus 42.1%).