
Table of contents
- Abstract
- 1. Introduction
- 2. Background
- 3. Data
- 4. Business performance of the VCAP-backed companies
- 5. Regression analysis
- 6. Conclusion
- References
Abstract
Launched in 2014, the Venture Capital Action Plan (VCAP) was designed as a market-oriented approach to increase the availability of financing for innovative Canadian firms. This program invested capital in four national funds-of-funds and four high-performing venture capital funds through the Business Development Bank of Canada (BDC) to help high-potential start-ups grow and innovate.
VCAP's Performance Measurement Framework includes an analysis of the economic performance and innovation performance of the companies backed by VCAP. This study examines the business performance of the VCAP-backed firms across short, medium, and long terms, recognizing that the impact of venture capital funding may differ across various time frames.
This empirical study uses the administrative VCAP data collected by BDC that provides information on the individual rounds of venture capital investments. This dataset was linked with the business registration and tax filing data through Statistics Canada's Linkable File Environment, which provides information on the operational and financial status at the firm level.
The vast majority of the VCAP-backed companies tended to receive the funding at a young age and with a small employment size. Compared with a comparison group of non-VCAP-backed businesses with similar firm characteristics, the VCAP-backed companies possessed a larger proportion of high-growth firms in terms of employment and revenue. At each quartile of revenue, the VCAP-backed companies experienced higher growth than the comparison group from 2016 to 2020 and ended with a higher revenue level in 2020.
Regression analysis shows that, compared with the non-VCAP-backed companies, those receiving VCAP investment had a higher level of employment and spent more on research and development in the concurrent year as well as in the subsequent year. The VCAP-backed companies also demonstrated an increased growth rate in these two measures in the year following the VCAP funding, but this effect diminished during a three-year period.
The level and growth rate of revenue do not seem to be significantly correlated with VCAP investment in either one year or three years following the VCAP investment. This is probably because the impact on revenue requires time to manifest. Future research may explore the long-term effect when newer data become available.
1. Introduction
The Venture Capital Action Plan (VCAP) was announced in 2013 and launched in 2014. It was designed as a market-oriented approach to put Canada's venture capital (VC) industry on the path to sustainability, making it more globally competitive and increasing the availability of financing for innovative Canadian firms. The Government of Canada supported the growth of the Canadian VC industry by co-investing with private sector investors in VC funds-of-funds and VC funds under VCAP.
Delivered by the Business Development Bank of Canada (BDC) on behalf of the Government of Canada, $340 million was invested in four national funds-of-funds, and an additional $50 million was committed to four high-performing VC funds. Selected recipients raised additional private sector capital and invested in portfolio companies (and VC funds, which then invested in portfolio companies, in the case of funds-of-funds). These investments attracted significant private sector capital, as demonstrated by the four funds-of-funds raising $1.356 billion from public and private sources, including the Government of Canada's investment.
A Performance Measurement Framework (PMF)Footnote 1 was developed to assess the program and lists the metrics that will be used to evaluate the performance of VCAP in delivering on its objectives and outcomes. As per the PMF, "the major outcome expected from the program is to demonstrate to the private sector that investing in the VC asset class has the potential of positive returns, thereby increasing ongoing investment activity in Canadian VC funds. This entails investing in high-potential Canadian firms and the realization of profitable returns from these investments." The PMF also outlines that one of VCAP's objectives and expected results is to "increase the number of successful Canadian companies by encouraging private sector investments in early-stage risk capital and helping to ensure high-potential innovative firms have access to financing."
Indicators of this expected result are set out in the PMF as:
- the economic and financial performance of the Canadian companies backed by the Venture Capital Action Plan in terms of employment growth and growth in revenue/sales, including exports; and
- the innovation performance of the Canadian companies backed by the Venture Capital Action Plan in terms of the number of employees and research and development (R&D) spending.
In alignment with the PMF, this study seeks to assess the effectiveness of VCAP's investments on VCAP-backed companies, compared with similar companies that were not backed by VCAP.
In this study, "VCAP-backed companies" are defined as portfolio companies that received investment directly from VCAP recipient VC funds and funds-of-funds, and from Canadian VC funds that received investments from the VCAP recipient funds-of-funds; and "non-VCAP-backed companies" are those that have not received investment from these funds.
This study examines the economic performance of the VCAP-backed companies in terms of employment and revenue. It also analyzes the innovation performance of the VCAP-backed companies compared with non-VCAP-backed companies. The empirical research was conducted across various time frames: the quartile analysis covers a period of up to five years following the investment from VCAP fundings, whereas the regression analysis focuses on the one-year and three-year effects of the investments. In the future, when newer data become available, it will be possible to expand the regression analysis to explore the impact of this program over longer periods.
- The next section of this paper provides a general overview of the background and development of the VCAP program.
- The third section introduces the data used for this analysis and summarizes the firm characteristics of the companies that received VCAP funding.
- The fourth section compares the business performance of the VCAP-backed companies with a benchmark comparison group.
- The fifth section presents the results from regressions that estimate the effect of VCAP investment on business and innovation performance.
- The final section presents the conclusions of this study.
2. Background
Venture capital is a type of equity investment and a critical source of financing and expertise. It helps highly innovative enterprises scale novel ideas, commercialize and access new markets.
Prior to the launch of VCAP, a review conducted by the BDC identified a number of issues faced by the Canadian venture capital ecosystem beyond the simple lack of capital, including:
- persistent low returns for venture capital investors, resulting in a lack of private-sector investor confidence;
- the reluctance of institutional investors, such as banks and pension funds, to invest in innovative early-stage companies;
- the relatively small size of venture capital funds in Canada; and
- a shortage of experienced fund managers capable of leading successful venture capital funds.Footnote 2
Following the Government of Canada's Budget 2012 commitment to supporting the VC ecosystem, VCAP was introduced in 2013 and officially launched in 2014. The VCAP had the objective of attracting additional capital into the Canadian market and sought to support the creation of Canadian-based private investors in the VC asset class. Through VCAP, the Government of Canada invested $390 million through two streams, investing funds-of-funds and high-performing funds.
The first stream committed $340 million to four funds-of-funds, specifically HarbourVest Partners, Kensington Capital Partners, Northleaf Capital Partners, and Teralys Capital. These fund-of-funds functioned primarily as an investor in other VC funds but also invested directly in companies. The funds-of-funds stream of VCAP focused on achieving competitive returns while incenting private capital into the market, with the goal of matching public sector capital with private sector capital (with a ratio of $1 committed from the public sector to a minimum $2 committed from the private sector).
The second stream invested $50 million in four high-performing funds, specifically Lumira Capital, Real Ventures, CTI Life Sciences, and Relay Ventures. The funds selected for this stream invested directly in enterprises. Following the launch, the selected managers supported across both streams have drawn down on capital available since 2014.
Selection criteria for VCAP funds managers were aligned with existing market principles/practices. The terms of investment were consistent with market standards. Investments in VCAP recipient funds were managed by the BDC, and the federal government was not involved in the BDC's day-to-day management of these investments. Furthermore, VCAP functions separately from the BDC's normal VC investment activities.
A Canadian analysis evaluating the impact of VC on firm performance (Kelly and Kim, 2013) found that companies backed by VC outperformed those without VC funding. VC-backed companies showed greater long-term growth in sales, wages, and employment, along with higher short-term spending in research and development. However, this research covers VC-backed companies in general and was conducted before the implementation of VCAP. It is therefore important for Innovation, Science and Economic Development (ISED) to conduct this study to provide policy-makers and the general public with a better understanding of the impact of VCAP on firm performance.
3. Data
This empirical study uses the administrative VCAP data collected by the BDC, which includes about 330 individual investments into portfolio companies made by recipient VC funds and funds-of-funds supported by VCAP, including VC funds supported by the VCAP recipient funds-of-funds, from 2014 to 2020.
The dataset contains information on each round of investment as well as the recipient company's basic information, including legal business name, operating business name, and business number. This administrative data was linked to the Business Register (BR) data and tax filing data through Statistics Canada's Linkable File Environment, which provides information on the operational and financial status at the firm level from 2011 to 2020.
To provide a benchmark for analyzing the business performance, Statistics Canada selected a comparison group of enterprises from the Business Register data by using a propensity score matching (PSM) method.
PSM facilitates the creation of treatment and control groups that are more closely aligned in terms of observed characteristics, mitigating potential selection bias and increasing the accuracy of causal inference. Given that the decision to fund a company by a VCAP-supported fund is not likely random, PSM is a suitable method to choose the comparison group.
At the first stage, Statistics Canada estimated the probability that an enterprise could have been backed by VCAP (the propensity score), conditional on age, employment, North American Industry Classification System (NAICS), and financial indicators. At the second stage, a list of 80 non-VCAP-backed businesses were assigned to each VCAP-backed enterprise with the same 6-digit NAICS and with the closest propensity score.Footnote 3
Finally, among the 80 candidates, the four enterprises with the smallest Manhattan distanceFootnote 4 to the corresponding VCAP-backed enterprise were selected to construct the final comparison group. There was a total of about 1,300 comparison enterprises and none of them were matched to more than one VCAP-backed enterprise.
It is important to note that it is not known whether the VCAP-backed or non-VCAP-backed companies received VC investments through sources other than the VCAP program funds.
Figure 1 presents the number of investments by VCAP-supports funds in portfolio companies from 2014 to 2020. To protect the identity of each VCAP-back company, the totals in Figure 1 include the initial and follow-on investments, with each counted as a separate investment.
The number of VCAP-supported portfolio investments increased from 2014 to 2016, followed by a significant decrease in 2017. From 2018 to 2020, there was a downward trend, with VCAP-supported investments decreasing steadily, which was expected given the lifecycle for a VC Fund. VC funds commonly have an active investment period of five years, followed by a "support or harvesting period" of another five years, during which the fund may invest further capital into portfolio companies identified in the investment period but usually not into any new companies.
Figure 1: Counts of investments in portfolio companies by VCAP supported funds by year, 2014–2020

Sources: VCAP administrative data, the Business Register data, and the GIFI tax filing data.
Note: This figure reports the number of investments in companies by VCAP recipient funds and funds-of-funds, and by Canadian VC funds that received investment by VCAP funds-of-funds. These figures are based on voluntary reporting. It is possible that one company received multiple investments in different years (i.e., it may include follow-on investments).
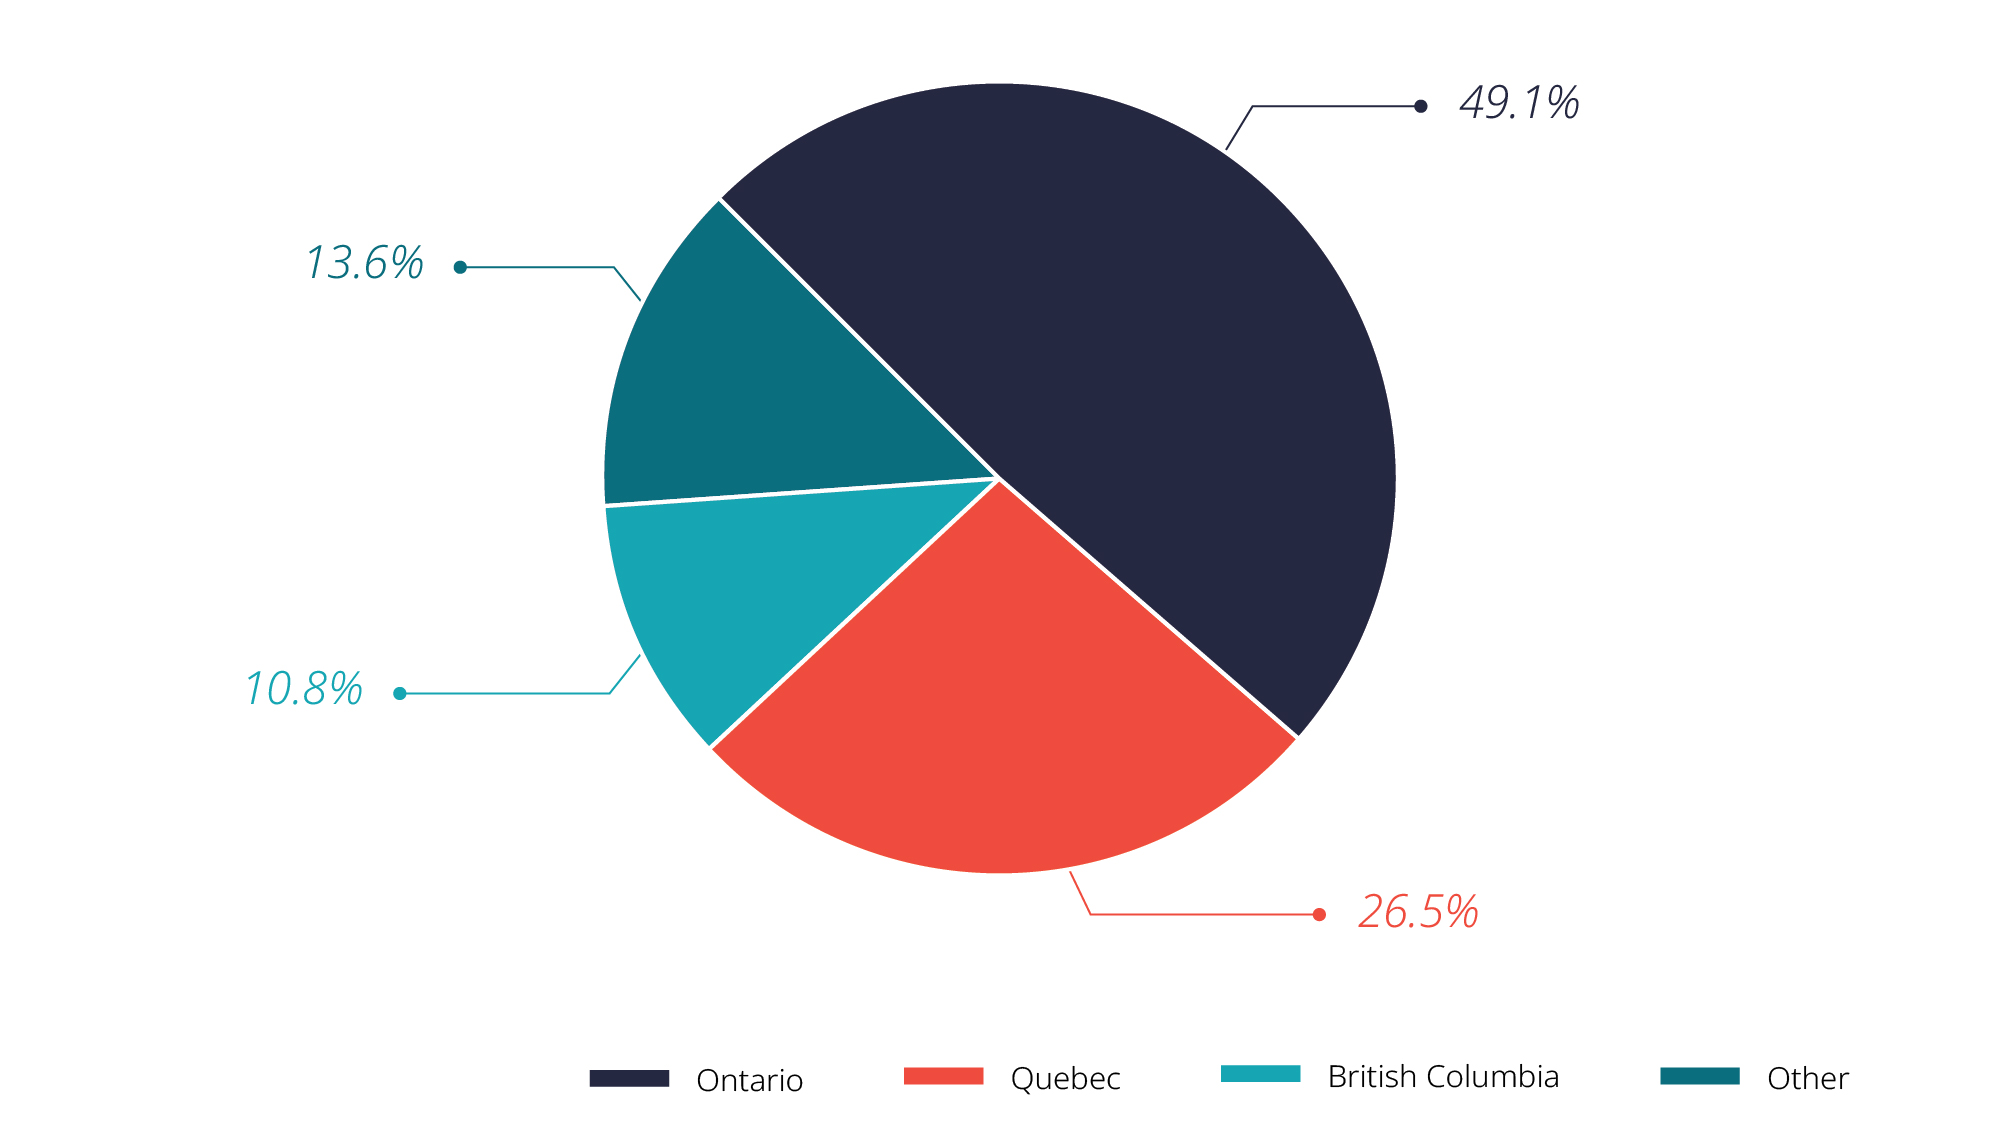
In terms of the distribution of VCAP-backed companies, among all the provinces and territories, Ontario had the highest share, with almost half of all companies that received investment located in this province (Figure 2). Quebec had the second-largest share, accounting for a quarter these companies. British Columbia (BC) had the third-highest share at 10.8%. The remaining 13.6% of VCAP-backed companies were located in the other provinces and territories.Footnote 5 This distribution is consistent with the geographic distribution of the funds supported by VCAP, where Ontario, Quebec, and British Columbia hold the highest rankings among fund locations.Footnote 6 It is also consistent with overall Canadian VC industry activity being concentrated in these three provinces, as outlined in market overview reporting by the Canadian Venture Capital and Private Equity Association.Footnote 7
Figure 2: Geographic distribution of companies VCAP-backed companies
Sources: VCAP administrative data, the Business Register data, and the GIFI tax filing data.
Regarding age, most companies were young when they received investment supported by VCAP. As shown by Figure 3, around two fifths of them were one year old or younger; another one-fifth of VCAP-backed companies were aged between two and three years. This age distribution signals the preference of VCAP-backed funds to invest in early-stage companies and aligns with the focus of the VCAP initiative to support early-stage venture capital, with some growth equity or expansion capital investments throughout the life cycle of such investments.
Figure 3: VCAP-backed companies by firm age

Sources: VCAP administrative data, the Business Register data, and the GIFI tax filing data.
VC funds and funds-of-funds supported by VCAP made investments in relatively small companies—Figure 4 shows that about one-third of companies invested in had five employees or less. This is consistent with other research on companies that receive venture capital funding; for example, Tu et al. (2020) demonstrates that companies receiving VC funding are generally small, with a mean of 15 employees. This distribution by employment could be aligned with the age distribution, as smaller companies may be younger or at an earlier stage of development, whereas larger companies may be more mature.
Figure 4: Employment size of VCAP-backed companies in the year of receiving the investment

Sources: VCAP administrative data, the Business Register data, and the GIFI tax filing data.
4. Business performance of the VCAP-backed companies
This section summarizes the business performance of VCAP-backed companies. To provide a basis for the analysis, a comparison group of firms was selected from Statistics Canada's business register data, as described in section 3. This comparison group consists of about 1,300 firms that did not receive VCAP support.
They were chosen by a propensity score matching method that was based on similarities in financial indicators (e.g., revenue, expenses), employment, age, and industry as the VCAP-backed companies. However, this data does not indicate whether these companies have received VC funding from other sources. Consequently, the analysis in this study compares VCAP-backed companies with all other companies collectively.
Figure 5 shows that the vast majority (79.8%) of companies increased their employment one year after receiving the VCAP-backed funding; whereas less than half (48.8%) of the companies in the comparison group had an increase. A lower proportion (9.9%) of VCAP-backed companies experienced a decline in employment than the comparison group (28.4%). The share of companies whose employment had no change is also lower among the VCAP-backed companies (10.3%) than the comparison group (22.7%). This seems to indicate that VCAP may help young, innovative companies to hire more employees. With the majority of companies being younger and smaller, investing in human capital can be an integral component of growth. In contrast, a smaller proportion of non-VCAP-backed companies (48.8%) experienced employment growth.
Figure 5: Employment changes in the year after the VCAP-backed investment

Sources: VCAP administrative data, the Business Register data, and the GIFI tax filing data.
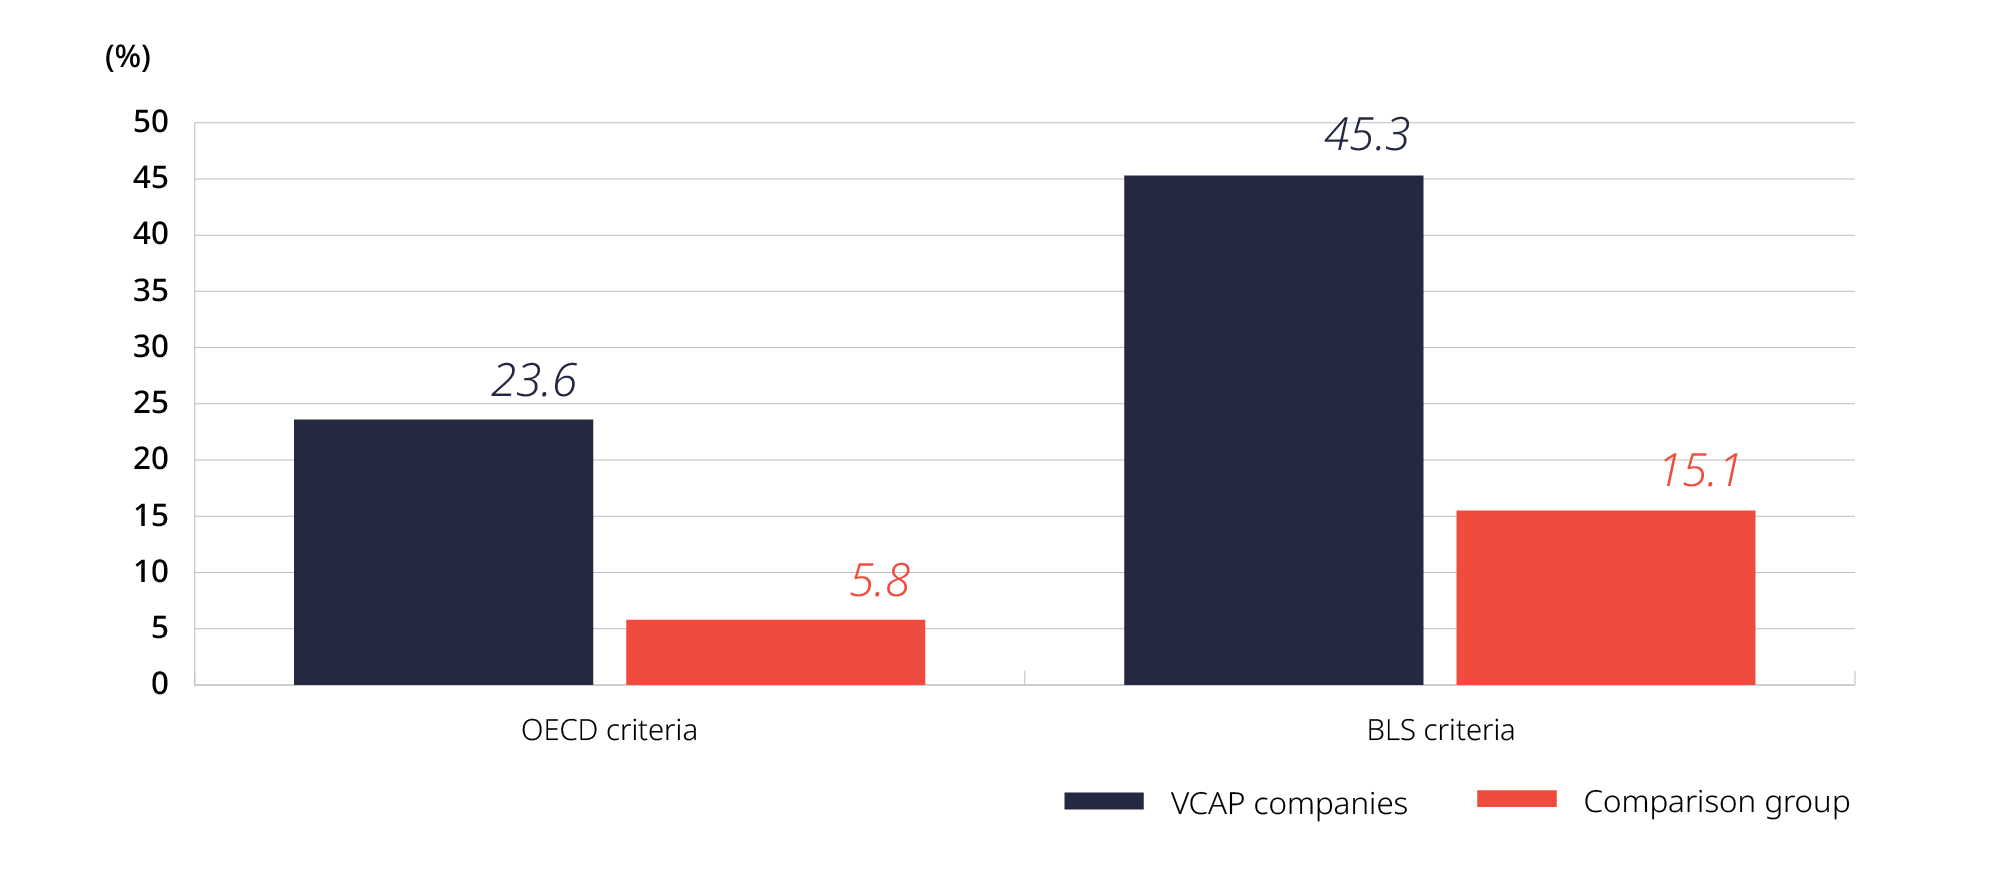
Figure 6 demonstrates that VCAP-backed companies have a higher proportion of high growth in employment, using the criteria developed by either the Organization for Economic Cooperation and Development (OECD) or U.S. Bureau of Labor Statistics (BLS).
The OECD defines high employment growth as a firm with 10 or more employees at the beginning of the period that has average annualized growth greater than 20% per year over a 3-year period (Eurostat-OECD, 2007). Based on this definition, 23.6% of VCAP enterprises qualified as high-growth firms.
Alternatively, by the U.S. BLS criteria, a business is classified as a high employment-growth firm if the firm has fewer than 10 employees at the beginning of the period and grows by eight or more employees over a three-year period; or if the firm has 10 or more employees and has average annualized growth greater than 20% per year over a three-year period or 72.8% over this period (Clayton et al., 2013).
Approximately 45% of VCAP enterprises are high-growth firms, based on this definition. Under either scenario, a higher percentage of VCAP-backed companies qualified as high-growth firms in terms of employment, relative to the comparison group. This could be indicative that the VCAP funding is more likely to support and foster high-growth companies.
Figure 6: Share of high employment growth firms, three years after the VCAP-backed investment
Sources: VCAP administrative data, the Business Register data, and the GIFI tax filing data.
High revenue growth of firms, defined by the OECD criteria as firms with average annualized growth greater than 20% per annum, was also measured over a three-year period. Of the companies backed by VCAP investment, 25% of these companies achieved growth of greater than 20% per annum during the three years after receiving the investment (Figure 7). This differs from the comparison group, of which only 10.7% demonstrated a comparable level of growth.
Figure 7: Share of high revenue growth firms, three years after the VCAP-backed investment

Sources: VCAP administrative data, the Business Register data, and the GIFI tax filing data.
To illustrate the trend of revenue over time, the revenues from 2016 to 2020 are stratified into quartiles and plotted in Figure 8. It presents the values of the first, second, and third quartilesFootnote 8 of the VCAP‑backed companies and of the comparison group over the five-year period.Footnote 9 The samples are restricted to businesses that report revenue information for each year from 2016 to 2020. After this filter, there are 229 businesses from the in VCAP-backed cohort and 932 businesses from the comparison group.
Figure 8: Revenue quartiles for the VCAP-backed companies and the comparison group, 2016–2020

Sources: VCAP administrative data, the Business Register data, and the GIFI tax filing data.
Note: "1st, 2nd and 3rd quartiles" refer to their ceilings.
For the first quartile, the comparison firms started with higher revenue in 2016, relative to the VCAP firms. It was not until 2018 that VCAP firms surpassed the comparison group. In general, the respective growth rate of the VCAP population was higher than the comparison group.
For the second quartile (median), while both groups experienced a positive growth trajectory (increasing in 2017, 2018, and 2019 and then declining 2020), the respective growth rate for the VCAP group was higher.
They started with a lower revenue than the comparison group in 2016, but their median revenue surpassed the comparison group quickly in the following years. In 2020, the VCAP-backed companies' median revenue reached 2.5 times as much as the comparison group.
For the third quartile, the VCAP firms started with higher revenue in 2016, relative to the comparison group. Both groups experienced an increase in 2017, 2018, and 2019 and then declined in 2020. The respective growth rate for each year of the VCAP population was higher. A modest drop was experienced in 2020—which could be indicative of firms sampled having greater exposure to certain economic impacts of COVID-19 (e.g., disruptions in the supply chains, public health closures). It is noticeable that the gap between the VCAP-backed companies and the comparison group widened during these five years. In 2020, the VCAP-backed companies' revenue at the third quartile is 0.86 times higher than that of the comparison group.
In addition to business performance, a company's innovation performance is another important criterion to measure the effect of the VCAP program. Figure 9 shows that over 56% of VCAP-backed companies incurred research and development (R&D) expenditures, whereas the proportion for the comparison group is only 39%.Footnote 10
Figure 9: Share of companies that spend on research and development

Sources: VCAP administrative data, the Business Register data, and the GIFI tax filing data.
5. Regression analysis
5.1 Regression model
The performance indicators discussed in the preceding section are descriptive statistics. Simply comparing these figures between the VCAP-backed companies and the comparison group could lack accuracy, as it does not account for additional factors that could influence business performance. Therefore, this study also employs regression analysis to investigate the correlation between VCAP investment and a company's economic performance while accounting for other pertinent variables.
In addition to the VCAP indicator, this regression model incorporates a number of control variables that likely affect the economic performance. Considering the persistency of employment, revenue, and R&D spending over time, the dependent variable lagged by one year is included to control for the autocorrelation.
Firm age can be a proxy for the experience and accumulated knowledge of the company's workforce, which could affect productivity, innovation, and overall performance. By including age, the model capture the experience-related effects. Moreover, this effect may eventually reach a saturation point or decline in the long run. The square of age is thus added to the model to allow for a potential non-linear relationship.
Companies located in different regions often face varying economic and political environment, such as natural resources, infrastructure development, labour force composition, market size, policies and regulations.
By incorporating a region variable, this regression model then accommodates the distinction across different areas in Canada. Different industries exhibit unique characteristics, such as levels of capital intensity, labour requirements, and technological sophistication. Including an industry variable captures these sector-specific dynamics.
This regression also includes a couple of financial indicators, total expenses and working capital, to measure a company's financial health and stability. For example, higher expenses could potentially influence a company's ability to expand its workforce or invest in revenue-generating activities.
Similarly, adequate working capital may provide companies with the flexibility to pursue growth opportunities, such as acquiring new assets, entering new markets, or investing in employee training and development.
Since the dataset is a panel data, the following fixed effect regression model is used to control for time-invariant heterogeneity. It estimates the effect on the VCAP-backed companies' performance, which is measured by employment, revenue, and research and development.
where,
- Y measures the business and innovation performance of a firm, it is the number of employees, or the total revenue, or the spending on research and development in a year; the natural logarithm of Y is the dependent variable of this equation;
- Subscript i denotes a company and t stands for the year of observation;
- VCAP is a binary variable indicating whether a firm received VCAP investment in a year;
- , the coefficient before VCAP, measures the effect of VCAP on business performance (Y) in the year that a firm received VCAP funding;
- VCAP_lagged is a binary variable indicating whether a firm received VCAP investment in the previous year; its coefficient then measures the effect of VCAP in the subsequent year;
- Y_lagged measures the value of the dependent variable in the year before the observation year;
- Age measures the age of the firm and Age2 is its squared; the quadratic form assumes that the relationship between business performance and firm age follows a bell-shaped curved;
- Region is the geographic location where the firm is located, including Ontario, Quebec, British Columbia, and the rest of Canada;
- Industry refers to the firm's industrial sector, as measured by the one-digit North American Industry Classification System;Footnote 11
- X is a vector of financial characteristic variables, including total expenses and working capital;Footnote 12
- u denotes the fixed effects;
- is an independent and identically distributed residual.
In addition to the level of the business performance measures, it is also interesting to study the relationship between VCAP investment and the growth of this measure, as specified by the following fixed effect regression model:
where,
- Y is the same set of business performance measures, as defined in equation (1). It includes the employment, revenue, and R&D expenditure. The dependent variable of equation (2) is then the average growth rate in Y in years. It is calculated as:
- Subscript indicates the number of years of difference. This study considers two values for : 1 and 3 (years);Footnote 13
- By definition, the growth rate is negatively correlated with the value of Y in the base year, the variable is thus added to the right-hand side of the equation to control for this effect.
5.2 Descriptive statistics
The following table provides a brief descriptive summary of the variables used in the regression analysis. After excluding observations with missing values in these variables, there are 7,715 observations. Among them, 1,058 observations are VCAP-backed companies whereas the number of firms in the comparison group is 6,657.
In general, VCAP-backed companies have slightly more expenses and more working capital than the comparison group. In terms of age, their average is around 1.3 years younger than the comparison group. Both groups have similar geographic distribution and industrial distribution. For example, around 45% of the companies are located in Ontario, while around 19% are located in British Columbia. The service industries whose NAICS start with 5 (IT, finance, insurance, real estate, professional and management services) account for three quarters of the observations, while manufacturing covers 10%.
| Variable | Total | VCAP-backed companies | Comparison group |
|---|---|---|---|
| ln(Total expense) | 14.171 | 14.303 | 14.150 |
| ln(Working capital) | 13.407 | 13.609 | 13.375 |
| Age | 9.702 | 8.543 | 9.886 |
| Ontario | 0.448 | 0.453 | 0.448 |
| Quebec | 0.216 | 0.204 | 0.218 |
| British Columbia | 0.187 | 0.187 | 0.187 |
| Other regions | 0.148 | 0.156 | 0.147 |
| NAICS 1 and 2 | 0.023 | 0.024 | 0.023 |
| NAICS 3 | 0.104 | 0.101 | 0.104 |
| NAICS 4 | 0.091 | 0.092 | 0.090 |
| NAICS 5 | 0.750 | 0.748 | 0.750 |
| NAICS 6 | 0.032 | 0.036 | 0.032 |
| Observations | 7,715 | 1,058 | 6,657 |
Sources: VCAP administrative data, the Business Register data, and the GIFI tax filing data.
Note: NAICS 1 & 2 includes industries in Agriculture, Forestry, Fishing and Hunting, Mining, Quarrying, and Oil and Gas Extraction, Utilities, and Construction; NAICS 3 includes Manufacturing; NAICS 4 includes Wholesale Trade, Retail Trade, Transportation and Warehousing; NAICS 5 includes Information, Finance and Insurance, Real Estate and Rental and Leasing, Professional, Scientific, and Technical Services, Management of Companies and Enterprises, Administrative and Support and Waste Management and Remediation Services; and NAICS 6 includes Educational Services.
5.3 Regression results
5.3.1 Employment
Table 2 presents fixed effect regression results for the employment model that is specified by Equation (1). The dependent variable is the natural logarithm of employment.
| Dependent variable | ln(EMPLOYMENT) |
|---|---|
| VCAP | 0.085***
(0.013) |
| VCAP_lagged | 0.064***
(0.015) |
| ln(Employment_lagged) | 0.510***
(0.024) |
| Age | -0.008
(0.007) |
| Age2 | 0.000
(0.000) |
| Region (default: Ontario) | |
| British Columbia | 0.138
(0.133) |
| Quebec | -0.144
(0.157) |
| Other regions | -0.141
(0.108) |
| Industry (default: NAICS 5) | |
| NAICS 1 and 2 | -0.320
(0.392) |
| NAICS 3 | 0.021
(0.070) |
| NAICS 4 | -0.105*
(0.059) |
| NAICS 6 | 0.199
(0.189) |
| ln(Expenses) | 0.116***
(0.017) |
| ln(Working capital) | 0.044***
(0.009) |
| Constant | -0.788***
(0.217) |
| Observations | 7,031 |
| Number of id | 1,301 |
| R2 | 0.554 |
Sources: VCAP administrative data, the Business Register data, and the GIFI tax filing data.
Notes: Robust standard errors in parentheses. *** p <0.01, ** p <0.05, * p <0.1.
The coefficient estimates in the first column indicate a significantly positive correlation between VCAP investment and employment size for a company. Given the log-linear format of the regression model, the effect of VCAP on employment can be calculated as the exponential of the coefficient estimate minus one (that is, ). In this equation, the coefficient 0.085 of VCAP indicates an 8.9% increase in employment.Footnote 14 In other words, in the year that a company receives a VCAP-backed investment, its employment is 8.9% more than a company that does not receive the investment.
The coefficient of VCAP_lagged is 0.064, capturing the second-year effect of VCAP on business performance. It implies that, in the year after a company receives VCAP-backed investment, its employment is 6.6% higher than a similar non-VCAP-backed company.Footnote 15 This finding reflects the timing of business operation—it may take a firm several months or more than a year to allocate the invested funds towards hiring.
The regression result also shows a degree of persistence in employment level over time, as indicated by the positive coefficient of the lagged employment. Given the log-log specification of this variable, its coefficient can be considered as the elasticity. For example, a 1% rise in a company's employment is associated with a 0.51% increase in the following year's employment size.
The age variables do not seem to be statistically significant in determining the level of employment. Companies located in British Columbia, Quebec, and all other regions combined do not exhibit a significant different size of employment than Ontario.
Compared with the default industrial sector categorized by the first-digit NAICS code of 5, only companies in the sector categorized by the first-digit NAICS code of 4 have fewer employees. The remaining sectors do not display statistically significant differences in size compared with the reference group.
The financial indicators show a positive correlation with the employment level. The coefficient indicates that for every 1% increase in total expenses, there is a 0.116% rise in employment. Similarly, a 1% increase in expenditure on working capital is associated with an increase in employment by 0.044%.
In addition to the level of employment, the relationship between growth and VCAP investment was also examined. The following table presents the fixed-effect regression results from the model specified by Equation (2) and the dependent variable is the average change in the logarithm of employment. Column (1) reports the coefficient estimates for the one-year growth model, and column (2) for the three-year growth model.
| Dependent variable | (1)
|
(2)
|
|---|---|---|
| VCAP | 0.044***
(0.016) |
0.008
(0.008) |
| ln(Employment) | -0.356***
(0.023) |
-0.269***
(0.012) |
| Age | -0.009
(0.007) |
0.010**
(0.005) |
| Age2 | 0.000
(0.000) |
-0.000*
(0.000) |
| Region (default: Ontario) | ||
| British Columbia | -0.008
(0.093) |
0.156
(0.102) |
| Quebec | -0.083
(0.133) |
0.003
(0.142) |
| Other regions | -0.152
(0.101) |
0.093
(0.066) |
| Industry (default: NAICS 5) | ||
| NAICS 1 and 2 | 0.090
(0.115) |
-0.006
(0.083) |
| NAICS 3 | 0.033
(0.054) |
0.018
(0.042) |
| NAICS 4 | -0.039
(0.056) |
-0.024
(0.040) |
| NAICS 6 | 0.093
(0.178) |
-0.007
(0.026) |
| ln(Expenses) | -0.004
(0.008) |
-0.001
(0.003) |
| ln(Working capital) | 0.031***
(0.008) |
0.005*
(0.003) |
| Constant | 0.806***
(0.121) |
0.650***
(0.063) |
| Observations | 6,722 | 4,745 |
| Number of id | 1,282 | 1,106 |
| R2 | 0.212 | 0.401 |
Sources: VCAP administrative data, the Business Register data, and the GIFI tax filing data.
Notes: Robust standard errors in parentheses. *** p <0.01, ** p <0.05, * p <0.1.
The first column of Table 3 shows a positive relationship between VCAP investment and employment growth. The coefficient of VCAP means that, one year after receiving the VCAP investment, a company's employment growth rate is higher than a non-recipient of VCAP investment by 4.5%.Footnote 16
There is a negative relationship between the level in the base year and the growth: the coefficient estimate of employment level in the base year, ln(Employment_lagged), is negative and statistically significant. While the coefficient estimates of age, region, industry, and total expenses are not statistically significant, working capital is positively associated with the employment growth.
The dependent variable of Column (2) is the average employment growth rate in three years. It is interesting that the coefficient of VCAP in this regression becomes statistically insignificant, indicating that the effect of VCAP investment on employment diminishes over a three-year period. On the other hand, the age variables exhibit statistical significance in this model, implying that age plays a role in determining the three-year growth of employment.
5.3.2 Revenue
Table 4 presents the fixed effect regression results from the model specified by Equation (1). The dependent variable is the natural logarithm of the total revenue. The coefficients of VCAP and VCAP_lagged are both statistically insignificant, indicating that the company hardly experiences any noticeable change in revenue either in the year it receives VCAP-backed investment or in the subsequent year.
The positive coefficient of the lagged revenue variable exhibits the consistency of revenue over time. Firm age, region, and industry are mainly statistically insignificant in explaining the revenue, except that companies located in other regions have a higher revenue than in Ontario by 82.3%.Footnote 17 Total expenses and working capital are positively correlated with the level of revenue.
| Dependent variable | ln(Revenue) |
|---|---|
| VCAP | -0.026
(0.045) |
| VCAP_lagged | -0.032
(0.040) |
| ln(Revenue_lagged) | 0.157***
(0.019) |
| Age | -0.006
(0.018) |
| Age2 | -0.000
(0.000) |
| Region (default: Ontario) | |
| British Columbia | -0.093
(0.568) |
| Quebec | 0.155
(0.284) |
| Other regions | 0.601*
(0.310) |
| Region (default: Ontario) | |
| NAICS 1 and 2 | 0.092
(0.138) |
| NAICS 3 | -0.075
(0.093) |
| NAICS 4 | -0.172
(0.139) |
| NAICS 6 | 0.831
(1.137) |
| ln(Expenses) | 0.843***
(0.037) |
| ln(Working capital) | 0.087***
(0.028) |
| Constant | -1.533***
(0.468) |
| Observations | 7,375 |
| Number of id | 1,368 |
| R2 | 0.592 |
Sources: VCAP administrative data, the Business Register data, and the GIFI tax filing data.
Notes: Robust standard errors in parentheses. *** p <0.01, ** p <0.05, * p <0.1.
The relationship between VCAP investment and the growth rate of revenue is also examined using the fixed effect regression model specified by Equation (2) and the results are reported in Table 5. In both models, the coefficient of VCAP lacks statistical significance, implying that the effect of VCAP investment on revenue growth is minimal within one year or three years.
| Dependent variable | (1)
|
(2)
|
|---|---|---|
| VCAP | 0.065
(0.053) |
-0.018
(0.026) |
| ln(Revenue) | -0.773***
(0.033) |
-0.364***
(0.024) |
| Age | 0.012
(0.027) |
0.028*
(0.015) |
| Age2 | -0.000
(0.001) |
-0.001
(0.000) |
| Region (default: Ontario) | ||
| British Columbia | -0.821*
(0.496) |
0.271**
(0.131) |
| Quebec | -0.321
(0.195) |
-0.342
(0.286) |
| Other regions | -0.060
(0.333) |
0.137
(0.128) |
| Industry (default: NAICS 5) | ||
| NAICS 1 and 2 | 0.411
(0.406) |
-0.147
(0.259) |
| NAICS 3 | -0.141
(0.278) |
-0.184
(0.158) |
| NAICS 4 | -0.171
(0.146) |
-0.027
(0.098) |
| NAICS 6 | 0.522
(0.737) |
-0.530
(0.382) |
| ln(Expenses) | 0.267***
(0.061) |
0.081***
(0.026) |
| ln(Working capital) | 0.032
(0.040) |
0.003
(0.011) |
| Constant | 6.735***
(0.639) |
3.872***
(0.174) |
| Observations | 6,937 | 4,816 |
| Number of id | 1,345 | 1,127 |
| R2 | 0.429 | 0.607 |
Sources: VCAP administrative data, the Business Register data, and the GIFI tax filing data.
Notes: Robust standard errors in parentheses. *** p <0.01, ** p <0.05, * p <0.1.
5.3.3 Research and development
One of VCAP's objectives is to help high-potential start-ups to innovate. It is therefore important to examine whether the VCAP investment has achieved this goal in improving the recipient company's innovation performance. In this study, a company's innovative activity is measured by its expenses on research and development.
Table 6 reports the regression results from the model specified by Equation (1) and the dependent variable is the logarithm of R&D expenses. There is a significant and strong correlation between VCAP investment and R&D spending. The coefficient of VCAP is 1.20, which suggests that, in the year that a company receives the VCAP-backed investment, it tends to spend 232% more than a non-recipient.Footnote 18 Likewise, the second-year effect of VCAP-backed investment on R&D spending is 106%.Footnote 19
Other results show that R&D spending is persistent over time. The coefficient of the lagged R&D spending variable indicates that a 1% rise is associated with a subsequent year increase of 0.274%. Compared with the default industrial sector (with one-digit NAICS being 5, financial and professional services), companies in the sectors whose NAICS start with 4 (trade and transportation) and 6 (education and health) tend to have higher spending on R&D. There is also a positive correlation between R&D expenditure and the company's total expenses and working capital; for example, a 1% increase in the total expense is correlated with a 0.144% increase in the spending on R&D.
| Dependent variable | ln(R&D) |
|---|---|
| VCAP | 1.200***
(0.127) |
| VCAP_lagged | 0.725***
(0.140) |
| ln(R&D_lagged) | 0.274***
(0.021) |
| Age | -0.541***
(0.047) |
| Age2 | 0.003*
(0.002) |
| Region (default: Ontario) | |
| British Columbia | 1.252
(1.287) |
| Quebec | 0.976
(1.195) |
| Other regions | -1.209
(0.935) |
| Industry (default: NAICS 5) | |
| NAICS 1 and 2 | 1.060
(0.705) |
| NAICS 3 | 0.681
(0.782) |
| NAICS 4 | 1.062**
(0.509) |
| NAICS 6 | 1.508*
(0.914) |
| ln(Expenses) | 0.144***
(0.041) |
| ln(Working capital) | 0.084**
(0.040) |
| Constant | 5.143***
(0.804) |
| Observations | 7,715 |
| Number of id | 1,399 |
| R2 | 0.149 |
Sources: VCAP administrative data, the Business Register data, and the GIFI tax filing data.
Notes: Robust standard errors in parentheses. *** p <0.01, ** p <0.05, * p <0.1.
The following table presents the effect of VCAP investment on the growth rate of R&D expenses, as specified by Equation (2). In the first column, the coefficient of VCAP (0.583) indicates that a VCAP-backed company's R&D growth is 79.1% higher than that of a non-VCAP-backed company.Footnote 20 By contrast, the effect of VCAP investment diminishes in three years, as implied by the insignificant coefficient of VCAP in the second column.
| Dependent variable | (1)
|
(2)
|
|---|---|---|
| VCAP | 0.583***
(0.137) |
-0.019
(0.062) |
| ln(R&D) | -0.655***
(0.022) |
-0.364***
(0.009) |
| Age | -0.523***
(0.049) |
-0.274***
(0.026) |
| Age2 | 0.004**
(0.002) |
0.002**
(0.001) |
| Region (default: Ontario) | ||
| British Columbia | 0.414
(0.901) |
0.444
(0.353) |
| Quebec | -1.001
(0.848) |
-0.567
(0.553) |
| Other regions | -0.637
(0.818) |
0.017
(0.412) |
| Industry (default: NAICS 5) | ||
| NAICS 1 and 2 | 0.727
(0.596) |
-0.403*
(0.242) |
| NAICS 3 | 0.703
(0.782) |
0.172
(0.323) |
| NAICS 4 | 1.497**
(0.621) |
0.590
(0.448) |
| NAICS 6 | 1.407
(0.898) |
0.226
(0.407) |
| ln(Expenses) | -0.102***
(0.036) |
-0.016
(0.015) |
| ln(Working capital) | 0.033
(0.042) |
-0.022
(0.016) |
| Constant | 8.927***
(0.694) |
4.782***
(0.305) |
| Observations | 7,220 | 5,156 |
| Number of id | 1,368 | 1,187 |
| R2 | 0.297 | 0.485 |
Sources: VCAP administrative data, the Business Register data, and the GIFI tax filing data.
Notes: Robust standard errors in parentheses. *** p <0.01, ** p <0.05, * p <0.1.
6. Conclusion
Launched in 2014, VCAP was designed as a market-oriented approach to increase the availability of financing for innovative Canadian firms. The program invested in four national funds-of-funds and four high-performing venture capital funds through the BDC. This program was expected to encourage private sector investments in early-stage risk capital and to help ensure that high-potential innovative firms have access to financing.
ISED conducted an analysis of the economic performance and innovation performance of companies backed by VCAP supported VC funds and fund-of-funds as set out in the program's Performance Measurement Framework (PMF).
This study uses the 2014–2020 administrative VCAP data from BDC and supplements it with the Business Register and tax filing data from Statistics Canada. To provide a benchmark, a comparison group of enterprises from the Business Register data is selected by a propensity score matching method.
The empirical research was conducted across various time frames: the quartile analysis covers a period of up to five years following VCAP supported investment, whereas the regression analysis focuses on the one-year and three-year effects of the investments. In the future, when newer data become available, it will be possible to expand the regression analysis to explore the impact of this program over longer periods of time.
Furthermore, by supplementing the data of this study with a list of companies that received other types of VC investment, the comparison group could be further divided into companies that may or may not have received VC funding from other sources, allowing for a more comprehensive comparison with VCAP-backed companies.
Empirical evidence reveals that the vast majority of VCAP-backed companies were located in Ontario and Quebec, followed by British Columbia. These companies tended to receive the funding at a young age (three years or younger). Half of them have 10 employees or fewer. One year after receiving the VCAP supported investment, around four-fifths of these recipients increased the size of employment. Three years after the investment, the proportion of high-growth enterprises among VCAP-backed companies, either in employment or in revenue, is more than that of the comparison group.
At each quartile of revenue, the VCAP-backed companies experienced a higher growth than the comparison group from 2016 to 2020, and ended with a higher revenue level in 2020. Regression analysis also shows that VCAP-backed companies tend to perform better than non-VCAP backed companies, though this effect decreases over time. In the year a company receives VCAP funding, its employment is 8.9% higher than the comparison group. This difference turns to 6.6% in the subsequent year.
Additionally, the investment leads to a 4.5% increase in the employment growth rate one year after the VCAP supported investment, but this effect diminishes in three years. There is no statistically significant correlation between receiving VCAP supported investment and either the revenue level or its growth rate over the three-year period.
Receiving VCAP supported investment is associated with better innovation performance, as the recipient company's spending on R&D is 232% higher than a non-VCAP-backed company in the current year and 106% higher in the year that follows.
Moreover, VCAP-backed investment is associated with an increase in the recipients' growth of R&D spending by 79.1% in the year following the investment but this correlation becomes statistically insignificant in three years.
Overall, this analysis supports that VCAP has a statistically positive correlation with the economic performance and innovation performance of companies supported by VCAP-backed VC funds and fund-of-funds in terms of their employment growth and R&D spending.
As per the program's Performance Measurement Framework, these positive performance findings support the program's expected result of increasing the number of successful Canadian companies by encouraging private sector investments in early-stage risk capital and helping to ensure that high-potential innovative firms have access to financing.
References
Clayton, R., Sadeghi, A., Spletzer, J. R., and Talan, D. M. (2013) "High-employment-growth firms: defining and counting them." Monthly Labor Review, June 2013, U.S. Bureau of Labor Statistics.
Eurostat–OECD (2007) "Manual on Business Demography Statistics," Paris: OECD.
Kelly, R., Kim, H. (2018) "Venture capital as a catalyst for commercialization and high growth," The Journal of Technology Transfer, 43, 1466–1492.
Tu, J., Clarke, W., and Dolan, S. (2022) "Untangling the seed and early-stage funding environment in Canada," Innovation, Science and Economic Development Canada-Small Business Branch.