
Issue 3
November 2025
Preface
Broadcasting Procedures and Rules BPR-10, issue 3, Application Procedures and Rules for Digital Television (DTV) Broadcasting Undertakings, outlines the application procedures for broadcasting undertakings seeking to acquire a broadcasting certificate to operate a digital television station, regular or low power. The document also specifies technical and operational requirements.
Digital television stations operate in the Low VHF (54-72 and 76-88 MHz), High VHF (174-216 MHz) and UHF (470-608 MHz) frequency bands in accordance with the Advanced Television Systems Committee's (ATSC) first-generation standard, ATSC 1.0.
ATSC third-generation standard, ATSC 3.0, operation is outside the scope of this document. ATSC 3.0 experimental operation is permitted in accordance with the requirements set in Broadcasting Circular BC-22, issue 1, Requirements for the Experimental Operation of ATSC 3.0 in TV Bands.
This issue replaces BPR-10, issue 2. It also supersedes BPR-11, Broadcasting Television Application Procedures During the 600 MHz Transition. BPR-10 should be applied in conjunction with BPR-1, General Rules.
The following are the main changes:
- integration of key parts from the rescinded BPR-11, as indicated in the subsequent paragraph.
- transition to online applications by default and email applications only in special circumstances.
- other updates, including editorial changes and clarifications, as appropriate.
BPR-10 was revised to incorporate key elements from the 600 MHz Transition. As such, the following changes were made in the document:
- updated definitions for primary and secondary assignments.
- added new definitions (baseline interference-free service population and baseline parameters).
- clarified order of protection for primary and secondary assignments.
- updated terminology for the population service loss equation.
- added a new annex with planning parameters and technical assumptions.
Issued under the authority of the Minister of Industry
Wen Kwan
Director General
Engineering, Planning and Standards Branch
Marc-André Rochon
Director General
Spectrum Management Operations Branch
1. International agreements
Following the repurposing of the 600 MHz frequency band in Canada, a new Digital Television (DTV) Allotment Plan was developed in April 2017, in coordination with the United States (US). The DTV Allotment Plan provided an allotment for each existing Canadian regular power and low power television station in operation on August 3, 2015. Canadian allotments within 360 km of the border area were coordinated with the US in an exchange of letters dated from September 2017.
Notification of proposed revisions to the DTV Allotment Plan shall be made to the other Administration in accordance with the applicable provisions in the Terrestrial Broadcasting Agreements and Arrangements (TBAAs).
Assignments made within 360 km of the border shall comply with the DTV Allotment Plan, as revised, and shall be notified in accordance with the applicable provisions of the TBAAs. Assignments located more than 360 km from the nearest point on the Canada and US border will normally not require coordination and need not be notified except in cases of operating parameters where the possibility exists that interference could be caused to stations of the other Administration.
2. Definitions and general requirements
This section contains definitions and general requirements related to digital television broadcasting.
2.1 Definitions
This section contains definitions for terms and acronyms related to digital television broadcasting.
- Allocation
- An entry in the Canadian Table of Frequency Allocations of a given frequency band for the purpose of its use by one or more terrestrial or space radiocommunication services or the radio astronomy service under specified conditions. This term also applies to the frequency band concerned.
- Allotment
- The entry of a designated frequency channel in an agreed plan, for use by one or more administrations for a terrestrial or space radiocommunication service in one or more identified countries or geographical areas and under specified conditions.
- Antenna beam tilt (electrical and mechanical)
- The antenna beam tilt is the inclination in degrees of the azimuth radiation pattern of the antenna that causes the maximum radiation to occur at an angle below the horizontal plane. The beam tilt may be achieved by electrical or mechanical means.
- Assignment
- The authorized use of an allotment by a television station.
- Baseline interference-free service population
- The population within the noise-limited bounding contour predicted to receive service. It excludes the population of cells where the desired signal is blocked by terrain obstructions and cells with existing interference from other allotments.
- Baseline parameters
- Allotment technical parameters as specified at the release of the DTV Allotment Plan or at the addition of a new allotment.
- DTV Allotment Plan
- The DTV Allotment Plan contains the list of Canadian allotments for digital television broadcasting.
- Note: Following the 2017 600 MHz repacking, a new DTV Allotment Plan was established, in coordination with the US. Subsequently assignments that may differ from the DTV Allotment Plan (modifications, additions, or deletions of allotments) are reflected in the Broadcasting Database section of ISED's Download Spectrum Management System Data webpage. References to the DTV Allotment Plan throughout this document include any such modifications as captured in the Broadcasting Database.
- DTV urban contour
- The DTV urban contour (DUC) of a DTV allotment or DTV assignment delimits a geographic area smaller than the protected area of a station. The contour is determined based on station parameters and F(50,90) propagation curves associated to field strength limits specified in the table 2 of section 2.2.2.
- Note: The methodology to determine the DUC is detailed in section E2 of annex E.
- Effective height above average terrain
- The antenna effective height above average terrain (EHAAT) is the average of the antenna heights above average terrain (HAATs) for 72 radials. The HAAT is the height of the centre of radiation of the antenna above the average elevation of the terrain, based on Canadian Digital Elevation Data (CDED) or equivalent, as measured from 3 to 16 km from the antenna for each radial (0 to 5 km for low-power operations).
- Effective radiated power
- The effective radiated power (ERP) is the product of the transmitter output power, the transmission line (and combiner) efficiency and the power gain of the antenna relative to a half-wave dipole. The maximum ERP is calculated using the maximum value of radiation from the antenna in the plane of maximum radiation (i.e. beam tilt) and in the direction of maximum radiation for directional antennas.
- Low-power (DTV) station
- A digital television station operating in accordance with ERP and EHAAT limits associated with low-power stations (refer to table 4), and complying with the application process of section 4.
- Noise-limited bounding contour
- The noise-limited bounding contour (NLBC) of a DTV allotment or DTV assignment delimits the protected area of a station with respect to interference analyses. The contour is determined based on station parameters and F(50,90) propagation curves associated to field strength limits provided in the table 2 of section 2.2.2.
- Note: The methodology to determine the NLBC is detailed in section E3 of annex E.
- Primary assignment
- A digital television station authorized for operation on a regular or low power allotment in accordance with the DTV Allotment Plan. For low-power digital television (LPDTV), the term is only applicable to a station operating on an allotment specified at the release of the DTV Allotment Plan and, if applicable, according to its scheduled transition date. A primary assignment receives protection from other allotments, as well as from other primary and secondary assignments. In this document, all references to assignments refer to primary assignments unless otherwise noted.
- Protected area
- The protected area of a DTV allotment or DTV assignment is the geographic area inside the noise-limited bounding contour of a station for which protection is sought during interference analyses. The area is determined based on station parameters, F(50,90) propagation curves associated to the NLBC field strength limits (refer to table 2 of section 2.2.2) and a terrain-sensitive propagation model (Longley-Rice). It is limited to a distance of 100 km for regular-power stations and 20 km for low-power stations.
- Note: The methodology to determine the protected area is detailed in section E4 of annex E.
- Regular-power (DTV) station
- A digital television station operating in accordance with ERP and EHAAT limits associated with regular-power stations (refer to table 3), and complying with the application process of section 3.
- Secondary assignment
- An analog or digital television station that is authorized to operate, but not included in the DTV Allotment Plan or operating outside the allotted parameters. A secondary assignment operates on the basis of not causing interference to, nor receiving protection from, allotments or primary assignments. The order of protection for secondary assignments is described in the section 2.2.4.
- Television channels
- All channels in the VHF and UHF bands authorized by ISED for the television broadcasting service. More details are provided in the table 1 of section 2.2.1.
- Vacant Allotment
- A standalone allotment, based on the DTV Allotment Plan, that can be claimed on a first-come, first‑served basis.
2.2. General requirements
This section contains general requirements related to digital television broadcasting.
2.2.1 Frequency and channel
Frequencies allocated to the television broadcasting service are designated by channel numbers, with each channel occupying a 6 MHz bandwidth. Table 1 below provides the frequency bands, frequency ranges and channels available for digital television broadcasting.
| Frequency band | Frequency range (MHz) | Channels |
|---|---|---|
| Low VHF | 54-72 | 2 to 4 |
| 76-88 | 5 and 6 | |
| High VHF | 174-216 | 7 to 13 |
| UHF | 470-608 | 14 to 36* |
Note: TV channel 36 (602-608 MHz) is designated as a guard band for the protection of existing users in the UHF band.
2.2.2 DUC and NLBC field strength limits
Table 2 below provides the DUC and NLBC field strength limits for regular and low power stations.
| Channels | DUC limit (dBµV/m), regular power | NLBC limit (dBµV/m), low power | NLBC limit (dBµV/m), regular power |
|---|---|---|---|
| 2-6 | 59 | 43 | 28 |
| 7-13 | 60 | 48 | 36 |
| 14-36 | 61−20log(615/Fm) | 51−20log(615/Fm) | 41−20log(615/Fm) |
Note: Fm represents the channel mid-frequency in MHz.
2.2.3 Maximum ERP and EHAAT
This section provides the maximum ERP and EHAAT values for regular and low power stations. Refer to tables 3 and 4 below.
| Channel | ERP (W) | EHAAT (m) |
|---|---|---|
| 2-6 | 30 000 | 300 |
| 7-13 | 60 000 | 300 |
| 14-36 | 2 000 000 | 300 |
| Channel | ERP (W) | EHAAT (m) |
|---|---|---|
| 2-6 | 370 | 30 |
| 7-13 | 600 | 30 |
| 14-36 | 2 600 | 30 |
Note:
The maximum permissible ERP shall not be exceeded in either the horizontal or tilt planes.
Where the EHAAT exceeds the values shown in tables 3 and 4, the ERP shall be reduced to provide equivalence with the maximum or other permissible parameters. Equivalence requires that the distance to the NLBC field strength limit, calculated using the maximum ERP, EHAAT and the F(50, 90) propagation curves in annex F, remain the same.
Although equivalence permits the EHAAT to exceed the maximum value when accompanied by a reduction in ERP, the reverse is not permitted. Specifically, under no circumstances may the maximum ERP be exceeded.
2.2.4 Order of protection for primary and secondary assignments
Primary assignments will all have the same protection status.
Secondary assignments will operate on the basis of not causing interference to, nor receiving protection from, existing or future primary assignments.
An order of protection will be preserved within secondary assignments as described in the hierarchy below:
- digital regular power
- analog regular power
- digital low power
- analog low power
2.2.5 Key assumptions and parameters for contour generation and interference analyses
Applicants shall use the planning parameters and technical assumptions specified in annex C to determine EHAAT and bounding contours, and to perform interference analyses. Refer to annex E for details on determining EHAAT and bounding contours, and annexes G (DTV-DTV) and H (DTV-NTSC) for details on interference analyses.
3. Applications and rules for regular-power digital television stations operating as primary assignments
This section outlines ISED's requirements for applying to a regular-power digital television station operating on a primary assignment.
3.1 Application requirements
An application to ISED for a broadcasting certificate shall be accompanied by an application to the Canadian Radio-television and Telecommunications Commission (CRTC) for a broadcasting licence, unless the application is exempt from the CRTC licensing requirements. Application requirements for a broadcasting licence can be obtained from the CRTC. ISED must receive a confirmation that an application for a broadcasting licence has been submitted to the CRTC, or that a licence is not required, within 30 days of receiving the application for a broadcasting certificate, otherwise the certificate application will be returned to the applicant.
Although the CRTC has established criteria to exempt certain categories of DTV broadcasting from its licensing requirements, ISED maintains its requirements for the submission of broadcasting certificate applications because of spectrum management needs.
3.1.1 Online application requirements
The applicant is strongly encouraged to submit an application online through ISED's Spectrum Management System, unless changes are required to a pending application or there are other special circumstances. The online system simplifies application submissions for clients since it allows for the retrieval of existing station data from the ISED database for review and modification. The online validation also minimizes delays as it reduces the possibility for errors or omissions.
The following documentation shall be attached to the application:
- an engineering brief (in PDF format) as per section 3.2, including any required maps prepared in accordance with section 3.2.9, with the exception of electronic service contours unless requested by ISED; and
- a text file containing azimuth and elevation antenna pattern data, in accordance with annex E of BPR‑1.
3.1.2 Email application requirements in special circumstances
When a situation prevents an application from being submitted online, the applicant may submit the application by email to broadcasting-radiodiffusion@ised-isde.gc.ca.
In addition to the documentation required for online submissions, the following documentation shall be attached to the application:
- form ISED-ISDE3050, Application for a Broadcasting Certificate for a Regular Power Undertaking (in PDF format);
- form ISED-ISDE2430, Radiocommunication and Broadcasting Antenna Systems Attestation (in PDF format); and
- a copy of the Letter of Intent to the land-use authority as described in section 2 of BPR‑1, if applicable.
It is the applicant's responsibility to ensure that all electronic documents submitted have the necessary signatures.
ISED reserves the right to request a signed attestation to verify the authenticity of an application and may hold the processing of the application until a satisfactory attestation has been received.
3.1.3 Other requirements
All proposed antenna structures, whether new or modified, low or regular power, must comply with the requirements of Client Procedures Circular CPC-2-0-03, Radiocommunication and Broadcasting Antenna Systems, and section 2 of BPR-1.
In addition to meeting the requirements regarding site sharing, land-use consultation and public consultation, applicants must also fulfill other important obligations, including:
- compliance with Health Canada's Safety Code 6 guidelines for the protection of the general public;
- compliance with radio frequency (RF) immunity criteria;
- notification of nearby broadcasting stations;
- environmental considerations; and
- Transport Canada / NAV CANADA aeronautical safety responsibilities.
3.2 Engineering brief requirements
The engineering brief should include the components described below in sections 3.2.1 to 3.2.9 in the order presented to facilitate processing by ISED. The International System of Units (SI) shall be used throughout the engineering brief.
3.2.1 Title page
The title page shall include the submission title, type of broadcasting undertaking proposed, applicant's name and address, broadcasting consultant's name (if applicable), as well as the location of the proposed broadcasting undertaking and submission date. The project or reference number shall also be included.
3.2.2 Table of contents
The table of contents must present the sections of the brief with their respective page numbers.
3.2.3 Summary sheet
The summary sheet shall be prepared as per annex A for email submissions. The summary sheet is optional for online applications.
3.2.4 Main body
The main body of the engineering brief should include the following sections.
Introduction
The introduction must include a general statement of the purpose of the brief in relation to the application, including the primary centre(s) to be served within the digital urban contour and the noise-limited bounding contour.
Discussion
A discussion should be included regarding the design considerations to accomplish the applicant's objectives, including the site location, choice of channel and operating parameters.
Assumptions and sources of information
All assumptions and sources of information used to compile the engineering brief must be listed and explained.
Interference analysis
If necessary, include an interference analysis in support of the transmitting channel(s) and the selected parameters (refer to section 3.6).
Transmitter
Specify the make, type, model number and output power (rated and operating) of the transmitter.
Emissions shall meet the emission mask shown in figure D1 of annex D.
In some circumstances, ISED may require the use of an emission mask with more stringent characteristics (out-of-band emissions) to protect adjacent-band services.
Description of antenna system
The following details are required:
- Antenna: manufacturer, type, model number, number of sections (if applicable) and power gain (relative to a half-wave dipole). The elevation radiation pattern is required in a graphical representation as described in section 3.2.6, and in a tabular form as described in section 3.2.8. For directional antennas, the azimuth radiation pattern is required in a graphical representation as described in section 3.2.7, and in a tabular form as described in section 3.2.8. The largest dimension of the antenna shall be provided.
- Transmission line: manufacturer, type, length (in metres) and efficiency.
- Combiner: manufacturer and operational characteristics.
- Polarization: horizontal, circular or elliptical polarization as proposed. Horizontal polarization is normally used.
Auxiliary transmitting systems
Compliant auxiliary transmitting systems (section 6 of BPR-1) shall be listed, if any.
Bounding contour table
Tabulated bounding contour predictions shall be provided according to the guidelines in annex E.
Special analysis and undertakings relative to interference to other broadcasting services
Analyses shall be submitted along with appropriate undertakings made in regard to all potential interference situations with other broadcasting stations resulting from the operation of the proposed television facility.
The following are some examples of interference situations with other broadcasting services that shall be explored for each proposal:
- distortion of AM radiation patterns by the new television tower located in the vicinity of an AM antenna array;
- isolation of AM, FM and television transmissions, where such services are co-located;
- interference to FM channels 201 to 220 from channel 6:
- for co-located channel 6 and FM stations, protection of the FM can be achieved when the TV/FM power ratio is below 30 dB for all FM channels except FM channel 201, for which the required ratio is 9 dB.
- for television stations located outside the protected FM service area (0.5 mV/m contour), interference-free FM operations will be provided with 20 km (62 km for FM channel 201) separation between the television transmitter and the FM protected contour.
- if the proposed TV assignment is located within the protected FM service area then a D/U analysis using the above ratios should be submitted.
- Interference to LPTV and LPDTV assignments: Although these are unprotected assignments, they should be notified of potential interference to their service. Such notification shall be made in writing to the affected broadcaster, with a copy forwarded to ISED (refer to section 3.6.6).
RF exposure and strong adjacent channel TV signal interference issues
The applicant shall submit analyses regarding RF exposure and strong adjacent channel TV signal interference issues. Refer to CPC-2-0-03 and sections 3.1.3 and 3.7 of this document for the requirements regarding these issues.
Off-air reception and microwave links
When a television rebroadcasting station receives a feed from an existing facility using off-air reception (or a combination of off-air reception and microwave links), the engineering brief should specify the type of feed and give a description of the system.
3.2.5 Antenna location and diagrams
The location of all structures and antenna sites that are of relevance to the analyses carried out for the purpose of the application shall be provided in the engineering brief.
The engineering brief must also include an elevation diagram of the structure and transmitting antenna as per annex B and a description of the transmitting system's major units, including a block diagram.
For rooftop installations, the engineering brief must include an elevation diagram of the building, indicating the height of the rooftop above ground.
3.2.6 Elevation radiation pattern
The elevation radiation pattern of the antenna (relative field versus elevation angles) shall be plotted in rectangular coordinates from 90° above (positive values) to 90° below (negative values) the horizontal plane.
3.2.7 Azimuth radiation pattern
If a directional antenna is employed, a polar plot of the azimuth radiation pattern shall be provided. This plot must clearly indicate true north and the root mean square (r.m.s.) field. The ratio of maximum to minimum fields of directional antenna systems shall not be greater than 20 dB except where signal reflections due to local terrain will present a reception problem or where other circumstances exist, such as a large body of water. When a directional pattern is proposed, the brief should contain a letter from the manufacturer stating that the proposed pattern can be achieved.
Note: Title blocks shall be placed on radiation patterns for directional antenna systems since, in some instances, for areas along the Canada-US border, it may be necessary to submit this material separately when notifying the new assignments to the US Federal Communications Commission (FCC). The title block shall include the identification of the undertaking, frequency, maximum ERP and date.
3.2.8 Pattern data tables
Elevation and azimuth pattern data (if applicable) must also be provided in tabular format in relative
field (%).
Elevation pattern data shall include a maximum of 181 points. These points shall be distributed appropriately to reflect the shape of the actual pattern from the manufacturer as closely as possible, especially along each peak and null covering the full range from -90 to +90 degrees.
Azimuth pattern data shall be provided at 1-degree intervals starting from true north.
A text file containing the pattern data is required in the format defined in annex E of BPR-1.
3.2.9 Maps
A map with a scale of 1:50 000 shall be provided and include the proposed antenna site and its geographical coordinates (latitude and longitude).
A map showing the noise-limited bounding contour and the digital urban contour shall also be provided.
Maps may be provided indicating the protected areas and interference for the proposed assignment and any other affected assignments or allotments (refer to section 3.6.2).
When a change to the facility is proposed, the applicant shall provide maps indicating comparative contours.
The latitude-longitude geographical projection and the datum WGS84 (in degrees-minutes-seconds format with up to 2 decimals for the seconds) shall be used.
Further details concerning the preparation of maps for engineering briefs are provided in section 3 of BPR-1.
3.3 Technical operation of broadcast transmitter plants
A description of the technical equipment in compliance with the minimum requirements specified in section 5.1 of BPR-1 shall be submitted prior to on-air tests for the approved facility.
If unattended operation is proposed, a statement that the unattended operation meets the minimum requirements of section 5.1 of BPR-1 is required.
3.4 Application requirements for non-program-related data
Television undertakings planning to transmit non program-related data using the excess capacity of the digital channel shall submit a description of the data to ISED. Such applications are authorized under the Radiocommunication Act and the Radiocommunication Regulations, and are subject to the applicable authorization fee and to any requirements under the Telecommunications Act. If the data service is intended for the reception of the general public, CRTC approval may be required.
The holder of a broadcasting certificate for a television undertaking is not required to notify ISED of the addition of broadcasting program services using the excess capacity of the digital channel (such as multiplexing); however such services may require CRTC approval.
3.5 On-air testing procedure
The procedure outlined in section 1.4 of BPR-1 shall be followed.
3.6 Interference analyses and notifications
An allotment or assignment should be designed to minimize interference to nearby allotments or assignments, but there are situations where interference may occur as a result of the choice of parameters and location. Annex G describes the criteria for determining which nearby digital television assignments or allotments may cause interference to, or receive interference from, the proposed assignment or allotment. Annex H describes the criteria for determining which nearby NTSC assignments may cause interference to, or receive interference from, the proposed assignment or allotment.
To avoid mutual interference, the transmitting sites of stations on the first-adjacent channel should be co-located, near (within 1 km) or outside the noise-limited bounding contour of the station on the first‑adjacent channel.
It is the responsibility of the applicant to assess interference to the proposed assignment's protected area.
3.6.1 Criteria to determine when short-spaced analyses are required
Short-spaced analyses regarding primary assignments and allotments, as described in section G2 of annex G, are required only in specific situations. Assignments or allotments whose distance from the protected station is less than the value given in table G1 of annex G are considered as potential sources of interference. The analyses are used to identify all affected primary assignments and allotments and inform them about the potential impact, using the notification procedure outlined in section 3.6.5. Analyses are not required for a proposed allotment which complies with the DTV Allotment Plan, and satisfies the spacing requirements defined in the present document. Analyses are required for a proposed assignment or allotment based on a proposed channel that is not in the DTV Allotment Plan (i.e. a drop-in channel), and does not satisfy the spacing requirements defined in the present document.
Short-spaced analyses will be required regarding secondary assignments, as per section G2 of annex G (DTV-DTV) or section H2.4 of annex H (DTV-NTSC), to identify all affected secondary assignments and inform them about the potential impact, using the notification procedure outlined in section 3.6.6.
3.6.2 Interference analysis requirements
Calculations shall be provided to demonstrate that any population service loss from the proposal to affected assignments and allotments meets the interference ceilings in section 3.6.3. The percentage of population service loss shall be provided for each affected allotment and assignment.
Maps illustrating the extent of any interference shall be provided and additional calculation details shall be made available upon request.
A full interference analysis based on the key assumptions and parameters from section 2.2.5 must be provided for a proposed allotment or assignment.
3.6.3 Interference ceilings
The interference ceiling (in percentage) is the maximum population service loss that a proposal can cause to an existing station. Population service loss shall be calculated as described in section G7 of annex G for existing DTV stations and section H2.5 of annex H for existing NTSC stations. Depending on the proposal, the following interference ceiling conditions apply:
- a proposal for a new primary assignment shall not cause greater than 0.5% population service loss to a previously approved primary assignment or allotment than the proposal's corresponding baseline parameters.
- a proposal for a modified primary assignment or allotment is allowed to cause up to 0.5% population service loss to a previously approved primary assignment or allotment than the proposal's corresponding baseline parameters.
3.6.4 Modifications to the DTV Allotment Plan
When an application for a television broadcasting undertaking requires modifications to existing assignments or allotments in the DTV Allotment Plan, the applicant may consult with ISED regarding these modifications prior to the formal filing of the application.
For applications requiring coordination with the US, ISED will follow the applicable notification provisions specified in the TBAAs. In applying such notification provisions, ISED will consider the DTV Allotment Plan with allotments and baseline parameters, as well as the spacing requirements, planning parameters and technical assumptions in the present document.
Studies in support of the proposed modifications shall show that the coverage objective of the proposal cannot be achieved by less drastic measures.
The following types of proposed modifications are possible, either separately or in combination:
- Changing the channel of an allotment or assignment – the certificate holder's or the assignee's agreement, as appropriate, shall be obtained (refer to section 3.6.5);
- Modifying the technical parameters or limiting an allotment or assignment – the certificate holder's agreement shall be obtained (refer to section 3.6.5);
- Moving an allotment to another area and replacing the shifted allotment with a suitable channel; and
- Deleting an allotment.
A proposal to change the channel or the technical parameters of an allotment in the DTV Allotment Plan, shall be supported by a technical submission demonstrating that the change would provide improved channel utilization. The proposed change shall conform to the interference ceilings contained in section 3.6.3. DTV-DTV interference calculations should be performed following the methodology in annex G. DTV-NTSC interference calculations should be performed following the methodology in annex H.
It is noted that some of the types of proposed modifications mentioned above may have a positive impact in one area, but a negative impact in another area. If ISED accepts the changes, it will report to the CRTC on the technical aspects of the changes and their impact, provided that the proposal is based on a complete application. These changes will be considered technically acceptable pending a decision by the CRTC. Any changes to the DTV Allotment Plan that may be required as the result of such applications will not be made until ISED declares them technically acceptable and the CRTC approves the application.
3.6.5 Notification of primary assignments
The applicant shall send a copy of the engineering brief with a covering letter or email to the broadcasting certificate holder of all short-spaced primary assignments and allotments as identified using the methodology of annex G, preferably on the date of filing the application or immediately after the CRTC has issued a Notice of Public Hearing.
The applicant should send the letter and the copy of the brief early enough so that the affected certificate holder can reply, at the latest, 20 days before the start of the public hearing. Should the 30-day response time fall beyond this deadline, ISED will not send technical comments to the CRTC. It should be noted that, in this case, the applicant is taking the risk of having the application withdrawn and assumes the responsibility for it.
A copy of this letter and confirmation of receipt by the affected broadcasting certificate holder, as proof of delivery, shall be sent to ISED. The letter shall advise the certificate holder of the situation and of interference or proposed changes where applicable, and shall emphasize that any representations that the certificate holder may wish to make to ISED shall be submitted to ISED with a copy to the applicant, no later than 30 days after receipt of the engineering brief.
If the affected certificate holder offers an objection, ISED may reject and return the application. ISED reserves the right to make an independent decision concerning the disposition of the application. If no reply is received within the specified period, it will be assumed that there is no objection.
The affected certificate holder shall use the criteria contained herein, together with established engineering practices, to assess the impact of the proposal. ISED will review the certificate holder's response from a technical point of view and will reserve the right to make an independent decision concerning the disposition of the application.
Applicants proposing to modify the technical parameters or change the channel of an assignment that results in additional capital and operating cost for existing assignments will be expected to cover these expenses.
3.6.6 Other notifications
The applicant shall send a copy of the engineering brief with a covering letter or email to the broadcasting certificate holder of all short-spaced secondary assignments as identified using the methodologies of annexes G and H, preferably on the date of filing the application or immediately after the CRTC has issued a Notice of Public Hearing.
A copy of this letter and confirmation of receipt by the affected broadcasting certificate holder, as proof of delivery, shall be sent to ISED. The letter shall advise the certificate holder of the situation, the possibility of interference and the need for remedial action should the application become operational.
3.6.7 Incompatibilities
In all of the cases described in section 3.6.1, problems can arise when changes to the DTV Allotment Plan proposed by one applicant are not compatible with changes proposed by another applicant. It should be noted that incompatibilities can occur even when the proposed services are geographically well separated.
ISED encourages applicants to cooperate in the search for an early solution to problems of incompatibility. In this regard, ISED will, without divulging the details of the proposed changes, make any incompatibility known to each of the applicants involved, urging resolution prior to consideration of the applications by the CRTC.
3.6.8 Allotment planning
ISED may make changes to the DTV Allotment Plan independent of any application received. In its role as spectrum manager, it will also make independent decisions based on technical considerations.
3.7 Assessment and control of maximum field strength of TV broadcasting assignments
Service requirements and constraints related to the siting of television broadcasting assignments may result in high signal strength levels in populated areas. Under these conditions, TV receivers are susceptible to interference from strong adjacent channel TV signals. Broadcast receivers are also susceptible to immunity-type interference. Non-radio frequency equipment (radio-sensitive equipment) may also be affected by TV emissions.
To avoid or minimize such problems, applicants are encouraged to locate their transmitters away from populated areas. Where this is unavoidable, it is necessary to assess the potential for interference.
3.7.1 Purpose
The purpose of this section is to:
- identify the analysis required from applicants in determining interference potential;
- define the responsibilities of broadcasters in response to interference complaints; and
- identify non-valid complaints of interference.
The requirements of this section apply to all applications for the issue or amendment of broadcasting certificates for television broadcasting assignments.
3.7.2 Requirements for interference analyses and population estimates
In addition to the requirements in section 3.2 pertaining to the engineering brief, interference analyses are required, as per sections 3.7.3 to 3.7.5 below. In specific cases, ISED may accept a common assessment for co-located assignments, multiplexed or otherwise.
3.7.3 Strong adjacent channel TV signal interference
Strong adjacent channel TV signal interference can take place in the vicinity of a television assignment and the severity of the interference potential depends on the broadcasting radio environment. The proposed station's 120 dBµV/m contour (channels 2-6 inclusive) or the 115 dBµV/m contour (channels 7-36 inclusive) is to be plotted on an appropriately-scaled map and submitted to ISED. An estimate of the population within this contour shall also be provided. The calculations should be based on the methodology defined in section 3.7.5, for high field strengths.
Every attempt shall be made to keep the population within the above area to a minimum. ISED reserves the right to request changes to the antenna site, to the antenna height, to the antenna itself, or to the radiated power to reduce the population within this high field strength area.
3.7.4 Immunity-type interference
Broadcast receivers and their associated equipment, as well as non-radio equipment (radio-sensitive devices), are expected to operate properly within field strengths lower than those indicated in Electromagnetic Compatibility Advisory Bulletin 2 EMCAB-2, Criteria for Resolution of Immunity Complaints Involving Fundamental Emissions of Radiocommunications Transmitters. ISED uses EMCAB-2 to make determinations on interference or immunity cases.
3.7.5 Method for calculating high field strength contours
The antenna radiation patterns, elevation and azimuth (if the antenna is directional), are normally supplied by the antenna manufacturer. In predicting high field strength contours, the ERP should be based on the appropriate antenna elevation radiation pattern for the azimuthal direction concerned.
For distances less than 1.5 km from the transmitting site, the field strength should be determined from the following free-space formula:
F = 137 + 10log(ERP) - 20log(d)
where:
- F is the field strength in dBµV/m (decibels above one microvolt per metre)
- ERP is the effective radiated power in watts at the pertinent depression angle; and
- d is the slant distance (in metres) between the centre of radiation of the antenna and the receiving location
For distances between 1.5 km and 4 km, the field strength should be determined from the F(50,90) curves using the height of the antenna radiation centre with respect to the receiving location under consideration.
For distances beyond 4 km, the field strength should be determined from the F(50,90) curves using the pertinent HAAT.
When using F(50,90) curves, the antenna height and the distance from the tower should be used to determine the depression angle. The ERP for that direction shall be determined by using the depression angle and the elevation pattern information of the antenna. For directional antennas (azimuth pattern), the power shall also be adjusted according to the azimuth selected.
Close-in field strength prediction may involve nulls in the elevation radiation pattern which shall be taken into consideration. The distances (di) along the ground, where the field strength is minimal due to an elevation pattern null, can be calculated by the following relationship:
$$d_i = \frac{H}{tan(\theta_i + A)}$$
where:
- A and θi: the beam tilt angle and the angles corresponding to the different nulls in the elevation radiation pattern respectively (both in degrees)
- H: the height (in metres) of the antenna's radiation centre
- di: the distances (in metres) along the ground
For values of θi + A ≤ 10°:
$$d_i = 57.3 \frac{H}{\theta_i + A}$$
3.7.6 Resolving issues
This section explains the broadcasters' responsibilities when either strong adjacent channel TV signal- or immunity-type interference occurs.
- In the case of strong adjacent channel TV signal interference (from the 2nd, 3rd, or 4th adjacent channel) relative to an assignment:
- the broadcasters will be responsible for remedying valid complaints of interference within the 120 dBµV/m contour (channels 2-6 inclusive) or the 115 dBµV/m contour (channels 7-36 inclusive) of the interfering DTV assignment on an adjacent channel (refer to section 3.7.7 for a list of complaints judged not valid by ISED);
- keep the appropriate ISED district office fully informed of all complaints received and actions taken.
- In the case of immunity-type interference:
- the broadcasters will be responsible for remedying valid complaints.
- the guidelines on resolving immunity issues related to radio-sensitive equipment are outlined in CPC-3-14-01, Determinations of Harmful Interference with Respect to Radio-Sensitive Equipment. CPC-3-14-01 can also be used as a guide for resolving immunity-related interference to broadcast receivers and associated equipment.
3.7.7 Complaints judged not valid by ISED
The following are the types of complaints judged not valid by ISED and for which broadcasters are not responsible for remedial action:
- where the complaint is attributed to the use of a malfunctioning or mistuned receiver or an improperly installed or defective antenna system;
- where the complaint is attributed to the desired signal being received outside the area where service is normally expected;
- where the complaint is attributed to the desired signal not being favourably received because of adverse local propagation conditions or building penetration losses;
- where the complaint involves the reception of signals originating from outside of Canada;
- where the complaint involves a high gain receiving antenna and/or an antenna booster amplifier intended for reception of distant assignments which, as a consequence, overloads the receiver or creates intermodulation in the amplifier output;
- where the complaint is attributed to the reception of a TV assignment which, under normal allotment criteria, is not fully protected from interference, or where the complaint originates from a planned interference zone;
- where the complaint is attributed to immunity-type interference to broadcast receivers and associated equipment located in an area where the measured field strength does not exceed the 125 dBμV/m limit;
- where the complaint is attributed to immunity-type interference to radio-sensitive equipment that is located in an area where the measured field strength does not exceed the 130 dBμV/m limit;
- any other complaint that, in the judgment of ISED, is considered not valid.
3.8 Transport Stream Identifier (TSID)
Transport stream identifier (TSID) is an integral part of the ATSC standard on program and system information protocol (PSIP), A/65. The TSID identifies an individual broadcast assignment and facilitates the tuning of DTV receivers.
TSIDs for use in Canada are assigned by ISED. An up-to-date list of TSIDs is available on the Broadcasting Services webpage. Applicants can refer to that list to find their assigned TSID prior to starting regular broadcast emissions.
4. Applications and rules for low-power digital television stations operating as secondary assignments
This section outlines ISED's requirements for applying to a low-power digital television (LPDTV) station operating on a secondary assignment.
4.1 Preamble
LPDTV stations, other than those who acquired a primary status during the 600 MHz transition, are considered secondary assignments. In other words, these assignments are established on an unprotected basis.
If an assignment established under this section causes unacceptable interference to primary assignments, whether those assignments were established before or after the LPDTV station, remedial measures must be taken. Such measures may include ceasing operation if no suitable channel is available.
An LPDTV station is not entitled to protection from interference from primary assignments. An LPDTV station is entitled to protection from other LPDTV stations that are established at a later date.
Where a new primary assignment, or one that has changed parameters, causes interference to an LPDTV station but does not receive any, the latter may either accept the interference or make application to change its operation to alleviate the interference.
4.2 Application requirements
An application to ISED for a broadcasting certificate shall be accompanied by an application to the Canadian Radio-television and Telecommunications Commission (CRTC) for a broadcasting licence, unless the application is exempt from the CRTC licensing requirements. Application requirements for a broadcasting licence can be obtained from the CRTC. ISED must receive a confirmation that an application for a broadcasting licence has been submitted to the CRTC, or that a licence is not required, within 30 days of receiving the application for a broadcasting certificate, otherwise the certificate application will be returned to the applicant.
Although the CRTC has established criteria to exempt certain categories of DTV broadcasting from its licensing requirements, ISED maintains its requirements for the submission of broadcasting certificate applications because of spectrum management needs.
4.2.1 Online application requirements
The applicant is strongly encouraged to submit an application online through ISED's Spectrum Management System, unless changes are required to a pending application or there are other special circumstances. The online system simplifies application submissions for clients since it allows for the retrieval of existing station data from the ISED database for review and modification. The online validation also minimizes delays as it reduces the possibility for errors or omissions.
The following documentation shall be attached to the application:
- an engineering brief (in PDF format) as per section 4.3 may be required, including any required maps prepared in accordance with section 4.3.7, with the exception of electronic service contours unless requested by ISED; and
- a text file containing azimuth and elevation antenna pattern data, in accordance with annex E of
BPR-1.
4.2.2 Email application requirements in special circumstances
When a situation prevents an application from being submitted online, the applicant may submit the application by email to broadcasting-radiodiffusion@ised-isde.gc.ca.
In addition to the documentation required for online submissions, the following documentation shall be attached to the application:
- form ISED-ISDE3051, Application for a Broadcasting Certificate for a Low-Power or Very Low-Power Undertaking (in PDF format);
- form ISED-ISDE2430, Radiocommunication and Broadcasting Antenna Systems Attestation (in PDF format); and
- a copy of the Letter of Intent to the land-use authority as described in section 2 of BPR-1, if applicable.
It is the applicant's responsibility to ensure that all electronic documents submitted have the necessary signatures.
ISED reserves the right to request a signed attestation to verify the authenticity of an application and may hold the processing of the application until a satisfactory attestation has been received.
4.2.3 Other requirements
All proposed antenna structures, whether new or modified, low or regular power, must comply with the requirements of Client Procedures Circular CPC-2-0-03, Radiocommunication and Broadcasting Antenna Systems, and section 2 of BPR-1.
In addition to meeting the requirements regarding site sharing, land-use consultation and public consultation, applicants must also fulfill other important obligations, including:
- compliance with Health Canada's Safety Code 6 guidelines for the protection of the general public;
- compliance with radio frequency (RF) immunity criteria;
- notification of nearby broadcasting stations;
- environmental considerations; and
- Transport Canada / NAV CANADA aeronautical safety responsibilities.
4.3 Engineering brief requirements
The engineering brief should include the components described below in sections 4.3.1 to 4.3.7 in the order presented to facilitate processing by ISED. The International System of Units (SI) shall be used throughout the engineering brief.
4.3.1 Title page
The title page shall include the submission title, type of broadcasting undertaking proposed, applicant's name and address, broadcasting consultant's name (if applicable), as well as the location of the proposed broadcasting undertaking and submission date. The project or reference number shall also be included.
4.3.2 Table of contents
The table of contents must present the sections of the brief with their respective page numbers.
4.3.3 Summary sheet
The summary sheet shall be prepared as per annex A for email submissions. The summary sheet is optional for online applications.
4.3.4 Main body
The main body of the engineering brief should include the following sections.
Introduction
The introduction must include a general statement of the purpose of the brief in relation to the application, including the primary centre(s) to be served within the noise-limited bounding contour. The programming source(s), method of programming feed and network affiliation should be indicated.
Discussion
A discussion should be included regarding the design considerations to accomplish the applicant's objectives, including the site location, choice of channel and operating parameters.
Assumptions and sources of information
All assumptions and sources of information used to compile the engineering brief must be listed and explained.
Interference analysis
If necessary, include an interference analysis in support of the transmitting channel(s) and the selected parameters (refer to section 4.7).
Transmitter
Specify the make, type, model number and output power (rated and operating) of the transmitter. The output power of the transmitting equipment shall not exceed 50 watts on VHF channels and 500 watts on UHF channels.
Emissions shall meet either the simple or stringent mask shown in figures D2 and D3 respectively of annex D. The applicant shall specify the type of emission mask to be employed and provide a statement related to compliance with the selected mask.
In some circumstances, ISED may require the use of an emission mask with more stringent characteristics (out-of-band emissions) to protect adjacent-band services.
Description of antenna system
The following details are required:
- Antenna: manufacturer, type, model number, number of sections (if applicable) and power gain (relative to a half-wave dipole). The elevation radiation pattern is required in accordance with section 4.3.6. For directional antennas, the azimuth radiation pattern is also required in accordance with section 4.3.6. The largest dimension of the antenna shall be provided.
- Transmission line: manufacturer, type, length (in metres) and efficiency.
- Combiner: manufacturer and operational characteristics.
- Polarization: horizontal, circular or elliptical polarization as proposed. Horizontal polarization is normally used.
Auxiliary transmitting systems
Compliant auxiliary transmitting systems (section 6 of BPR-1) shall be listed, if any.
Bounding contour table
Tabulated bounding contour predictions shall be provided according to the guidelines in annex E.
Interference analysis for mountainous terrain locations
The service of an LPDTV undertaking shall not normally extend beyond a distance of 20 km in any direction from the antenna site in accordance with its protected area.
In mountainous terrain locations, where the transmitting antenna height is more than 300 metres above the elevation of the community to be served, it may not be possible for the service of an LPDTV assignment to extend less than 20 km. In such cases, a broadcast consultant shall be retained to demonstrate that existing primary and secondary assignments will be protected from interference using an analysis that follows the procedures in annexes G and H.
RF exposure and strong adjacent channel TV signal interference issues
The applicant shall provide analyses regarding RF exposure and strong adjacent channel TV signal interference issues. Refer to CPC-2-0-03 and sections 4.2.3 and 4.8 of this document for the requirements regarding these issues.
Off-air reception and microwave links
When a television rebroadcasting station receives a feed from an existing facility using off-air reception (or a combination of off-air reception and microwave links), the engineering brief should specify the type of feed and give a description of the system.
4.3.5 Antenna location and diagrams
Refer to section 3.2.5 of this document for the requirements.
4.3.6 Antenna radiation patterns
Elevation and azimuth antenna radiation patterns shall be provided in graphical and tabular forms. As general guidance, refer to sections 3.2.6 to 3.2.8 of this document.
4.3.7 Maps
A map with a scale of 1:50 000 shall be provided and include the proposed antenna site and its geographical coordinates (latitude and longitude).
A map showing the noise-limited bounding contour shall also be provided.
Maps may be provided indicating the protected areas and interference for the proposed assignment and any other affected assignments or allotments (refer to section 4.7.1).
When a change to the facility is proposed, the applicant shall provide maps indicating comparative contours.
The latitude-longitude geographical projection and the datum WGS84 (in degrees-minutes-seconds format with up to 2 decimals for the seconds) shall be used.
Further details concerning the preparation of maps for engineering briefs are provided in section 3 of BPR-1.
4.4 Technical operation of broadcast transmitter plants
Refer to section 3.3 of this document for the requirements.
4.5 Application requirements for non-program-related data
Refer to section 3.4 of this document for the requirements.
4.6 On-air testing procedure
The procedure outlined in section 1.4 of BPR-1 shall be followed.
4.7 Interference analyses and notifications
This section covers interference analyses and the associated notification procedures.
4.7.1 Interference analysis requirements
An interference analysis in support of the transmitting channel selected should be included in the brief, with particular reference to existing television assignments and allotments in the DTV Allotment Plan. This analysis should demonstrate that interference ceilings for LPDTV stations, as described in section 4.7.2, to primary or secondary assignments operating in the area would not be exceeded. For secondary assignments, an order of protection must be followed as per section 2.2.4. The interference analysis shall use the key assumptions and parameters from section 2.2.5. Technical criteria for determining interference to and from LPDTV stations can be found in annexes G (DTV-DTV) and H (DTV-NTSC).
Moreover, every effort should be made to avoid affecting the off-air receiving systems of neighbouring broadcasting undertakings.
4.7.2 LPDTV interference ceilings
The interference ceiling (in percentage) is the maximum population service loss that a proposal can cause to an existing station. Population service loss shall be calculated as described in section G7 of annex G for existing DTV stations and section H2.5 of annex H for existing NTSC stations.
A proposal for a new LPDTV station shall not cause greater than 0.5% population service loss to a previously approved primary or secondary assignment than the proposal's corresponding baseline parameters.
A proposal for a modified LPDTV station is allowed to cause up to 0.5% population service loss to a previously approved primary or secondary assignment than the proposal's corresponding baseline parameters.
4.7.3 Notifications
LPDTV stations are not required to protect low-power analog television (LPTV) stations. However, LPDTV proposals need to identify all affected LPTV stations and inform them about the potential impact.
4.8 Assessment and control of maximum field strength of TV broadcasting assignments
Refer to section 3.7 of this document for the requirements.
4.9 Transport Stream Identifier (TSID)
Refer to section 3.8 of this document for the requirements.
Annex A: Summary sheet
This annex provides a checklist of information to be included in the engineering brief summary sheet.
General information:
- applicant name
- account number
- station (new or change)
- principal service location (including province)
- station call sign
- originating station (if rebroadcasting)
- channel number
- frequency (MHz)
- type of station (regular or low power)
- TSID
Site details:
- street address or site name
- city
- province or territory
Antenna coordinates (WGS84):
- north latitude (degrees/minutes/seconds)
- west longitude (degrees/minutes/seconds)
Transmitter:
- manufacturer
- model number
- output power (kW)
- emission mask
Transmission line:
- manufacturer/type
- length (m)
- line loss (dB/100m)
- line efficiency (%)
Other losses:
- please specify (%)
Antenna:
- manufacturer
- model
- polarization
- directional/non-directional
- number of bays
- largest dimension (m)
- beam tilt (°)
- maximum gain (dBd) (horizontal/vertical/circular polarization)
- average gain (dBd) (horizontal/vertical/circular polarization)
ERP:
- maximum (kW) (horizontal/vertical/circular polarization)
- average (kW) (horizontal/vertical/circular polarization)
- at beam tilt (kW maximum)
- at beam tilt (kW average)
Heights:
- EHAAT (m)
- radiating centre (above ground level) (m)
- overall tower height (above ground level) (m)
- ground elevation (above mean sea level) (m)
Modes:
- attended or unattended operation
- with or without ancillary service
Annex B: Elevation diagram of typical tower and transmitting antenna
This annex provides an example of an elevation diagram of a typical tower and transmitting antenna.
Figure B1: Elevation diagram of typical tower and transmitting antenna

Annex C: Planning parameters and technical assumptions
This annex contains the planning parameters and technical assumptions required for determining EHAAT and station bounding contours (DUC, NLBC, and protected area) as well as for performing interference analyses.
For additional information refer to the following annexes: annex D (emission masks), annex E (determination of EHAAT and bounding contours), annex F (propagation curves), annex G (DTV-DTV interference analyses), and annex H (DTV-NTSC interference analyses).
C1. Planning factors for DTV reception
The following section is just for information.
The planning factors shown below led to the NLBC field strength limits given in table 2 in section 2.2.2. The field strength values are found by solving the equation below:
Field (dBµV/m) = C/N – Kd – Ka – G + L + Nt + Ns
These planning factors are assumed to characterize the equipment, including antenna systems, used for home reception. They determine the minimum field strength for DTV reception as a function of frequency band and as a function of channel number in the UHF band.
| Planning factor | Symbol | Low VHF | High VHF | UHF |
|---|---|---|---|---|
| Geometric mean frequency (MHz) | F | 69 | 194 | 615 |
| Dipole factor (dBm-dBµV/m) | Kd | –111.8 | –120.8 | –130.8 |
| Dipole factor adjustment | Ka | None | None | See note |
| Thermal noise (dBm) | Nt | –106.2 | –106.2 | –106.2 |
| Antenna gain (dBd) | G | 4 | 6 | 10 |
| Downlead line loss (dB) | L | 1 | 2 | 4 |
| System noise figure (dB) | Ns | 10 | 10 | 7 |
| Required carrier to noise ratio (dB) | C/N | 15 | 15 | 15 |
Note: The adjustment, Ka = 20 log[615/(channel mid-frequency in MHz)], is added to Kd to account for the fact that the field strength requirements are greater for UHF channels above the geometric mean frequency of the UHF band and smaller for UHF channels below that frequency.
C2. Planning parameters and technical assumptions
This section contains the planning parameters and technical assumptions required for determining EHAAT and bounding contours, as well as performing interference analyses.
| Assumption/Parameter | Value |
|---|---|
| Spherical earth distance | 111.15 km/° latitude |
| Earth ground and atmospheric constants | r=15, Ɵ=5 mS/m |
| Climatic zone | Continental temperate (5) |
| Terrain database | Canada: CDED or CDEM, 1 arc-second data or the highest available resolution US: USGS NED, 1 arc-second data or the highest available resolution |
| Calculation of depression angles from transmitter | Spherical earth geometry using elevations above mean sea level (AMSL) |
| Radio signal propagation model | Longley-Rice, version 1.2.2 |
| Longley-Rice service mode | Broadcast |
| Population database | Canada: Statistics Canada, 2021 census data (or latest available) United States: US Census Bureau, 2020 census data (or latest available) |
| Rounding of population centroids | None |
| Terrain extraction interval | 0.1 km for average terrain (HAAT) |
| 1 km or less for path loss | |
| DTV NLBC threshold (LVHF, HVHF, UHF) | Refer to table 2 in section 2.2.2. |
| Analog TV service threshold (Low VHF, High VHF, UHF) not to exceed distance in km | Refer to section H2.1 in annex H. |
| Maximum additional population interference to an existing TV station from another TV station | 0.5% |
| Treatment of TV stations with zero population | Maximum additional interference by area of 2.0%. |
| DTV NLBC statistics (location/situation, time) | 50%, 90% |
| Analog coverage statistics (location/situation, time) |
50%, 50% |
| DTV-into-DTV interference D/U ratio threshold, co-channel | 15 + 10 log [1/(1-10^(-x/10)] dB, where x=S/N-15.19 Reference for additional details: section G4 of annex G. |
| DTV interference statistics (location/situation, time) | 50%, 10% |
| DTV-into-DTV interference D/U ratio threshold, first-adjacent channels | Regular power: −28 dB (lower adj.), −26 dB (upper adj.) Low power: −7 dB (lower and upper adj.) for simple mask, −12 dB (lower and upper adj.) for stringent mask −28 dB (lower adj.), −26 dB (upper adj.) for full mask Reference for additional details: section G4 of annex G. |
| Cell size for Longley-Rice calculations | Square, 2 km/side or less |
| Point used in the cell for pathloss calculation | -Population centroid (cell with population) -Geometric centre (cell with no population) |
| Treatment of kwx=3 warnings* | Accept, assume coverage |
| Transmitter antenna elevation pattern | -As specified. -If not specified: pattern shape as per section G3.2 of annex G (DTV) or section H2.5.1 of annex H (NTSC). |
| Electrical beam tilt | -As specified. -If not specified: 0.75° in accordance with section G3.2 of annex G (DTV) or section H2.5.1 of annex H (NTSC). |
| Mechanical beam tilt | 0 (ignored) |
| Number of radials used for height above the average terrain (HAAT) calculation | 72 (every 5 degrees starting from true north) |
| Number of radials used for contour projection | 360 |
| Minimum HAAT for any radial | 30 m |
| Receive antenna height above ground level (AGL) | 10 m |
| Receive antenna azimuth pattern | -As specified. -If not specified: pattern shape as per section G3.1 of annex G (DTV) and section H2.5.1 of annex H (NTSC). |
| Polarization | Horizontal |
* The error marker KWX is meant to serve as a warning to the user that one or more of the parameters have values that make the results dubious or unusable. Except when it has the value 2, there is no effect on the computations.
Annex D: Emission masks
Figure D1: DTV emission mask and LPDTV full emission mask (based on a measurement bandwidth of 500 kHz)

When using the emission mask for regular-power digital television stations operating as primary assignments:
- in the first 500 kHz from the authorized channel edge, transmitter emissions must be attenuated not less than 47 dB below the average transmitted power;
- more than 6 MHz from the channel edge, emissions must be attenuated by no less than 110 dB below the average transmitted power; and
- at any frequency between 0.5 and 6 MHz from the channel edges, emissions must be attenuated by no less than the value determined by the following formula:
Attenuation (dB) = –11.5(delta(f) + 3.6)
where:
delta(f) is the frequency difference in MHz from the edge of the channel.
Figure D2: LPDTV simple emission mask (based on a measurement bandwidth of 500 kHz)

When using the LPDTV simple emission mask:
- in the first 500 kHz from the authorized channel edge, transmitter emissions must be attenuated not less than 46 dB below the average transmitted power;
- more than 6 MHz from the channel edge, emissions must be attenuated by no less than 71 dB below the average transmitted power; and
- at any frequency between 0 and 6 MHz from the channel edges, emissions must be attenuated by no less than the value determined by the following formula:
Attenuation (dB) = 46 + ([delta(f)]2/1.44)
where:
delta(f) is the frequency difference in MHz from the edge of the channel.
Figure D3: LPDTV stringent emission mask (based on a measurement bandwidth of 500 kHz)

When using the LPDTV stringent emission mask:
- in the first 500 kHz from the authorized channel edge, transmitter emissions must be attenuated no less than 47 dB below the average transmitted power;
- more than 3 MHz from the channel edge, emissions must be attenuated by no less than 76 dB below the average transmitted power; and
- at any frequency between 0.5 and 3 MHz from the channel edges, emissions must be attenuated by no less than the value determined by the following formula:
Attenuation (dB) = 47 + 11.5(delta(f) – 0.5)
where:
delta(f) is the frequency difference in MHz from the edge of the channel.
Annex E: Determination of EHAAT and bounding contours
This annex provides methodology details for the determination of the EHAAT and bounding contours.
E1. Determination of EHAAT
The antenna effective height above average terrain (EHAAT) is the average of the antenna heights above average terrain (HAATs) for 72 radials spaced every 5° of azimuth starting with true north. The HAAT is the height of the centre of radiation of the antenna above the average elevation of the terrain, based on Canadian Digital Elevation Data (CDED) or Canadian Digital Elevation Model (CDEM) one arc-second data (or highest available resolution) for Canada and the United States Geological Survey National Elevation Dataset (USGS NED) one arc-second data (or highest available resolution) for the United States, as measured from 3 to 16 km from the antenna for each radial (0 to 5 km for LPDTV). Determination of HAAT does not stop at the border or over bodies of water. HAAT incorporates the full 3 to 16 km radial segment (0 to 5 km for LPDTV), and will not employ truncated radials for calculations of radial average elevations above mean sea level (AMSL).
In the event of a discrepancy, the analysis by ISED shall prevail.
E2. Determination of digital television urban contour
The DTV urban contour (DUC), for regular-power stations, is computed using the site location, maximum ERP, heights above average terrain (HAATs) and the antenna azimuth radiation pattern. The distance to the bounding contour is determined, in each of the 360 degree compass directions, by using a combination of actual and linear interpolated HAAT and antenna radiation data. HAAT is determined directly from the terrain elevation database every 5 degrees, starting from true north, and by linear interpolation for radials in between. Directional antenna tabulations provide actual relative field every 5 degrees starting from true north. Linear interpolation is used to derive relative field values in between. Individual relative field values are squared and multiplied by the maximum ERP to find the ERP along a specific azimuth. In predicting the distance to the contour, the F(50,90) propagation curves should be used to calculate the field strengths (refer to annex F).
E3. Determination of noise-limited bounding contour
The noise-limited bounding contour (NLBC) is computed using the site location, maximum ERP, heights above average terrain (HAATs) and the antenna azimuth radiation pattern. The distance to the bounding contour is determined, in each of the 360 degree compass directions, by using a combination of actual and linear interpolated HAAT and antenna radiation data. HAAT is determined directly from the terrain elevation database every 5 degrees, starting from true north, and by linear interpolation for radials in between. Directional antenna tabulations provide actual relative field every 5 degrees starting from true north. Linear interpolation is used to derive relative field values in between. Individual relative field values are squared and multiplied by the maximum ERP to find the ERP along a specific azimuth. In predicting the distance to the bounding contour, the F(50,90) propagation curves should be used to calculate the field strengths (refer to annex F).
E4. Determination of protected area
The location of the noise-limited bounding contour is based on the F(50,90) propagation curves in annex F. The true television service availability may vary from these estimates because the terrain over any specific path is expected to be different from the type of terrain on which the propagation curves are based. Therefore, the Longley-Rice propagation model, with the appropriate location and time statistics (50% and 90%), are to be used to determine the protected area. The protected area is limited to a distance of 100 km for regular-power stations and 20 km for low-power stations.
E5. Bounding contour tables
The bounding contour tables for DTV should contain information as illustrated in the following example:
| Radial no. | Azimuth (degrees) | ERP (kW) | HAAT (m) | Distance to digital urban contour (km) @ 61 dBµV/m | Distance to noise-limited bounding contour (km) @ 41 dBµV/m |
|---|---|---|---|---|---|
| 1 | 0 | 20 | 190 | 38 | 62 |
| 2 | 45 | 19 | 207 | 39 | 63 |
| 3 | 90 | 18 | 232 | 40 | 64 |
| 4 | 135 | 17 | 335 | 44 | 71 |
| 5 | 180 | 17 | 281 | 42 | 67 |
| 6 | 225 | 20 | 200 | 39 | 62 |
| 7 | 270 | 17 | 311 | 43 | 69 |
| 8 | 315 | 17 | 296 | 43 | 68 |
Table E1 should be based on a sample of eight out of the 72 radials taken at 5-degree intervals from true north to determine the HAATs.
The bounding contour tables for LPDTV should contain information as illustrated in the following example:
| Radial no. | Azimuth (degree) | ERP (W) | HAAT (m) | Distance to noise-limited bounding contour (km) @ 51 dBµV/m |
|---|---|---|---|---|
| 1 | 0 | 500 | 28 | 14 |
| 2 | 90 | 2000 | 30 | 19 |
| 3 | 180 | 1000 | 25 | 17 |
| 4 | 270 | 800 | 27 | 16 |
Table E2 should be based on a sample of four out of the 72 radials taken at 5-degree intervals from true north to determine the HAATs.
Annex F: Use of field strength charts
To use the charts to predict the distance to a given contour, follow this procedure:
- convert the ERP in kW for the appropriate azimuth into decibel value referenced to 1 kW (dBk).
- subtract the power value in dBk from the contour value in dBµV/m. Note that for power less than 1 kW, the difference value will be greater than the contour value because the power in dBk is negative.
- locate the difference value obtained on the vertical scale at the left edge of the chart.
- follow the horizontal line for that value into the chart to the point of intersection with the vertical line above the HAAT for the appropriate azimuth located on the scale at the bottom of the chart.
- if the point of intersection does not fall exactly on a distance curve, interpolate between the distance curves below and above the intersection point. The distance values for the curves are located along the right edge of the chart.
- in directions where the terrain is such that negative antenna heights or heights below 30 metres for the 3 to 16 km sector are obtained, an assumed height of 30 metres shall be used for the prediction of field strength.
- for the purposes of estimating field strength, when using the propagation curves in this annex, any HAAT values exceeding 1600 metres must be entered as 1600 metres.
Figure F1: F(50,10) propagation curve for Low VHF

Figure F2: F(50,10) propagation curve for High VHF
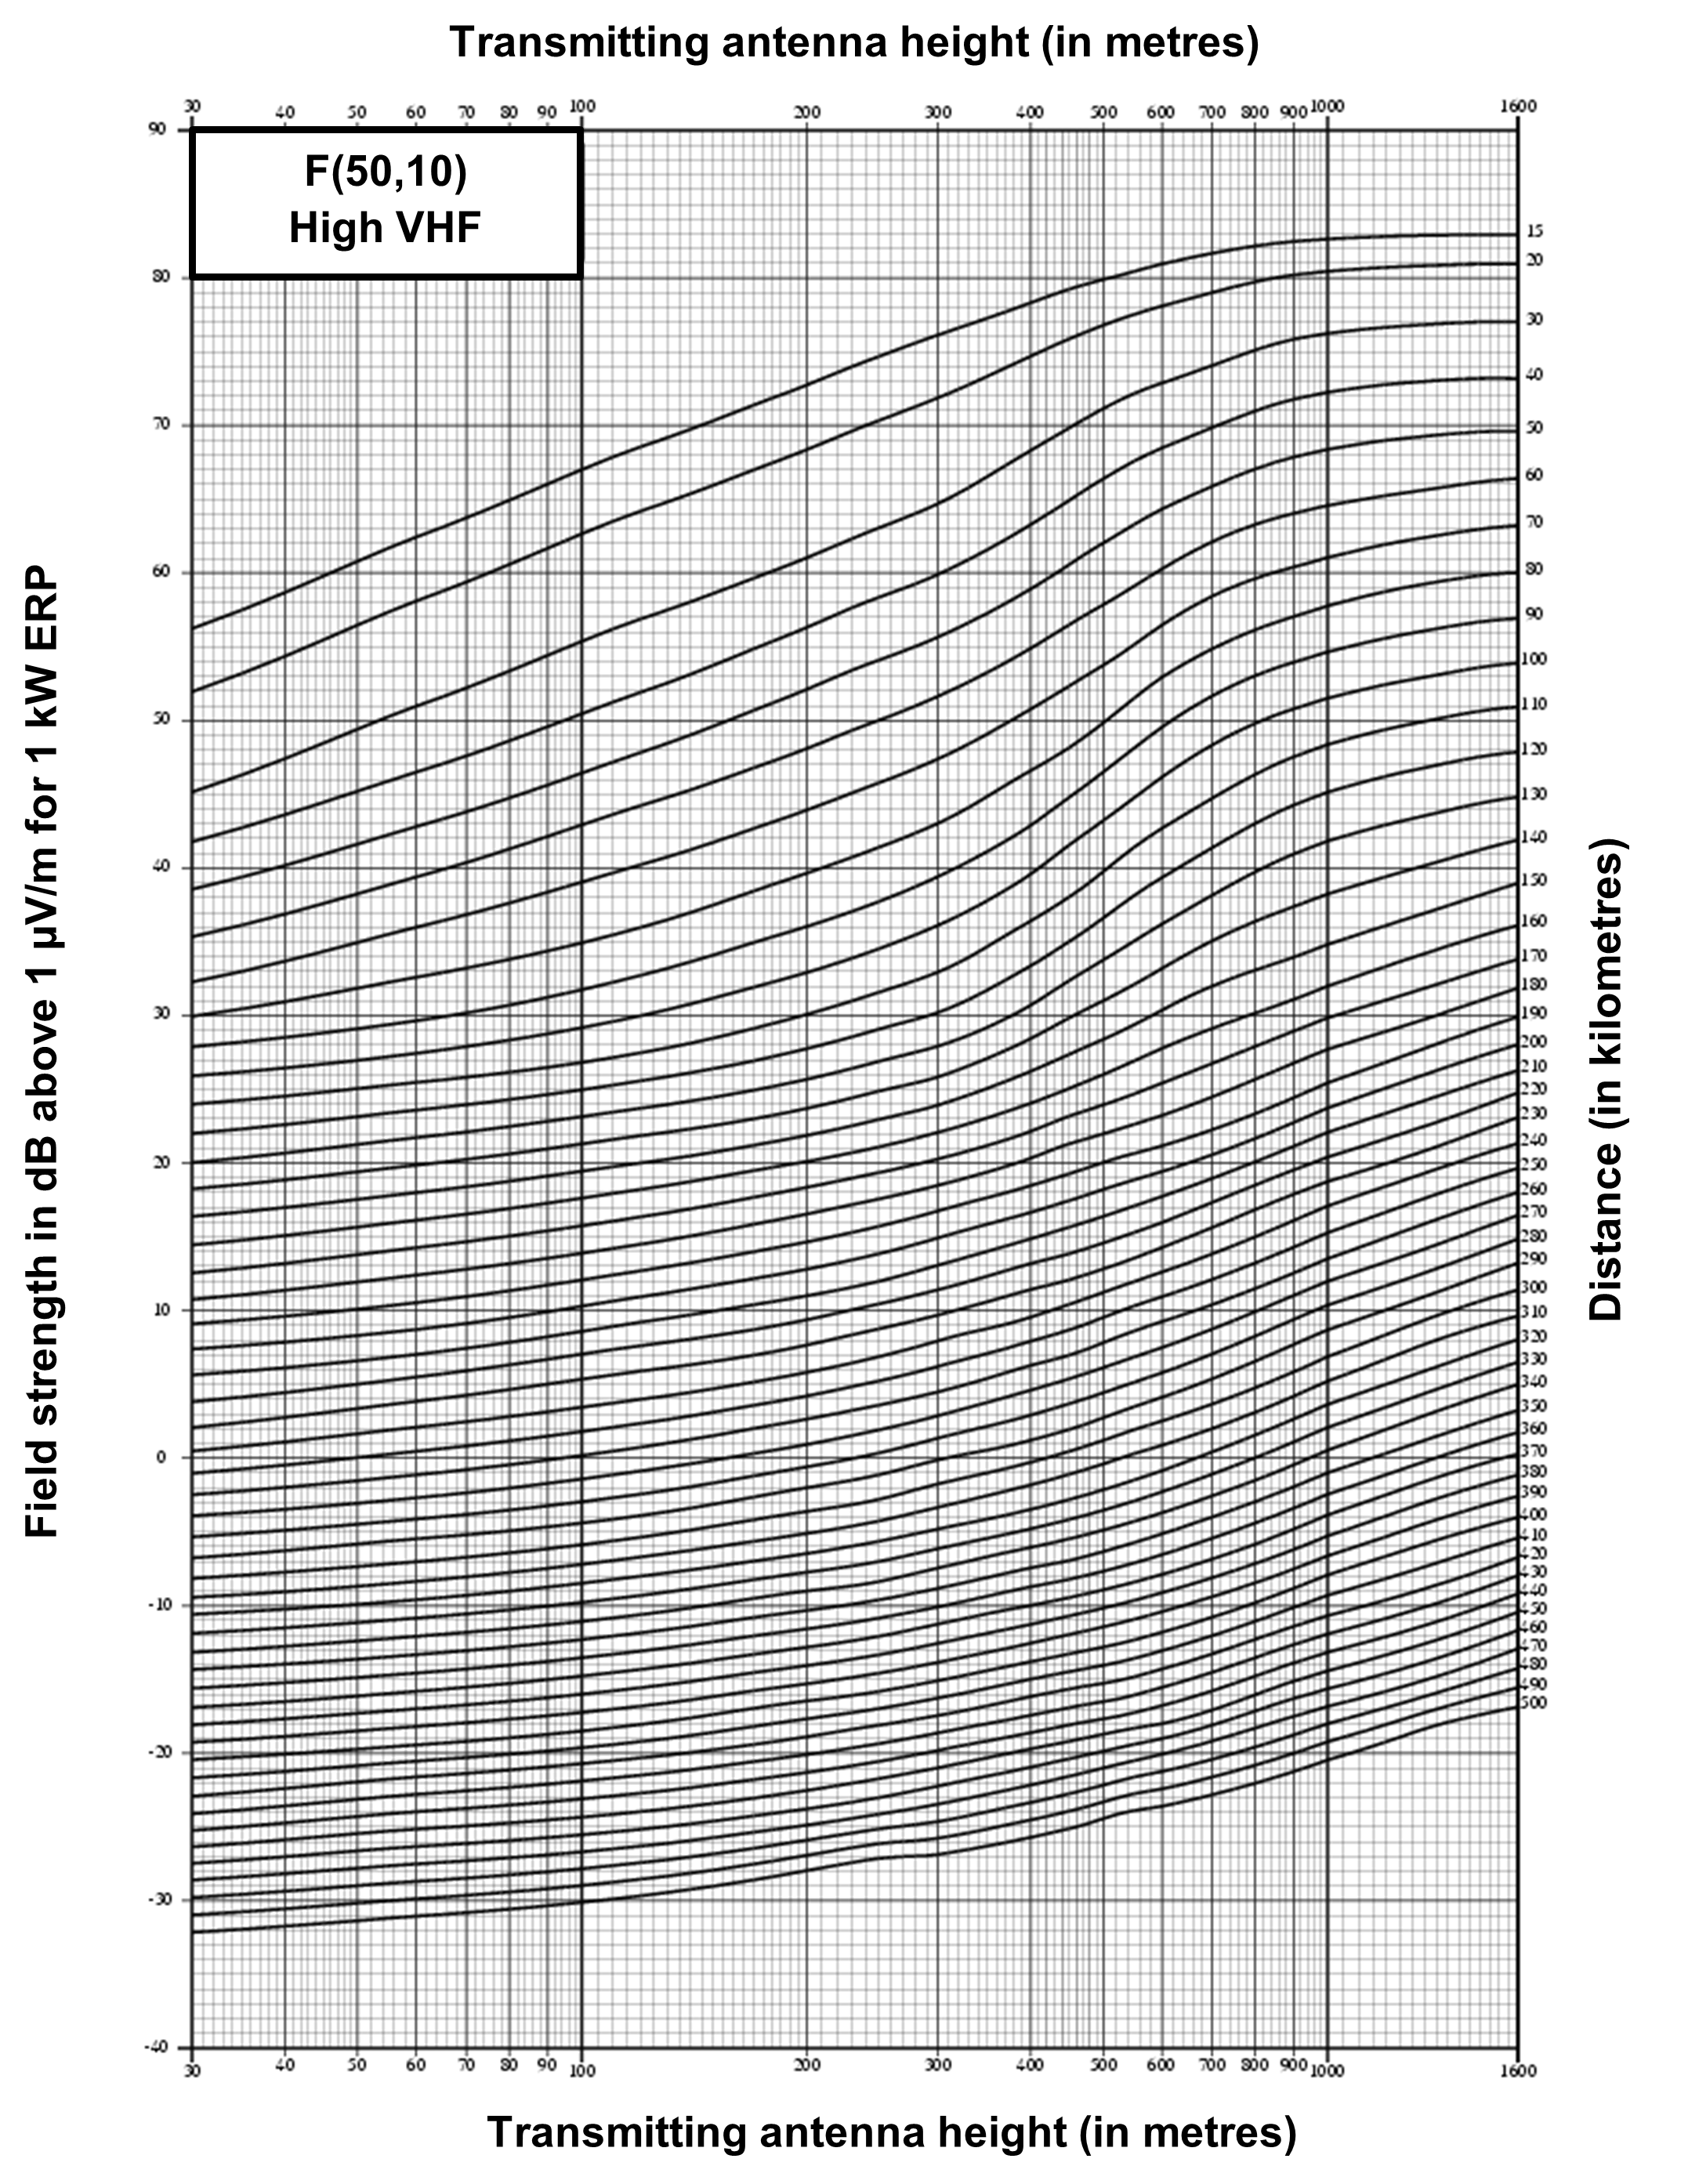
Figure F3: F(50,10) propagation curve for UHF
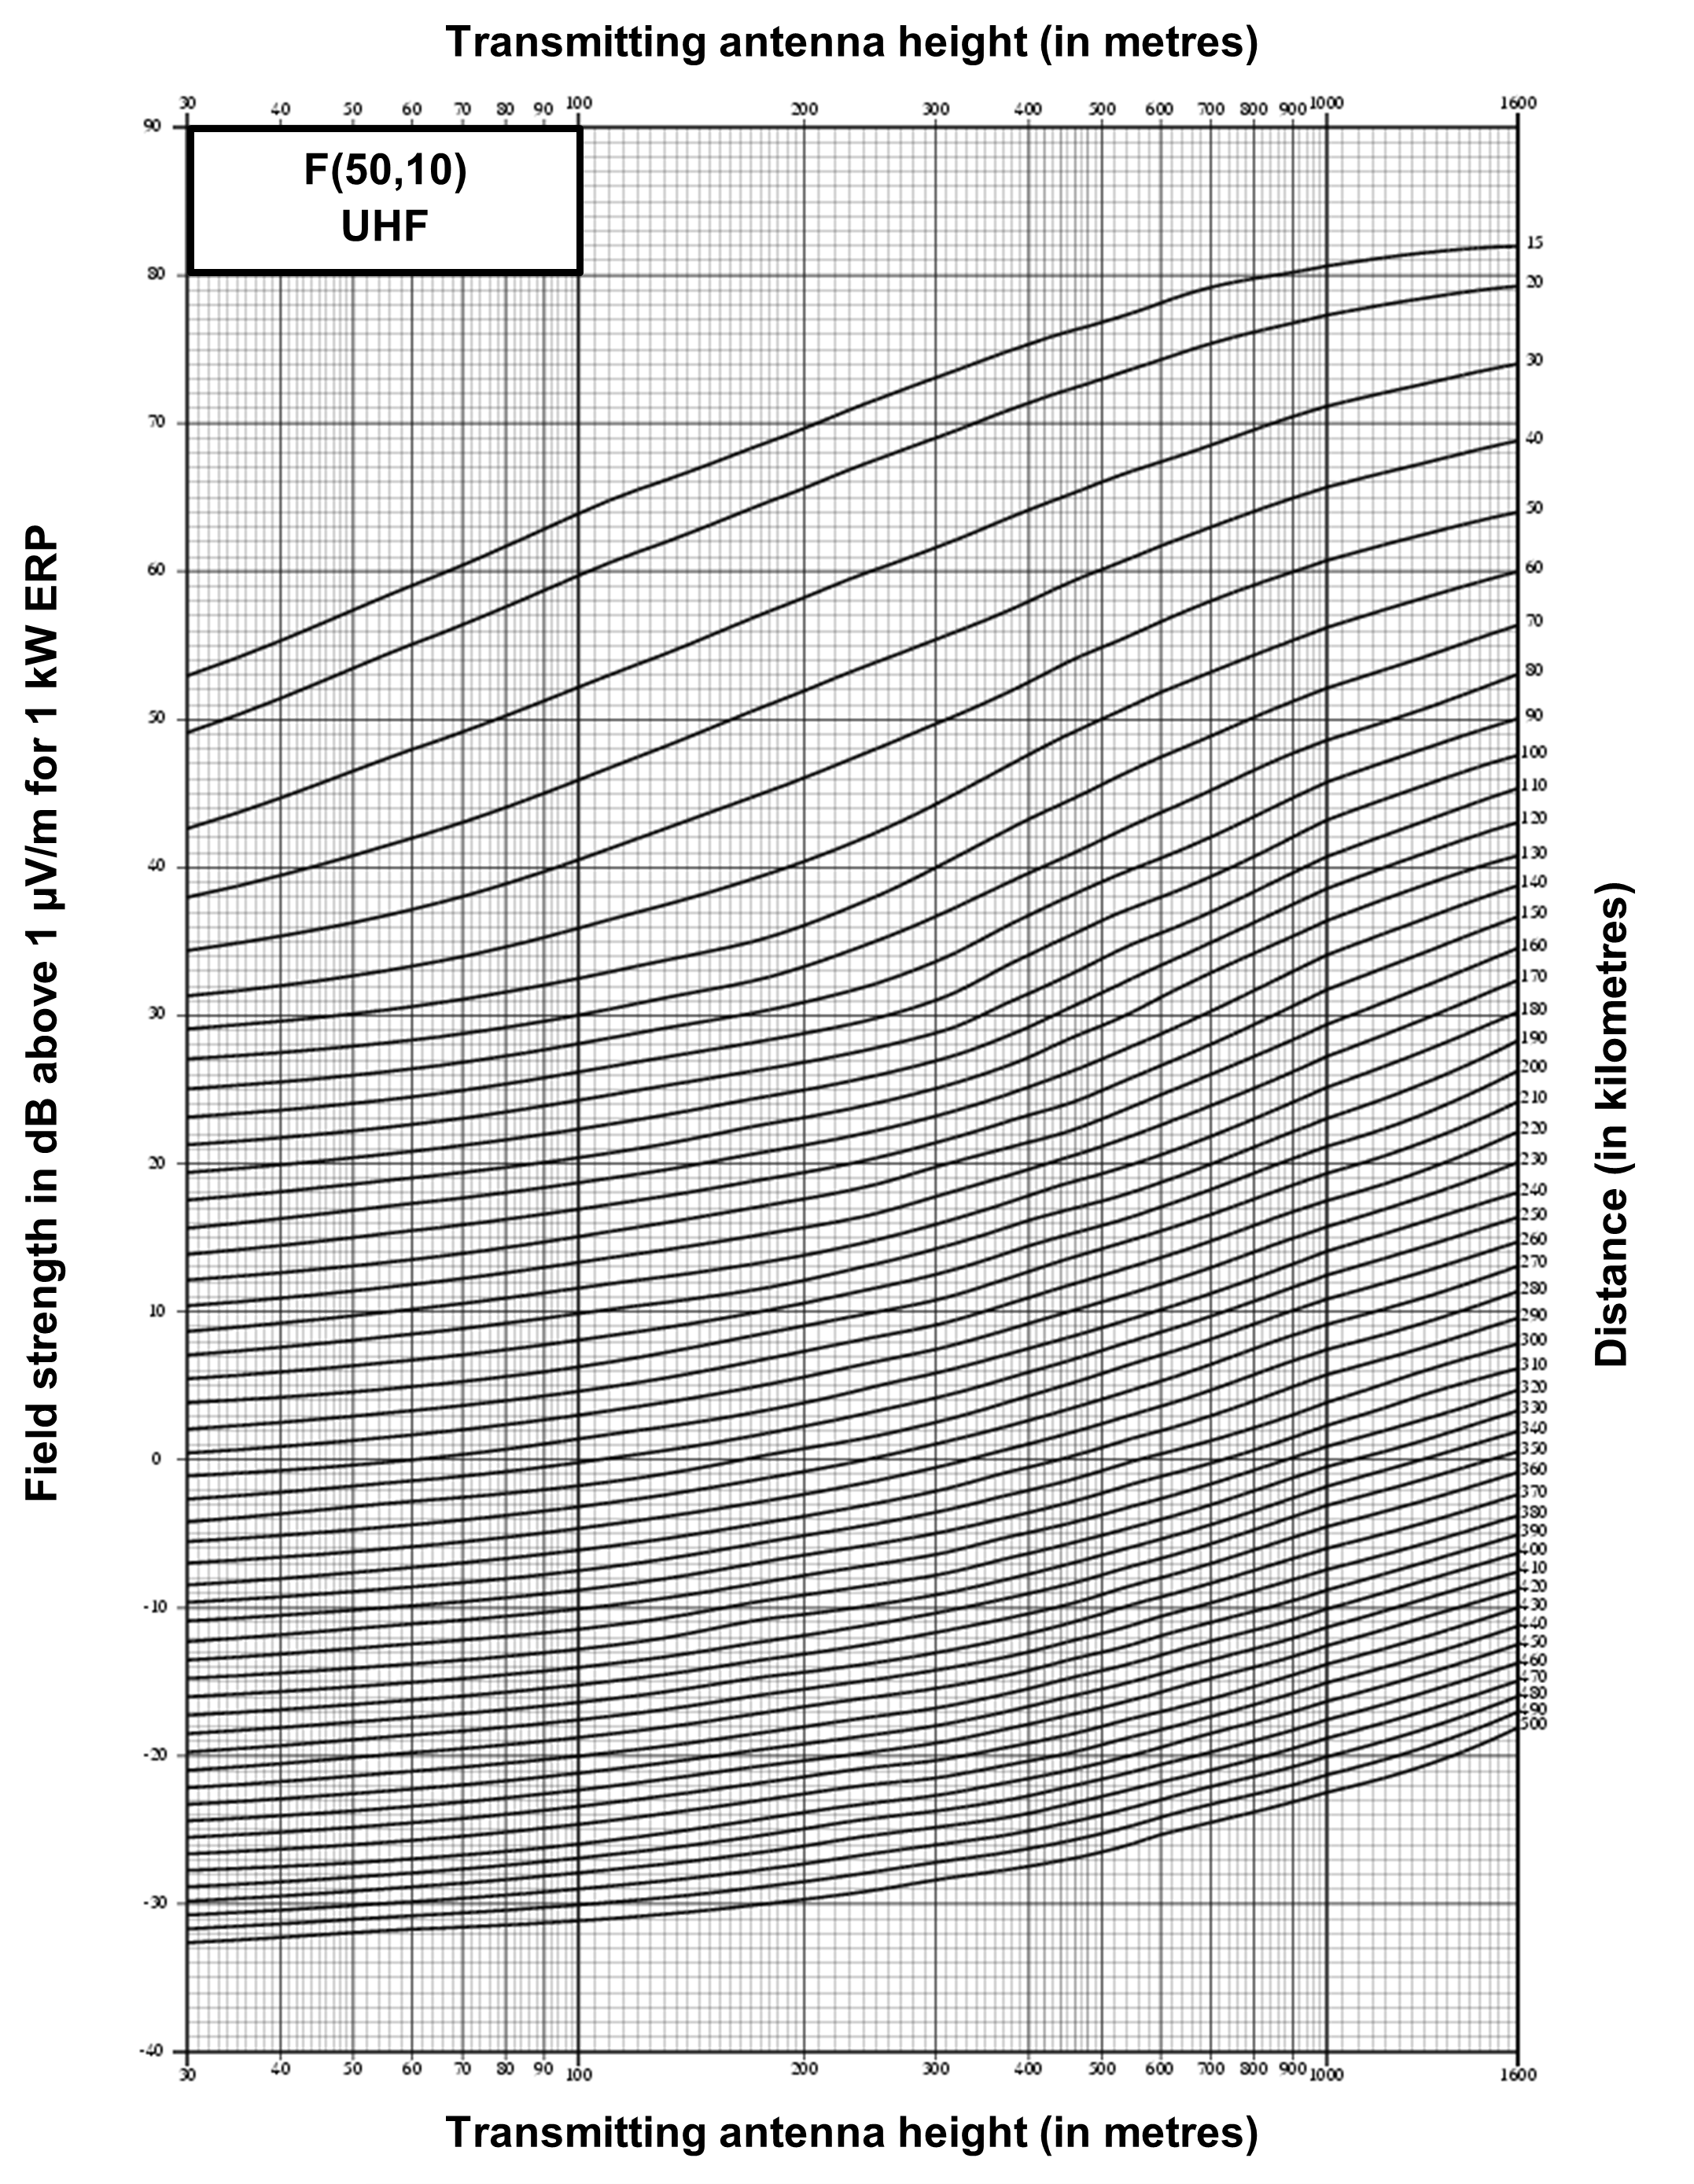
Figure F4: F(50,90) propagation curve for Low VHF

Figure F5: F(50,90) propagation curve for High VHF

Figure F6: F(50,90) propagation curve for UHF

Figure F7: F(50,50) propagation curve for Low VHF

Figure F8: F(50,50) propagation curve for High VHF

Figure F9: F(50,50) propagation curve for UHF

Annex G: Interference analysis (DTV-DTV)
This annex describes the steps to conduct an interference analysis involving DTV assignments or allotments, including LPDTV.
G1. Identification of potentially interfering assignments and allotments
Assignments and allotments that may be a source of interference are identified as a function of distance and channel relationships. Only those assignments or allotments whose distance from the protected station is less than the value given in table G1 are considered as potential sources of interference.
| Interfering channel offset relative to desired channel | Maximum distance from protected station to interfering station (km) |
|---|---|
| –1 | 200 |
| 0 | 450 |
| +1 | 200 |
G2. Short-spacing determination
Depending on the relative strength of the two stations involved, separation distances are based on the protection of the contour on the near side or on the far side. The required distance between adjacent channels is based on the near-side value, whereas the required distance between co-channels may be based either on the near side or on the far side, whichever gives the largest distance. Both cases are calculated at the edge of a circle with radius distP. The value of distP is computed using the F(50,90) propagation curves given in annex F, the desired (D) field strength as specified in table 2 of section 2.2.2, the EHAAT and the maximum ERP of the desired station. Then the undesired (UNS and UFS) field strengths are computed using the following formulas:
UNS = D – D/Uiv + FB, in the near-side case and,
UFS = D – D/Uiv, in the far-side case.
where:
FB is the front-to-back ratio of the receive antenna in dB, given in table G2 of section G3;
D/Uiv in dB is the system input voltage protection ratio as given in tables G4 and G5 of section G4;
D is the desired field strength in dB and U is the undesired field strength in dB;
UNS is the undesired field strength in dB for the near side; UFS is the undesired field strength in dB for the far side.
Once the undesired field strength values are computed (UNS and UFS), one can then use the undesired station's ERP and EHAAT, together with the F(50,10) propagation curves given in annex F, to calculate the minimum required distances between the undesired station and the edges of the circle (distUNS and distUFS).
In order to compute the required distance to protect the desired station, the radius of the previously defined circle (distP) is then added to distUNS in the near-side case or subtracted from distUFS in the far-side case:
distREQns = 1.12×(distP + distUNS) in the near-side case
distREQfs = 1.12×(distUFS – distP) in the far-side case
where:
distP is the radius of the circle computed using the appropriate F(50,90) propagation curve given in annex F; the desired (D) field strength as specified in table 2 of section 2.2.2; the EHAAT and the maximum ERP of the desired station;
distUNS is the minimum required distance between the undesired station and the near-side edge of the circle, computed with the appropriate F(50,10) propagation curve; and
distUFS is the minimum required distance between the undesired station and the far-side edge of the circle, computed with the appropriate F(50,10) propagation curve.
Once the far side distance and the near side distance values are computed using the equations in this section, one should retain the maximum of the two as the required separation distance to protect the desired station.
As the desired station also needs to protect the undesired station from interference, it is also necessary to calculate the required distance in order to protect the undesired station. The same procedure is carried out using the former desired station as the current undesired one and the former undesired station as the current desired one. The final required separation distance is the maximum of the required distance to protect the desired station and the required distance to protect the undesired station.
Two stations are considered to be short-spaced if the distance between the stations is less than the required separation distance calculated. As a result, a more detailed interference analysis is needed to determine the interference using the method in section G6 of this annex.
G3. Antenna patterns
This section contains receiving and transmitting antenna patterns that shall be used when the specific patterns are not available.
G3.1 Receiving antenna pattern
The receiving antenna is assumed to have a directional gain pattern, which tends to discriminate against off-axis undesired stations. This pattern is a planning factor affecting interference. The attenuation, in dB, provided by the assumed receiving pattern is:
For θ < 90 degrees:
Low VHF: MAX (–10, 20log(cos4(θ)))
High VHF: MAX (–12, 20log(cos4(θ)))
UHF: MAX (–14, 20log(cos4(θ)))
For θ ≥ 90 degrees, the attenuation is at its maximum value as in table G2 below.
where:
θ is the angle between the lines joining the desired and undesired stations to the reception point.
When the undesired station is far off-axis, the maximum discrimination given by the front-to-back ratio is attained.
| Front-to-back ratios (dB) | ||
|---|---|---|
| Low VHF | High VHF | UHF |
| 10 | 12 | 14 |
Figure G1: Receiving antenna pattern

G3.2 Transmitting antenna pattern
The transmitting antenna is assumed to have a vertical gain pattern as per table G3. The gain between 90 degrees above the horizontal and 0.75 degrees below the horizontal is 1.00.
| Angle (degrees) | Gain in vertical plane (relative field strength) | ||
|---|---|---|---|
| Low VHF | High VHF | UHF | |
| 0.75 | 1.000 | 1.000 | 1.000 |
| 1.50 | 1.000 | 0.970 | 0.880 |
| 2.00 | 0.990 | 0.940 | 0.690 |
| 2.50 | 0.980 | 0.890 | 0.460 |
| 3.00 | 0.970 | 0.820 | 0.260 |
| 3.50 | 0.950 | 0.730 | 0.235 |
| 4.00 | 0.930 | 0.650 | 0.210 |
| 5.00 | 0.880 | 0.470 | 0.200 |
| 6.00 | 0.820 | 0.330 | 0.150 |
| 7.00 | 0.740 | 0.280 | 0.150 |
| 8.00 | 0.637 | 0.280 | 0.150 |
| 9.00 | 0.570 | 0.280 | 0.150 |
| 10.00 | 0.480 | 0.250 | 0.150 |
Figure G2: DTV transmitting antenna pattern (elevation)

G4. Desired-to-undesired (D/U) input voltage ratios
G4.1 DTV
Criteria for the ratio of desired-to-undesired input voltage are summarized in the following table.
| Interfering channel offset relative to protected channel | D/U ratio (dB) |
|---|---|
| –1 (Lower adjacent) | –28 |
| 0 (Co-channel) | +15* |
| +1 (Upper adjacent) | –26 |
* The D/U ratio for co-channel interference in tables G4 and G5 is only valid at locations where the signal-to-noise (S/N) ratio is 28 dB or greater. At the noise-limited bounding contour, where the S/N ratio is 16 dB, the co-channel D/U ratio is 23 dB. At locations where the S/N ratio is greater than 16 dB, but less than 28 dB, D/U values for co-channel interference are as follows:
D/U = 15 + 10log10[1.0/(1.0–10–x/10)],
where:
x = S/N – 15.19 dB
The quantity "x" is the amount by which the desired S/N ratio exceeds the minimum required for DTV reception.
This adjustment is made to the co-channel D/U ratios to account for degradation due to increased noise when the S/N ratio is near the limiting value for reception.
G4.2 LPDTV
As low-power digital television stations may operate with one of three different emission masks, first-adjacent protection ratios should be adjusted accordingly. These D/U ratios are applied to low-power digital television stations for all their respective first-adjacent protection requirements.
| Interfering channel offset relative to protected channel | D/U ratio (dB) |
|---|---|
| –1 (Lower adjacent) +1 (Upper adjacent) for simple mask |
–7 |
| –1 (Lower adjacent) +1 (Upper adjacent) for stringent mask |
–12 |
| –1 (Lower adjacent) +1 (Upper adjacent) for full mask |
−28 −26 |
| 0 (Co-channel) | +15* |
* see table G4
G4.3 DTV and LPDTV
Co-channel and first-adjacent interference criteria for protecting DTV from LPDTV are summarized in the following table.
| Interfering channel offset relative to protected channel | D/U ratio (dB) |
|---|---|
| –1 (Lower adjacent) +1 (Upper adjacent) for simple mask |
–7 |
| –1 (Lower adjacent) +1 (Upper adjacent) for stringent mask |
–12 |
| –1 (Lower adjacent) +1 (Upper adjacent) for full mask |
−28 −26 |
| 0 (Co-channel) | +15* |
* see table G4
Co-channel and first-adjacent interference criteria for calculating interference from DTV to LPDTV are summarized in the following table.
| Interfering channel offset relative to protected channel |
D/U ratio (dB) |
|---|---|
| –1 (Lower adjacent) | –28 |
| 0 (Co-channel) | +15* |
| +1 (Upper adjacent) | –26 |
* see table G4
G5. D/U field strength ratio
The desired-to-undesired (D/U) field strength ratio in dB can be derived from the ratio of tables G4 and G5 and from the directional gain pattern (GP) in dB of the receiving antenna as described in section G3.
D/U (Field Strength) = D/U (Input Voltage) – |GP|
The required D/U field strength ratio at the edge of the noise-limited bounding contour on the near side can be calculated by using the front-to-back (FB) ratio in dB in table G2 of section G3.
D/U (Field Strength) = D/U (Input Voltage) – FB
Therefore, the DTV required D/U field strength ratios at the edge of the noise-limited bounding contour on the near side are:
| Interfering channel offset relative to protected channel | Required D/U field strength ratio (dB) | ||
|---|---|---|---|
| Low VHF | High VHF | UHF | |
| –1 (Lower adjacent) | –38 | –40 | –42 |
| 0 (Co-channel) | 13 | 11 | 9 |
| +1 (Upper adjacent) | –36 | –38 | –40 |
G6. Interference calculations
The interference analysis should be based on a terrain-sensitive method. The Longley-Rice propagation model, version 1.2.2, using the appropriate location and time statistics. The area within a station's noise-limited bounding contour is normally divided into square cells. The coordinates of the census blocks inside each cell are retrieved along with the population of each block. The census blocks should be based on Statistics Canada 2021 census data (or latest available) and US Census Bureau 2020 census data (or latest available). From this information, the total population and the coordinates of the cell centroid are determined for each cell. A square cell size of 2 km or less on a side shall be used.
First, the desired field strength is evaluated for each cell within the noise-limited bounding contour. A radio path between the desired DTV transmitter and the population centroid of each cell is examined using the Longley-Rice propagation model applied for the median situations for 50% of locations, 90% of the time at a receiver antenna height of 10 m above ground level. The interference analysis retains only those population cells that have been determined to have desired field strength above the threshold for reception given in table 2 of section 2.2.2. Radio paths between undesired DTV transmitters and the point representing protected population are examined. For each such radio path, the Longley-Rice propagation model is applied for median situations for 50% of locations, 10% of the time at a receiver antenna height of 10 m above ground level. The terrain elevations data used in the analysis should be based on the Canadian Digital Elevation Data (CDED) or Canadian Digital Elevation Model (CDEM). For the United States, the data used should be based on the United States Geological Survey (USGS) National Elevation Dataset (NED). One arc-second data (or the highest available resolution) shall be used. A protected population cell being examined is counted as having interference if the ratio of desired-to-undesired input voltage from each interference source is less than the critical minimum values given in section G4 of this annex. It should be noted that the comparison is made after applying the discrimination effect of the receiving antenna.
G7. Calculation of population service loss
The population service loss caused by a new proposal is calculated as:
% Population service loss = \( \frac{A}{B}\) × 100%
Where:
- A = additional unique interference caused by the proposal within the baseline interference-free service population
- B = the undertaking's baseline interference-free service population
Annex H: Interference analysis (DTV-NTSC)
This annex describes the steps to conduct an interference analysis between DTV assignments or allotments and National Television Systems Committee (NTSC) assignments, including LPDTV and LPTV.
H1. NTSC parameters
This section provides NTSC parameters that are for information only.
H1.1 NTSC assignments
The following table provides standard operating parameters of NTSC stations for the three frequency bands.
| NTSC class | UHF | UPPER VHF | LOWER VHF | |||
|---|---|---|---|---|---|---|
| ERP | EHAAT | ERP | EHAAT | ERP | EHAAT | |
| R | 325 kW | 150 m | 100 kW | 150 m | ||
| C | 1 MW | 300 m | ||||
| B | 100 kW | 150 m | ||||
| A | 10 kW | 100 m | ||||
| LP | 5 kW | 30 m | 400 W | 30 m | 100 W | 30 m |
H1.2 Antenna height and power equivalence
Where the antenna height exceeds the values shown in the above table, the effective radiated power (ERP) shall be reduced to provide equivalence with the maximum or other permissible parameters. Equivalence requires that the contours as defined by the field strengths in table H2 of section H2.1 remain at the same location.
H2. Interference analysis
This section describes the steps to perform an interference analysis.
H2.1 Protected contour
In predicting the distance to the protected service contour of NTSC assignments, the field strengths listed in the second column of table H2 and the F(50,50) propagation curves should be used. The F(50,50) propagation curves represent the field strength at 9.1 m above ground, which is exceeded at 50% of the locations and 50% of the time as measured in decibels above one microvolt per metre. The curves are based on an effective power of one kilowatt radiated from a half-wave dipole in free space and can be found in annex F.
The protected area of an NTSC assignment is the geographic area inside the protected service contour where the (50,50) field strength, as predicted using the appropriate effective radiated power (ERP) and a terrain-sensitive propagation model, equals or exceeds the NTSC field strength values as specified in table H2. Protection is provided within a distance of 89 km for a low VHF regular (R) station, 82 km for a high VHF regular (R) station, 70 km for a Class C UHF station, 45 km for a Class B UHF station, 25 km for a Class A UHF station and 12 km for a low-power (LP) station.
The following table gives the various field strengths of the protected contour for NTSC and DTV assignments or allotments.
| Frequency band | DTV field strength (dBµV/m) | NTSC field strength (dBµV/m) |
|---|---|---|
| Low VHF | 28 | 47 |
| High VHF | 36 | 56 |
| UHF | 41 – 20 log(615/F)* | 64 |
* where F is the channel mid-frequency in MHz.
H2.2 Separation distances
The separation distances between various services and channel relationships are to be based on the protection ratios of section H2.3 of this annex. The interfering field strength at the protected contour shall be based on the F(50,10) propagation curves in all cases.
The F(50,10) propagation curves can be found in annex F.
Assignments and allotments that may be a source of interference are identified as a function of distance and channel relationships. Only those assignments or allotments whose distance from the protected station is less than the value given in table H3 are considered as potential sources of interference.
| Interfering channel offset relative to desired channel | Maximum distance from protected station to interfering station (km) |
|---|---|
| –1 | 200 |
| 0 | 450 |
| +1 | 200 |
| ±2, ±3, ±4, ±7, ±8, +14, +15 | 135 |
H2.3 DTV/NTSC system protection ratios
The system protection ratios are given as input voltage ratios (D/Uiv) in the following tables.
| Interference | D/Uiv ratio (dB) |
|---|---|
| DTV into NTSC | 34 |
| NTSC into DTV | 2* |
* The D/U ratio for co-channel interference in table H4 is only valid at locations where the signal-to-noise (S/N) ratio is 25 dB or greater. At the noise-limited bounding contour, where the S/N ratio is 16 dB, the co-channel D/U ratio is 21 dB. At locations where the S/N ratio is greater than 16 dB, but less than 25 dB, D/U values for co-channel interference can be found in table H5. Use linear interpolation for S/N values between those given in the table.
| S/N ratio (dB) | D/Uiv ratio (dB) |
|---|---|
| 16.00 | 21.00 |
| 16.35 | 19.94 |
| 17.35 | 17.69 |
| 18.35 | 16.44 |
| 19.35 | 7.19 |
| 20.35 | 4.69 |
| 21.35 | 3.69 |
| 22.35 | 2.94 |
| 23.35 | 2.44 |
| 25.00 | 2.00 |
This adjustment is made to the co-channel D/U ratios to account for degradation due to increased noise when the S/N ratio is near the limiting value for reception.
| Interference | D/Uiv ratio (dB) |
|---|---|
| Lower DTV into NTSC* | –14 |
| Upper DTV into NTSC* | –17 |
| Lower NTSC into DTV | –48 |
| Upper NTSC into DTV | –49 |
| Interfering channel offset relative to protected channel | D/U ratio (dB) |
|---|---|
| –1 (Lower adjacent) +1 (Upper adjacent) for simple mask |
10 |
| –1 (Lower adjacent) +1 (Upper adjacent) for stringent mask |
0 |
| –1 (Lower adjacent) +1 (Upper adjacent) for full mask |
−14 −17 |
| DTV into NTSC (channel N) | |
|---|---|
| DTV channel | D/Uiv ratio (dB) |
| N–2 | –24 |
| N+2 | –28 |
| N–3 | –30 |
| N+3 | –34 |
| N–4 | –34 |
| N+4 | –25 |
| N–7 | –35 |
| N+7 | –43 |
| N–8 | –32 |
| N+8 | –43 |
| N+14 | –33 |
| N+15 | –31 |
H2.4 Evaluation of separation distances
Depending on the relative strength of the two stations involved, separation distances may be based on the protection of the contour on the near side or the far side. The required distance between adjacent channels is based on the near-side value, whereas the required distance between co-channels is based on the maximum of the near side and far side, whichever gives the largest distance. Both cases are calculated at the edge of a circle with a radius distP around the desired station, which corresponds to the existing assignment to be protected. The distP can be computed using the appropriate propagation curve from annex F using the Desired (D) field strength as specified in table H2 of section H2.1, the EHAAT and the maximum ERP of the desired station. If the desired station is an NTSC station, one should use the F(50,50) propagation curves and if it is a DTV station, the F(50,90) propagation curves should be used. The undesired (UNS and UFS) maximum acceptable field strengths for the proposed assignment or allotment are computed with the following formulas:
UNS = D – D/Uiv + FB in the near-side case and
UFS = D – D/Uiv in the far-side case
where:
FB is the front-to-back ratio of the receive antenna in dB, given in table H8;
D/Uiv in dB is the system input voltage protection ratio as given in the tables in section H2.3;
D is the desired field strength in dB;
UNS is the undesired field strength in dB for the near side; and
UFS is the undesired field strength in dB for the far side.
The front-to-back ratios for different bands are given in the table below:
| Frequency band | NTSC station | DTV station |
|---|---|---|
| Low VHF | 6 | 10 |
| High VHF | 6 | 12 |
| UHF | 6 | 14 |
Once the undesired field strength values are computed (UNS and UFS), one can then use the undesired station's maximum ERP and overall EHAAT, together with the appropriate F(50,10) propagation curve given in annex F to calculate the minimum required distances between the undesired station and the edges of the circle (distUNS and distUFS).
In order to compute the total required distance to protect the desired station, the radius of the previously defined circle (distP) is then added to distUNS in the near-side case or subtracted from distUFS in the far-side case:
distREQns = 1.12×(distUNS + distP) in the near-side case
distREQfs = 1.12×(distUFS – distP) in the far-side case
where:
distP is the radius of the circle computed with the appropriate propagation curve using the desired (D) field strength (table H2, section H2.1 of this annex), the maximum ERP and the overall EHAAT of the desired station;
distUNS is the minimum required distance between the undesired station and the near-side edge of the circle, computed with the appropriate F(50,10) propagation curve; and
distUFS is the minimum required distance between the undesired station and the far-side edge of the circle, computed with the appropriate F(50,10) propagation curve.
Once the far side and the near side distance values are computed using the equations in this section, one should retain the maximum of the two as the required distance to protect the existing assignment.
As it is also necessary to identify the possibility of interference from the existing assignment to the proposed assignment, the procedure shall be repeated, using the existing assignment (former desired station) as the current undesired station and the proposed assignment as the desired one.
Once both procedures have been repeated, the required distance between the two assignments is the greater of the two calculated distances.
H2.5 Short-spacing and interference analysis
This section describes the procedure to be followed when the distance between two stations is less than the required separation distance calculated as described in section H2.4 of this annex.
H2.5.1 Antenna patterns
This section provides information on receiving and transmitting antenna patterns that shall be used in interference calculations when the specific patterns are not available.
The receiving antenna is assumed to have a directional gain pattern, which tends to discriminate against off-axis undesired stations. The receiving antenna pattern for DTV stations is given in section G3.1 of annex G. The receiving antenna pattern for NTSC stations has an attenuation, in dB, of MAX(-6, 20log(cos4(θ))), where θ is the angle between the lines joining the desired and undesired stations to the reception point.
For the transmitting antenna pattern, the gain between 90 degrees above the horizontal and 0.75 degrees below the horizontal is 1.00. The transmitting antenna pattern for DTV stations is provided in section G3.2 of annex G. The transmitting antenna pattern for NTSC stations is provided below in table H9 (tabular form) and figure H1 (graphical form).
| Angle (degrees) | Gain in vertical plane (relative field strength) | ||
|---|---|---|---|
| Low VHF | High VHF | UHF | |
| 0.75 | 1.000 | 1.000 | 1.000 |
| 1.50 | 1.000 | 0.950 | 0.740 |
| 2.00 | 0.990 | 0.860 | 0.520 |
| 2.50 | 0.980 | 0.730 | 0.330 |
| 3.00 | 0.970 | 0.600 | 0.220 |
| 3.50 | 0.950 | 0.470 | 0.170 |
| 4.00 | 0.930 | 0.370 | 0.150 |
| 5.00 | 0.880 | 0.370 | 0.130 |
| 6.00 | 0.820 | 0.370 | 0.110 |
| 7.00 | 0.740 | 0.370 | 0.110 |
| 8.00 | 0.637 | 0.310 | 0.110 |
| 9.00 | 0.570 | 0.220 | 0.110 |
| 10.00 | 0.480 | 0.170 | 0.110 |
Figure H1: NTSC transmitting antenna pattern (elevation)

H2.5.2 Interference calculations
The interference analysis should be based on a terrain-sensitive method. The Longley-Rice propagation model, version 1.2.2, using the appropriate location and time statistics. The area within a station's protected service contour is normally divided into square cells. The coordinates of the census blocks inside each cell are retrieved along with the population of each block. The census blocks should be based on the Statistics Canada 2021 census data (or latest available). From this information, the total population and the coordinates of the cell centroid are determined for each cell. A square cell size of 2 km or less on a side shall be used.
First, the desired field strength is evaluated for each cell within the protected service contour. A radio path between the desired TV transmitter and the population centroid of each cell is examined using the Longley-Rice propagation model applied for the median situations for 50% of locations, 50% of the time at a receiver antenna height of 10 m above ground. The interference analysis retains only those population cells that have been determined to have desired field strength above the threshold for reception given in table H2 of this annex. Radio paths between undesired DTV transmitters and the point representing protected population are examined. For each such radio path, the Longley-Rice propagation model is applied for median situations for 50% of locations, 10% of the time at a receiver antenna height of 10 m above ground. The terrain elevations data used in the analysis should be based on the Canadian Digital Elevation Data (CDED) or Canadian Digital Elevation Model (CDEM). One arc-second data (or highest available resolution) shall be used. A protected population cell being examined is counted as having interference if the ratio of desired-to-undesired input voltage from each interference source is less than the D/U ratios given in section H2.3 of this annex. It should be noted that the comparison is made after applying the discrimination effect of the receiving antenna.
H2.5.3 Calculation of population service loss
The population service loss caused by a new proposal is calculated as:
% Population service loss = \( \frac{A}{B}\) × 100%
Where:
- A = additional unique interference caused by the proposal within the baseline interference-free service population
- B = the undertaking's baseline interference-free service population