
View as PDF (PDF: 3.53 MB; 52 pages)

IP Canada Report 2018
Acknowledgments
Elias Collette, Chief of Economic Research and Strategic Analysis, Canadian Intellectual Property Office
Diego Santilli, Economist, Canadian Intellectual Property Office
Richard Matzinger, Junior Analyst, Canadian Intellectual Property Office
The third report in a series of annual intellectual property (IP) reports that presents current statistics and trends on the use of the intellectual property system in Canada and the global IP system by Canadians.
Message from the CEO
Message from the CEO
It is my pleasure to present the 2018 IP Canada Report.
This report is the third in an annual series that presents current statistics and trends on the use of the intellectual property (IP) system in Canada and the global IP system by Canadians. It also highlights research conducted by the Canadian Intellectual Property Office (CIPO) and partner organizations on a variety of topics, such as patenting by Canadians in the mining sector. CIPO’s analysis of IP trends and statistics helps innovators and policy-makers.
The continuous growth we observe in Canadian filings for IP reflects the importance of intellectual property to business success in Canada and abroad. To address the increasing needs of decision makers and innovators, the Government of Canada continues to modernize our IP system and ensure a strong domestic framework, most recently by launching the first National Intellectual Property Strategy. This commitment, one component of Canada’s Innovation and Skills Plan, provides new tools to assist businesses in unlocking the value of their IP and using it strategically when growing to scale.
In addition, CIPO is working to implement five international IP treaties, which will further harmonize Canada’s IP system with international standards. Canada acceded to the Hague Treaty for industrial designs in November 2018, and will accede to the three trademark treaties in June 2019 and the Patent Law Treaty later in 2019. These undertakings are key components of CIPO’s 5-year Business Strategy which aims to help make Canada a global centre of innovation.
CIPO will continue to deliver on the Government’s commitment to a robust and user-friendly national IP regime, and support these activities with a strong IP analytics and research program that helps innovators and policy makers better understand IP trends and the innovation landscape.
Johanne Bélisle
Commissioner of Patents, Registrar of Trademarks and Chief Executive Officer
About us
About us
The Canadian Intellectual Property Office (CIPO), a Special Operating Agency of Innovation, Science and Economic Development Canada (ISED), is responsible for the administration and processing of intellectual property in Canada. CIPO contributes to Canada's innovation and economic success by providing greater certainty in the marketplace through high-quality and timely IP rights; fostering and supporting invention and creativity through knowledge sharing; raising awareness to encourage innovators to better exploit IP; helping businesses compete globally through international cooperation and the promotion of Canada's IP interests; and administering Canada's IP system and office efficiently and effectively.Footnote 1
Our five-year business strategyFootnote 2:
 Advance innovation
- Harmonize Canada's IP system with international standards to support businesses operating globally
- Strengthen global collaboration to advance Canadian interests
- Modernize Canada's IP framework to support innovation

 Deliver quality and timely IP rights
- Provide IP rights and services that reflect client expectations, market needs and respect the public interest
- Be recognized as a quality-based organization
- Modernize our practices, processes and tools

 Build IP awareness and education
- Deliver an enhanced IP awareness and education program
- Expand our presence and partnerships in innovation-focussed networks and communities

 Offer a modern service experience
- Provide a consistent and client-centric service experience
- Enhance our web presence, promote self-service and improve online transactions
- Improve access to our IP data

 Foster an agile and high-performing organization
- Attract, retain and develop a highly skilled and engaged workforce
- Optimize our work environment and integrate new business and technological solutions
- Strengthen management excellence
Summary
Executive summary
The 2018 IP Canada Report, the third in this annual series, presents trends in intellectual property (IP) usage both in Canada and by Canadians globally. The Canadian Intellectual Property Office (CIPO) informs on IP activity in Canada up to 2017, while international data is available from the World Intellectual Property Organization (WIPO) up to 2016.Footnote 3 This year's report has three sections that describe trends and research relating to patents, trademarks, and industrial designs respectively.
IP activity is growing
The most recent years of data showed growth in application volumes for all three IP rights, both in Canada and by Canadians filing abroad. In 2017, CIPO received applications for 35,022 patents, 58,913 trademarks, and 6,533 industrial designs. Trademark applications showed the strongest annual growth (8%), followed by industrial designs (6%) and patents (1%). The most recent international data shows Canadians filed abroad for 19,913 patents, 16,983 trademarks, and 1,495 industrial designs in 2016. This represented marginal growth for patents over the year, 4% growth for trademarks, and 9% growth for industrial designs.
The long-term trends show strong growth in Canadian trademark and industrial design applications both domestically and abroad, while trends for patent applications are mixed. Trademark applications in Canada grew 29% from 2008 to 2017, followed closely by industrial design with 24%. Internationally, Canadian filings for trademarks and industrial designs have increased even more, with 38% and 35% growth, respectively, between 2007 and 2016. Meanwhile, patent applications in Canada are 17% below their level in 2008, mainly due to drops in non-resident filings in 2009–2010. Canadian filings for patents abroad show a 13% increase from 2007 to 2016, but with no appreciable growth since 2012.
Canadians lead world trends in some technology fields
This report features current research from two projects at CIPO: the first analyzes trends in patenting across different technology fields while the second forecasts use of the Madrid Protocol for trademark applicants in Canada.Footnote 4 The first research project highlights differences in patenting trends across technology fields, showing that non-resident filings in the Chemistry area fell 17% between 2000 and 2014; mainly due to declines in the fields of Pharmaceuticals, and Organic Fine Chemistry after 2006. However, non-resident patenting showed similar growth to world trends in the fields of Environmental Technology, Transport, and Civil Engineering from 2009 to 2014. Similarly, trends for domestic and international activity show that Canadians have kept pace or outperformed world trends in the fields of Digital Communication, Medical Technology, Food Chemistry, Transport, and Civil Engineering during the years 2009 to 2014.
Canada's accession to the Madrid Protocol will facilitate trademark applications
Research on the use of the Madrid system shows that in 8–10 years following implementation, 25% of Canadians filing trademark applications abroad and 35% of applications filed in Canada by non-residents will choose this route. As well, Canadians are likely to designate on average about four jurisdictions per international application in about ten years' time.
CIPO partners with international organizations to produce leading-edge research
This report also highlights recent research from partnerships between CIPO and other organizations. CIPO contributed IP analytics findings to a collaborative project with WIPO and the Centre for International Governance Innovation (CIGI) looking at Canadian patenting in the mining sector. This research shows that Canadians are patenting more in the areas of Exploration, Processing, and Refining. It also shows that a large number of firms in Calgary and Edmonton have patents related to exploration, while firms located in Toronto, Vancouver and Montreal have patents in a variety of areas in the mining sector. Another research project conducted in partnership with the Organisation for Economic Co-operation and Development (OECD) has provided new insights regarding the IP activities of Canadian firms. One of the main findings from this study is that different categories of industrial designs feature much more prominently in the IP bundles of foreign applicants in Canada than Canadian applicants.
Intro
Introduction
The IP Canada Report is an annual publication that presents the most up-to-date statistics and trends in Canadian IP usage by Canadians and in Canada. The IP data in this report come from two main sources: WIPO for years up to 2016 and CIPO for the 2017 data related to activity in Canada.Footnote 5 This year's report has three separate sections, each devoted to a specific type of IP right. The first section describes trends in patent activity, both in Canada and abroad by Canadians. The following two sections describe trademark and industrial design activities in a similar way. Each section also features related research, either conducted at CIPO or in partnership with academics or research institutions.
There are several other forms of IP in Canada that are not covered in this report. Copyrights are also administered by CIPO; however, internal data do not provide a complete picture of its usage since copyrights do not need to be registered to be legally effective. Integrated circuit topographies, which are covered under a separate process at CIPO, refer to three dimensional configurations of electronic circuits embodied in integrated circuit products or layout designs. Plant breeders' rights protect new varieties of plants and are administered by the Canadian Food Inspection Agency.
The importance of IP in the modern economy cannot be understated. According to a recent report published by WIPO, intangible capital accounts for about 30% of the value of today's manufactured goods, almost twice the value of tangible capital.Footnote 6 IP rights foster the creation of intangible capital, embodied through the elements of technology, branding and design. Patents incentivize new technologies by giving innovators control over an invention's usage and by publishing rich technical information for the public. Trademarks provide brand owners with a way to distinguish their goods and services in the marketplace and profit from their good reputation. Industrial designs protect a product's aesthetic features, which are becoming increasingly valued by consumers.
Long-term trends show that international filings by Canadians have increased significantly faster than domestic filings, reflecting the growing importance of foreign markets to businesses in Canada. Consequently, CIPO has dedicated considerable efforts in recent years towards the implementation of five key international IP treaties that will harmonize Canada's IP system with international standards. These treaties will help Canadian businesses looking to enter or expand their presence in international markets by providing a faster, simpler, and more cost-effective way to protect their IP in multiple countries.Footnote 7
Research conducted at CIPO builds a stronger evidence base to support operational and policy decision making, and ultimately innovation and competitiveness. This report features an analysis of patenting trends in different technology fields, forecasting the use of the Madrid Protocol by Canadian trademark filers, and work by the OECD highlighting differences in filing trends of industrial designs in Canada by residents and non-residents. Also included are highlights of research conducted with partner organizations which looks at Canadian patenting in the mining sector.
Patents
Patents
Patents provide a time-limited, legally protected, exclusive right to make, use, and sell an invention. In this way, patents provide a means to profit from new inventions while revealing detailed technical knowledge to the public, both of which help promote innovation in the economy. CIPO received 35,022 patent applications in 2017, representing a modest increase from the previous year. CIPO's resident share remained stable at around 12%, with 4,053 applications coming from Canadian residents and 30,969 from non-residents. While patent applications in Canada have declined 17% since 2008, filings abroad by Canadians increased 13% from 2007 to 2016.
Patent applications
Patent applications filed in Canada
CIPO received 35,022 patent applications in 2017. Figure 1 shows the top six countries of origin filing in Canada, one of which is Canada. Businesses and inventors from the United States filed the largest number of patent applications in 2017 (16,363), making up 47% of the total share. Canadian residents ranked second with 4,053 filings while other countries followed respectively: Germany (2,083), Japan (1,854), France (1,612), and Switzerland (1,225). Applications from the United States and Germany grew by 1% and 3% respectively, while applications dropped modestly from Canada (-1%), Japan (-1%), Switzerland (-2%), and moderately from France (-5%). Excluding Canada, the other five countries accounted for 75% of non-resident filings and 66% of total filings in Canada.

Figure 1 - Text version
| Country of origin | # of Patents | Share of total | Year over year % change |
|---|---|---|---|
| United States | 16,363 | 47% | 1% |
| Canada | 4,053 | 12% | -1% |
| Germany | 2,083 | 6% | 3% |
| Japan | 1,854 | 5% | -1% |
| France | 1,612 | 5% | -5% |
| Switzerland | 1,225 | 3% | -2% |
Figure 2 shows annual levels of patent applications in Canada from 2008 to 2017, for residents and non-residents. CIPO received 35,022 applications in 2017, 4,053 from Canadian residents and 30,969 from non-residents. Resident filings fell marginally in 2017, while non-resident filings grew by about 1%. Overall, total applications were down 17% between 2008 and 2017, explained by a 16% decline in non-resident filings and a 20% decline in resident filings. The main declines in non-resident filings were seen in 2009 and 2010, while resident filings saw the largest drops in the years 2010 and 2014.

Figure 2 - Text version
| Year | Resident | Non-resident | Total |
|---|---|---|---|
| 2008 | 5,061 | 37,028 | 42,089 |
| 2009 | 5,067 | 32,410 | 37,477 |
| 2010 | 4,550 | 30,899 | 35,449 |
| 2011 | 4,754 | 30,357 | 35,111 |
| 2012 | 4,709 | 30,533 | 35,242 |
| 2013 | 4,567 | 30,174 | 34,741 |
| 2014 | 4,198 | 31,283 | 35,481 |
| 2015 | 4,277 | 32,687 | 36,964 |
| 2016 | 4,078 | 30,667 | 34,745 |
| 2017 | 4,053 | 30,969 | 35,022 |
Applications in Canada are either filed directly to the office or through the Patent Cooperation Treaty (PCT), an international agreement that allows applicants to apply to multiple signatory countries using a single application.Footnote 8 Figure 3 shows trends in patent applications in Canada by filing route from 2008 to 2017. CIPO received 7,672 direct applications in 2017 and 27,350 applications through the PCT. PCT filings accounted for 78% of filings in 2017, a share that has fluctuated between 75% and 80% since 2008.

Figure 3 - Text version
| Year | Direct | PCT | Total |
|---|---|---|---|
| 2008 | 10,114 | 31,975 | 42,089 |
| 2009 | 9,308 | 28,169 | 37,477 |
| 2010 | 7,989 | 27,460 | 35,449 |
| 2011 | 8,352 | 26,759 | 35,111 |
| 2012 | 8,338 | 26,904 | 35,242 |
| 2013 | 8,114 | 26,627 | 34,741 |
| 2014 | 8,030 | 27,451 | 35,481 |
| 2015 | 7,571 | 29,393 | 36,964 |
| 2016 | 7,724 | 27,021 | 34,745 |
| 2017 | 7,672 | 27,350 | 35,022 |
Patent applications filed abroad by Canadians
Obtaining patent protection abroad allows Canadians to prevent competitors from making use of their inventions in other countries. These rights are important to Canadian businesses looking to protect and expand their markets. In contrast to the decline in domestic patenting, Canadian filings abroad have grown steadily over the last decade. Canadians filed internationally for patents almost five times as often as they did domestically in 2016, compared with 3.5 times as often in 2007.
In 2016, the United States, the European Patent Office (EPO), and China continued to be the top three international destinations for Canadian filings, as seen in Figure 4. Together these three offices accounted for over 80% of international patent applications by Canadians. The United States is the primary market for many export businesses in Canada, which explains why Canadians file so many more patents there than at other IP offices.

Figure 4 - Text version
| Destination | Canadian Patent Applications | Share of all canadian international patent applications |
|---|---|---|
| United States | 13,493 | 68% |
| European Patent Office | 1,576 | 8% |
| China | 985 | 5% |
Figure 5 shows Canadian applications abroad by filing route from 2007 to 2016. Canadians filed abroad for 19,913 patents in 2016, with 7,460 filings made through the PCT and 12,453 filed directly. Total international filings grew 13% from 2007 to 2016, with 4% growth in direct filings and an impressive 31% in PCT filings.

Figure 5 - Text version
| Route | 2007 | 2008 | 2009 | 2010 | 2011 | 2012 | 2013 | 2014 | 2015 | 2016 |
|---|---|---|---|---|---|---|---|---|---|---|
| Direct | 11,956 | 11,551 | 11,094 | 12,880 | 12,903 | 14,255 | 13,706 | 12,461 | 12,426 | 12,453 |
| PCT | 5,694 | 5,475 | 5,732 | 6,514 | 7,057 | 7,288 | 7,313 | 7,365 | 7,463 | 7,460 |
| Total | 17,650 | 17,026 | 16,826 | 19,394 | 19,960 | 21,543 | 21,019 | 19,826 | 19,889 | 19,913 |
Patent analysis by technology field
The purpose of this section is to shed further light on patenting by identifying technology fields where patenting activity in Canada and by Canadians differs from global trends.
This study uses data on patent publications between 2000 and 2014, available from the WIPO IP Statistics Data Center.Footnote 9 Patent publications are documents that IP offices publish during the examination process, typically 18 months after an application is filed.Footnote 10 Although there is no strict correlation with patent applications, data on publications contain information about technology fields, which is the key variable for this analysis.
Patenting in Canada by non-residents experienced a decline followed by a period of stagnation, while patenting by Canadians has grown; the decline in non-resident patenting since the economic crisis around 2008 is noteworthy, as shown in Figure 6. In this section of the report, patenting in Canada describes resident and non-resident activity, while patenting by Canadians describes both domestic and international activity together. In order to better understand these trends, most of the analysis in this section describes growth trends rather than absolute numbers.

Figure 6 - Text version
| 2000 | 2001 | 2002 | 2003 | 2004 | 2005 | 2006 | 2007 | 2008 | 2009 | 2010 | 2011 | 2012 | 2013 | 2014 | |
|---|---|---|---|---|---|---|---|---|---|---|---|---|---|---|---|
| Non-resident | 37,267 | 37,740 | 34,269 | 36,420 | 34,984 | 37,045 | 38,318 | 37,266 | 33,568 | 32,007 | 31,204 | 30,937 | 30,698 | 31,138 | 34,400 |
| Canadian | 7,594 | 8,937 | 11,620 | 11,486 | 12,319 | 12,607 | 12,701 | 13,431 | 14,859 | 14,293 | 14,418 | 15,495 | 16,552 | 16,440 | 15,595 |
China's influence on global patenting trends
Figure 7 contrasts total patenting in all technology fields for non-residents filings in Canada, filings by Canadians (in Canada and abroad), and world trends. After a period of stagnation, non-resident patenting started to decrease in 2007, becoming more stable after the 2008 crisis. Finally, after a few years of stagnation, in 2014 it showed a signal of what could be a recovery towards positive growth rates. As for patenting by Canadians, it grew much closer to what is observed globally, until 2011.
The IP community has paid attention to the growing presence of China in global IP trends.Footnote 11 The result of subtracting Chinese patenting from the worldwide trend is expressed by the dashed line. A first look at the solid and dashed blue lines shows how the increasing weight of Chinese patenting turned into positive growth what otherwise would have been a seemingly stagnant period between 2005 and 2011. Similarly, as the 2008 crisis affected mainly the Western economies, the negative impact on global patenting is balanced out if Chinese activity is included. China represented 29% of global patenting in 2014, compared to 1% in 2000.
China has a significant weight on the global patenting trends
Knowing that the global trend has been increasingly affected by Chinese patenting, most of which is domestic,Footnote 12 it is worth mentioning that if such incidence was not taken into account then Canadian and global trends would seem to have moved more closely, as Figure 7 suggests. In fact, immediately after the crisis, patents by Canadians grew at a rate steeper than the global trend.

Figure 7 - Text version
| 2000 | 2001 | 2002 | 2003 | 2004 | 2005 | 2006 | 2007 | 2008 | 2009 | 2010 | 2011 | 2012 | 2013 | 2014 | |
|---|---|---|---|---|---|---|---|---|---|---|---|---|---|---|---|
| Non-residents | 100 | 101 | 92 | 98 | 94 | 99 | 103 | 100 | 90 | 86 | 84 | 83 | 82 | 84 | 92 |
| Canadians | 100 | 115 | 134 | 134 | 141 | 141 | 145 | 149 | 162 | 151 | 150 | 163 | 169 | 168 | 160 |
| World | 100 | 109 | 122 | 122 | 132 | 139 | 142 | 145 | 148 | 149 | 148 | 151 | 171 | 184 | 201 |
| World excluding China | 100 | 108 | 121 | 121 | 129 | 134 | 136 | 136 | 136 | 135 | 130 | 129 | 135 | 140 | 145 |
The trends above conceal the specifics related to patterns in different technologies. Consequently, the following analysis splits the data into five technology groups and their respective subfields; WIPO lists these groups as Electrical Engineering, Instruments, Chemistry, Mechanical Engineering, and Other Fields.Footnote 13 The rest of the analysis concentrates on the post-recession period between 2009 and 2014.
Non-resident patenting trends
When comparing levels of patenting by non-residents in Canada across the five technology groups, important differences arise. Perhaps the most outstanding trend is that of Chemistry, the group with the highest share of non-resident patenting, as seen in Figure 8. In 2000, 39% of Canada's non-resident activity belonged to this group, dropping to 35% in 2014. This group experienced a 17% drop in patenting between 2000 and 2014. There were more than 3,000 fewer Chemistry patents in 2014 than in 2006. The Pharmaceuticals and Organic Fine Chemistry fields together accounted for the majority of this drop, with approximately 1,300 and 1,000 fewer patents respectively. Pharmaceuticals alone has accounted for the largest share in the Chemistry group, peaking at 30% in 2006 and decreasing since then to 26%. Such a drop may be explained by a trend of new drug discovery moving away from chemical entities to biologics; the new drug pipeline for synthetic chemical molecules has decreased significantly in recent years.

Figure 8 - Text version
| Group | Technology area | 2000 | 2001 | 2002 | 2003 | 2004 | 2005 | 2006 | 2007 | 2008 | 2009 | 2010 | 2011 | 2012 | 2013 | 2014 |
|---|---|---|---|---|---|---|---|---|---|---|---|---|---|---|---|---|
| 1 | Electrical engineering | 7,121 | 7,409 | 6,009 | 6,231 | 5,768 | 6,416 | 6,655 | 6,144 | 5,743 | 5,390 | 5,217 | 5,262 | 5,207 | 5,235 | 5,804 |
| 2 | Instruments | 5,828 | 5,996 | 5,760 | 5,954 | 5,779 | 6,006 | 6,336 | 6,400 | 5,452 | 5,286 | 5,245 | 5,154 | 5,239 | 5,135 | 5,872 |
| 3 | Chemistry | 14,591 | 14,537 | 13,428 | 14,384 | 13,705 | 14,616 | 15,048 | 14,667 | 12,982 | 12,392 | 12,058 | 11,502 | 10,981 | 11,105 | 12,126 |
| 4 | Mechanical engineering | 6,981 | 6,981 | 6,526 | 7,022 | 6,647 | 7,013 | 7,003 | 6,931 | 6,357 | 6,087 | 5,941 | 6,058 | 6,205 | 6,517 | 6,942 |
| 5 | Other fields | 2,736 | 2,803 | 2,535 | 2,819 | 3,076 | 2,983 | 3,257 | 3,120 | 3,027 | 2,846 | 2,736 | 2,950 | 3,054 | 3,136 | 3,628 |
The performance of non-resident publications is heavily affected by the Chemistry group
As explained, the overall decline in non-resident patenting in Canada driven by fields such as Pharmaceuticals is masking other fields whose trends have a positive pattern. That is the case for Environmental Technology, shown in Figure 9.Footnote 14 Although not so important in absolute numbers, this and other fields did show signs of recovery after the 2008 recession, suggesting that Canada is growing as a receptive market for innovation.

Figure 9 - Text version
| 2009 | 2010 | 2011 | 2012 | 2013 | 2014 | |
|---|---|---|---|---|---|---|
| Non-residents | 100 | 119 | 124 | 125 | 116 | 127 |
| World | 100 | 106 | 110 | 131 | 139 | 151 |
Canadian patenting trends by technology field
This section highlights certain technology fields within the five groups where Canadians have performed well compared to non-residents and the world since the 2008 recession. Figures 10 to 14 show trends in patenting for select technology fields where Canadians have followed or outpaced the world trend between 2009 and 2014. For each of the following figures, it is important to focus on the slopes of each line segment, which show annual growth, rather than the gaps between them. A trend line may fall below another because of less growth in previous years, but show similar or stronger growth in subsequent years.
Group 1 – Electrical Engineering: Patenting in the digital Communication field by Canadians outpaced the global trend until 2013, after which it declined, as Figure 10 illustrates.Footnote 15 Likely, the Canadian trend has been affected by large Canadian companies patenting in this industry.

Figure 10 - Text version
| 2009 | 2010 | 2011 | 2012 | 2013 | 2014 | |
|---|---|---|---|---|---|---|
| Non-residents | 100 | 75 | 72 | 67 | 78 | 86 |
| Canadians | 100 | 127 | 151 | 165 | 155 | 123 |
| World | 100 | 106 | 112 | 125 | 138 | 159 |
Group 2 – Instruments: Within this group, the Medical Technology field represented 38% of Canadian patenting activity.Footnote 16 Despite the effects of the 2008 crisis, Canadian patenting followed very closely the long-run upward world trend, as Figure 11 suggests.

Figure 11 - Text version
| 2009 | 2010 | 2011 | 2012 | 2013 | 2014 | |
|---|---|---|---|---|---|---|
| Non-residents | 100 | 102 | 99 | 99 | 91 | 107 |
| Canadians | 100 | 100 | 107 | 106 | 117 | 126 |
| World | 100 | 100 | 102 | 113 | 120 | 134 |
Group 3 – Chemistry: The long-run trend for the Chemistry group has been nearly stagnant since the end of the 2008 crisis. A closer look by field reveals that within this group, the Food Chemistry field has been showing some degree of strength, with a long-run trend that follows closely that of global patenting.Footnote 17

Figure 12 - Text version
| 2009 | 2010 | 2011 | 2012 | 2013 | 2014 | |
|---|---|---|---|---|---|---|
| Non-Residents | 100 | 110 | 112 | 108 | 104 | 106 |
| Canadians | 100 | 112 | 123 | 138 | 124 | 164 |
| World | 100 | 103 | 114 | 129 | 155 | 211 |
Group 4 – Mechanical Engineering: Similar to Chemistry, the Mechanical Engineering group shows a long-run stagnant growth rate for Canadians. With nearly a 20% share coming from Transport,Footnote 18 patenting in this technology field follows a similar trend to the rest of the world. Non-resident activity tracked the world trend even more closely during this period.

Figure 13 - Text version
| 2009 | 2010 | 2011 | 2012 | 2013 | 2014 | |
|---|---|---|---|---|---|---|
| Non-Residents | 100 | 94 | 95 | 109 | 124 | 129 |
| Canadians | 100 | 90 | 106 | 102 | 109 | 120 |
| World | 100 | 95 | 94 | 112 | 126 | 137 |
Group 5 – Other Fields: Although small in absolute numbers, the share of this group in Canadian patenting has increased steadily from 7% in 2000 to 11% in 2014. Further analysis reveals that Canadians showed strength in the Civil Engineering technology field,Footnote 19 displaying similar growth rates to the world trend. Non-resident activity in this area was also strong.

Figure 14 - Text version
| 2009 | 2010 | 2011 | 2012 | 2013 | 2014 | |
|---|---|---|---|---|---|---|
| Non-Residents | 100 | 94 | 95 | 109 | 124 | 129 |
| Canadians | 100 | 90 | 106 | 102 | 109 | 120 |
| World | 100 | 95 | 94 | 112 | 126 | 137 |
Takeaways
The purpose of this section was to highlight differences in patenting across different technology fields and assess Canada as both a recipient and a producer of innovation. This section highlights how the global trends are increasingly influenced by domestic patenting in China, and how Canadian patenting in some fields may be heavily weighted by key players.
The analysis suggests that the long-run decrease observed in non-resident patenting in Canada is mostly explained by a decline in the Chemicals technology group. This decline was heavily weighted by the decrease in patenting in the Pharmaceuticals and Organic Fine Chemistry fields, and masked the increased patenting seen in the Environmental Technology field.
With respect to Canada as a source of innovation, Canadians have been following the global trend. The analysis indicates that in fields such as Digital Communication, Medical Technology, Food Chemistry, Transport, and Civil Engineering, Canadians tracked and at times outpaced the global trend between 2009 and 2014.
Drilling into patent data to explore Canadian innovation in the mining sector
This section highlights several findings from an upcoming IP Analytics study on Canadian patenting in the mining sector which CIPO conducted in collaboration with both WIPO and CIGI. The study will be featured as a chapter in the upcoming book: "Global Challenges for Innovation and IP in the Mining Industries" that WIPO will publish in 2019.
Canada's contribution to this international mining study is important given the significance of the mining sector to the Canadian economy and its importance on the global stage. Canada is one of the largest mining nations in the world, ranking among the top five countries in the global production of 13 major minerals.Footnote 20 In 2015, the Canadian mining sector accounted for $56 billion of Canada's Gross Domestic Product, including 19% of the value of Canadian goods exports.Footnote 21
Despite the economic strength of this sector, R&D, innovation, and commercialization remain challenges for the Canadian mining sector. With increasing environmental standards and regulations, companies operating in this sector are continually searching for technological solutions to advance sustainable mining. Patent data is an excellent starting point for understanding these innovative efforts since patent documents reveal specific technical knowledge regarding new inventions. Patent documents also allow innovators to observe who is patenting, which can help to identify opportunities for collaboration while avoiding costly duplicative research.
Between 1990 and 2014, Canadian patenting in the mining industry increased 159%. Figure 15 describes patenting activity using a landscape map that highlights technologies associated with specific subsectors of activity. These maps are meant to provide multiple layers of information, but the key takeaway is that Canadians file for patents mainly in the areas of Exploration, Refining and Processing. The highest concentration of patents in this Canadian dataset relates to technologies with keywords such as "Drill, Involve, String", "Pipe, Drill, Rig", "Data, Computer, Involve", "Mandrel, House, Rotation", "Tubular, Wall, Wellbore", "Solution, Ion, Remove", "Leach, Copper, Contain", and "Port, Valve, Flow".

Figure 15 - Text version
Figure 15 is a patent landscape map that provides a visual representation of patented inventions applied for by Canadians around the world in Mining technology fields between 1990 and 2014. Thomson Innovation's ThemeScape mapping tool was utilized to produce this visualization, using term frequency (keywords from a patent title and abstract) and other algorithms to cluster documents based on shared language. The result is a patent landscape map, a map very much resembling that of a topographic map, where there are sections of land and water. Land sections are comprised of peaks, some of which have 'snow-capped peaks,' representing the highest concentration of patents and are labelled with key terms that tie common themes together. Water is used to separate terms where there is no commonality between them.
Processing is found in the upper left-hand side of the map highlighted in yellow and is associated with keywords such as "Tank", "Solid", "Separate", "Tail", "Oil", "Sand", "Slurry", "Solid", and "Vessel". Refining is found in the upper right-hand side of the map and is associated with keywords such as "Metal", "Molten", "Alloy", "Ore", "Iron", "Carbon", "Slag", "Oxide", "Contain", "Solution", "Ion", "Remove", "Leach", "Copper", "Contain". Exploration is found in all the areas of the map and is associated with keywords such as "Drill", "Oil", "Sand", "Pump", "Power", "Motor", "Formation", "Fracture", "Involve", "Determine", "Involve", "Sample", "Tube", "Coil", "Coil tube", "Drill", "Involve", "String", "Pipe", "Drill","Rig", "Data", "Computer", "Involve", "Vehicle", "Mine", "Steer", "Signal", "Transmit", "Drill", "Steam", "Oil", "Involve", "Rock", "Hole", "Mine", "Tubular", "Wall", "Wellbore", "Port", "Valve", "Flow", "Mandrel", "House", "Drill", "Motor", "Wellbore", "Tool", "Seal", "String", "Tube", "Welbore", "String", "Drill", "Drill string", "Bite", "Drill" and "Bit".
Broad theme are written in capital letters across the top of peaks and include the following terms:
- Separated Solid
- Oil Sand Tail
- Program
- Sensory Array
- Coiled Tube Injector
- Grip
- Drive Means
- Hydrocarbon Reservoir
- Valve Body
- Ported
- Ream
- Leach
- Molten Metal
The general key words found in this patent landscape map include the following:
- Tank
- Solid
- Separate
- Tail
- Oil
- Sand
- Slurry
- Solid
- Vessel
- Metal
- Molten
- Alloy
- Ore
- Iron
- Carbon
- Slag
- Oxide
- Contain
- Solution
- Ion
- Remove
- Leach
- Copper
- Furnace
- Signal
- Power
- Signal
- Transmit
- Drill
- Data
- Computer
- Involve
- Vehicle
- Mine
- Steer
- Determine
- Involve
- Sample
- Oil
- Sand
- Pump
- Power
- Motor
- Formation
- Fracture
- Involve
- Tube
- Coil
- Coil tube
- Pipe
- Rig
- Bolt
- Rock
- Hole
- Tubular
- Wall
- Wellbore
- Steam
- Oil
- Involve
- Mandrel
- House
- Rotation
- Port
- Valve
- Flow
- Wellbore
- Tool
- Seal
- String
- Wellbore
- Drill string
- Bite
- Bit
Figure 16 is a map of Canada showing the location of companies patenting in various mining subsectors and the intensity of patenting in each province. Provinces with higher levels of patenting are shaded in darker blue, while the red, orange, and yellow circles show the location of companies with patents in the Exploration, Refining, and Mining subsectors respectively. The purple circles denote clusters of companies with patent portfolios that are diversified amongst different subsectors and the gray dots are individual companies holding mining patents. Calgary has the largest cluster in Canada, with 368 companies with patents mainly in the area of exploration. Edmonton has the second largest cluster with 127 companies with patents also relating to exploration activities. These two clusters reflect the high degree of oil and gas activity in the province of Alberta. Other cities with large clusters include Toronto (123 companies), Vancouver (86 companies) and Montreal (71 companies). The fact that these clusters are major hubs of innovative activity is no surprise given that some of the largest international and Canadian mining companies are headquartered or have a significant presence in these cities. There are many benefits for firms in the same industry to cluster together, including increased productivity, faster innovation through collaborative research, and the creation of small businesses to cater to the niche needs of the industry.

Figure 16 - Text version
Figure 16 is a geographic map of Canada. Overlaid on this map is the location of the 12 business clusters, comprised of 10 or more companies, identified by circles. Individual companies outside of the clusters are identified by the red dots overlaid on the map. The provinces have been color coded in different shades of blue, with provinces that have higher patent levels being darker. Alberta has the darkest shade of blue, Ontario and Quebec the second darkest shade of blue, British Columbia has the third darkest share of blue and Saskatchewan, Manitoba, Prince Edward Islands, Nova Scotia and Newfoundland and Labrador have the lightest shade of blue.
The clusters identified by circles have different colors depending on their specialization fields. Red represents exploration, orange represents refining, yellow represents mining and purple represents diversified.
| Cluster | Specialization | Compagnies |
|---|---|---|
| Calgary, Alberta | Exploration | 368 |
| Edmonton, Alberta | Exploration | 127 |
| Halifax, Nova Scotia | Diversified | 10 |
| Hamilton, Ontario | Refining | 12 |
| Kitchener, Cambridge, Waterloo, Ontario | Diversified | 10 |
| Montreal,Quebec | Diversified | 71 |
| Ottawa, Ontario | Diversified | 25 |
| Québec, Québec | Diversified | 13 |
| Saskatoon, Saskatchewan | Mining | 11 |
| Sudbury, Ontario | Mining | 20 |
| Toronto, Ontario | Diversified | 123 |
| Vancouver, British Columbia | Diversified | 86 |
These results are only a few examples of the value obtained from examining patent data to better understand innovation in the mining industry. The full chapter titled "Drilling into Patent Data to Explore Canadian Innovation in the Mining Sector" will include an overview of the latest developments around promoting innovation in the sector based on qualitative interviews, as well as a range of visualizations to present the patent landscape in the Canadian mining sector.
Conclusion
Trends in patent activities are important indicators for assessing innovation in and across economies. Patent activity in Canada grew modestly (1%) in 2017, while international activity by Canadians grew marginally. Domestic activity has yet to recover from the drop seen in 2009–2010. Declines in non-resident filings during those years account for the majority of the discrepancy in total filings between 2008 and 2017. Resident filings are also 20% below 2008 levels, but these declines occurred mainly in 2010 and 2014. Canadian filings abroad grew 13% from 2007 to 2016, but stagnated in the last two years of data. Research using data on patent publications by technology field shows Canadian patenting tracked or outpaced the world trends in different technology fields such as Digital Communication, Medical Technology, Food Chemistry, Transport, and Civil Engineering.
Trademarks
Trademarks
A trademark is used by an individual or organization to distinguish its goods and services from those of others in the marketplace. Trademarks can consist of words, sounds, designs, or a combination of these.Footnote 22 CIPO received 58,913 trademark applications in 2017, of which 25,853 were from Canadian residents and 33,060 from non-residents. Trademark applications filed in Canada have grown steadily over the past ten years, reflecting the importance of brand reputation and differentiation in the Canadian marketplace. CIPO forecasts that ten years after Canada accedes to the Madrid Protocol, 35% of non-resident applications will use the Madrid system, as will 25% of Canadian applications filed abroad.
Trademark applications
Trademark applications filed in Canada
Figure 17 shows the top six countries of origin for trademarks filed in Canada in 2017. Canada took the top rank with 25,853 applications, followed by the United States (17,107); combined, they represented the majority share of over 70% of total filings. China (2,175), the United Kingdom (1,681), Germany (1,597), and France (1,398) followed, respectively. The largest growth has been with filings from China, with a 50% increase in 2017.

Figure 17 - Text version
| Country of origin | # of Trademarks | Share of total | Year over year % change |
|---|---|---|---|
| Canada | 25,853 | 44% | 9% |
| United States | 17,107 | 29% | 3% |
| China | 2,175 | 4% | 50% |
| United Kingdom | 1,681 | 3% | 1% |
| Germany | 1,597 | 3% | -4% |
| France | 1,398 | 2% | 1% |
Trademark filings in Canada by residency are presented in Figure 18. CIPO received 58,913 trademark applications in 2017, of which 33,060 were from non-residents. Total filings grew 8% in 2017, with 9% growth in resident filings and 7% growth in non-resident filings. Both resident and non-resident filings saw 29% growth since 2008, with the resident share of total filings remaining stable at around 44%.

Figure 18 - Text version
| Year | Resident | Non-resident | Total |
|---|---|---|---|
| 2008 | 20,040 | 25,579 | 45,619 |
| 2009 | 18,663 | 22,293 | 40,956 |
| 2010 | 20,449 | 24,771 | 45,220 |
| 2011 | 21,337 | 27,135 | 48,472 |
| 2012 | 21,741 | 28,369 | 50,110 |
| 2013 | 21,449 | 28,370 | 49,819 |
| 2014 | 21,348 | 29,680 | 51,028 |
| 2015 | 22,589 | 29,872 | 52,461 |
| 2016 | 23,652 | 31,013 | 54,665 |
| 2017 | 25,853 | 33,060 | 58,913 |
Trademarks applications filed abroad by canadians
International trademark filings by Canadians have also seen sustained growth in recent years. Figure 19 shows the top destinations for Canadian trademark applicants in 2016. Canadians filed for 7,889 trademarks in the United States, 2,830 in China,Footnote 23 and 1,222 at the European Union Intellectual Property Office (EUIPO). While the United States accounted for the largest share of international filings by Canadians (46%), China and the EUIPO have seen substantial increases in filings by Canadians between 2007 and 2016, with 147% and 42% respectively.

Figure 19 - Text version
| Destination | Canadian Trademark Applications | Share of all canadian international trademark applications |
|---|---|---|
| United States | 7,889 | 46% |
| China | 2,830 | 17% |
| European Union Intellectual Property Office | 1,222 | 7% |
International trademark filings by Canadians in other jurisdictions are presented in Figure 20 for the period between 2007 and 2016. Filings by Canadians have grown consistently each year since the 2008–2009 financial crisis, save for a small decline in 2012. Total filings grew 4% in 2016 to 16,983 and have grown by 38% since 2007.

Figure 20 - Text version
| Year | Volume | Growth (right axis) |
|---|---|---|
| 2007 | 12,294 | 12% |
| 2008 | 11,963 | -3% |
| 2009 | 10,057 | -16% |
| 2010 | 11,959 | 19% |
| 2011 | 13,227 | 11% |
| 2012 | 12,863 | -3% |
| 2013 | 13,781 | 7% |
| 2014 | 14,801 | 7% |
| 2015 | 16,316 | 10% |
| 2016 | 16,983 | 4% |
Forecasting the use of the Madrid system among Canadian applicants: the Madrid Multiplier
The Madrid Protocol is a multilateral agreement administered by WIPO designed to facilitate the filing of trademarks between signatory countries. It is meant to reduce the administrative costs and efforts associated with filing a trademark in several countries. Applicants can opt to seek trademark protection in multiple jurisdictions via the Madrid system, by way of a single application.
Once the amended Trademarks Act comes into force, Canada will become a member of the Madrid Protocol,Footnote 24 joining its most important trade partners, including the United States.
The filing trends observed in other jurisdictions having joined the Madrid system indicate that the share of applications using this route grows initially, and subsequently stabilizes. The time taken to achieve a stable proportion and the level of such proportion varies across countries. CIPO has conducted a multivariate analysis to be able to predict the proportion for both non-residents designating Canada, and residents filing abroad using Canada as its Office of Origin. Figure 21 shows that the Madrid proportion of filings should stabilize 8–10 years following accession, with over 35% of non-resident filings in Canada, and approximately 25% of applications from Canadians filing abroad via the Madrid system.

Figure 21 - Text version
| Years after implementation | Non-resident filings | Canadian filings abroad |
|---|---|---|
| 1 | 12% | 2% |
| 2 | 17% | 7% |
| 3 | 21% | 12% |
| 4 | 25% | 16% |
| 5 | 29% | 19% |
| 6 | 31% | 22% |
| 7 | 34% | 23% |
| 8 | 35% | 25% |
| 9 | 36% | 25% |
| 10 | 37% | 24% |
| 11 | 37% | 24% |
The implementation of the Madrid Protocol will result in a shift in CIPO's operations. As shown by Figure 22, if Canada is chosen as the Office of Origin, a single international application for a number of designations abroad will be presented at CIPO; after certifying the application, CIPO will send it to WIPO for processing. CIPO has designed the concept of the Madrid Multiplier, a ratio of the total number of designations abroad via the Madrid system from a given Office of Origin, to the total number of international applications made in that same Office of Origin via the Madrid system. A higher value indicates that, on average, applicants of a given country are seeking protection in a larger number of designated jurisdictions.

Figure 22 - Text version
Figure 22 shows a building, representing CIPO with an arrow on the right side, pointing to another building, representing WIPO. On the right side of the building representing
This figure illustrates CIPO's concept of the Madrid multiplier by showing how an application in Canada is "multiplied" to become several applications, each for a selected office. A single application is filed at CIPO, which CIPO then forwards to WIPO. Applications are then sent to the destinations selected by the applicant in Canada. The ratio of the total number of Canadian applications sent to destination offices by WIPO, divided by the total number of Madrid applications at CIPO gives the Marid multiplier For example, a Madrid multiplier of 4 means that on average, one Canadian filing through Madrid becomes four filings, each going to a separate destination.
Existing data suggest that the multiplier decreases over time before achieving a stable level. This may indicate that once applicants are aware of the existence of the Madrid system in a particular jurisdiction, they initially overuse it by filing for countries where protection may not be necessary for them.
Initial findings from research carried out at CIPO suggest that the Madrid Multiplier is inversely correlated with market diversification. As described earlier in Figure 19, the United States, which constitutes the primary international destination for Canada, received 46% of trademark applications filed abroad by Canadian residents. If China and the EUIPO are considered, these three jurisdictions account for 70% of applications abroad. Due to this high market concentration, CIPO predicts that Canada is less likely to display a high Madrid Multiplier; in other words, Canadian residents are likely to designate fewer offices than what is observed in other jurisdictions. CIPO’s predictions for the first ten years following the implementation of the Madrid Protocol in Canada are shown in Figure 23. The results of initial studies suggest that after 10 years, Canadian residents seeking trademark protection in foreign jurisdictions will, on average, apply for protection in four countries per international application. The notable difference between Canada and Japan comes precisely from the high market diversification of that country. Australia, on the other hand, has a level of market diversification closer to Canada’s.

Figure 23 - Text version
| 1 | 2 | 3 | 4 | 5 | 6 | 7 | 8 | 9 | 10 | |
|---|---|---|---|---|---|---|---|---|---|---|
| Canada | 3.0 | 5.8 | 5.8 | 5.2 | 4.8 | 4.8 | 4.4 | 4.4 | 3.6 | 3.6 |
| Australia | 5 | 10 | 7 | 6 | 4 | 4 | 4 | 4 | 4 | 3 |
| Japan | 9 | 13 | 11 | 12 | 10 | 9 | 7 | 7 | 6 | 5 |
| Canada CI +- | 2.5 | 2.4 | 2.3 | 2.4 | 1.8 | 1.8 | 1.8 | 1.8 | 1.7 | 1.7 |
| Canada c- | 0.6 | 3.4 | 3.5 | 2.8 | 2.9 | 2.9 | 2.6 | 2.6 | 1.9 | 1.9 |
| Canada c+ | 5.0 | 4.8 | 4.6 | 4.8 | 3.6 | 3.6 | 3.6 | 3.6 | 3.4 | 3.4 |
Note: CI stands for the confidence interval presented by the shaded area in Figure 23. c- represents the lower bound and c+ the upper bound.
Conclusion
Trademark activity continues to be the fastest-growing form of IP, both in Canada and by Canadians filing abroad. Trademark filings in Canada grew 29% over the last decade and 8% in the last year alone. Applications abroad by Canadians grew 38% between 2007 and 2016. These trends reflect the need for businesses to protect their brands in the increasingly competitive Canadian and global marketplaces. The Madrid Protocol will make filing trademark applications in Canada both simpler and more cost effective. CIPO forecasts that 25% of all filings abroad by Canadians will be by way of the Madrid system 8–10 years following Canada's accession to the Madrid Protocol, and will average about four designated countries per international application.
Industrial designs
Industrial designs
Industrial designs are IP rights that protect the visual aspects of a finished article with respect to shape, configuration, pattern or ornament, and any combination of these features.Footnote 26 Industrial design rights are important business assets for protecting the aesthetic elements of a product from imitation, which helps to enhance its distinctiveness and marketability.
CIPO received 6,533 applications in 2017, representing 6% growth over the previous year and 24% growth since 2008. Canadian industrial design filings abroad have also shown substantial growth, increasing by 35% from 2007 to 2016. This growth reflects the increasing importance of industrial design rights. With the Hague Agreement fully implemented as of November 5, 2018, Canadians are now able to file a single application in Canada covering multiple jurisdictions. This will reduce costs and administrative efforts for Canadians filing for industrial designs internationally.
Industrial design applications
Industrial design applications filed in Canada
Figure 24 shows the top countries of origin for industrial design applications in Canada in 2017. The United States continues to file the majority of industrial design applications in Canada with 3,473 applications, representing a 53% share. Canada ranks second with 815 filings and a 12% share of the total. The United Kingdom (341), Germany (215), Japan (197), and Switzerland (171) follow respectively. The top five non resident filers accounted for 77% of non-resident filings in 2017.

Figure 24 - Text version
| Country of origin | # of Industrial designs | Share of total |
|---|---|---|
| United States | 3,473 | 53% |
| Canada | 815 | 12% |
| United Kingdom | 341 | 5% |
| Germany | 215 | 3% |
| Japan | 197 | 3% |
| Switzerland | 171 | 3% |
Figure 25 shows industrial design applications filed in Canada by residency status from 2008 to 2017. CIPO received 6,533 industrial design applications in 2017, a 6% increase from the previous year. Total industrial design filings in Canada have increased steadily since the 2008 financial crisis due to strong growth in non-resident filings to the office. Non-resident filings fell over 25% in 2009, and took until 2012 to recover before growing 22% from 2013 to 2017. CIPO received 815 resident industrial design filings in 2017, an 11% decrease from the previous year. Resident filings have generally fluctuated in the range of 800 to 900 per year, with no consistent growth trend since 2008. Differences in the use of industrial designs by Canadian and non-resident applicants in Canada is explored later in this section.

Figure 25 - Text version
| Year | Resident | Non-resident | Total |
|---|---|---|---|
| 2008 | 664 | 4,618 | 5,282 |
| 2009 | 839 | 3,430 | 4,269 |
| 2010 | 851 | 4,291 | 5,142 |
| 2011 | 790 | 4,437 | 5,227 |
| 2012 | 847 | 4,515 | 5,362 |
| 2013 | 846 | 4,500 | 5,346 |
| 2014 | 859 | 4,908 | 5,767 |
| 2015 | 797 | 5,049 | 5,846 |
| 2016 | 916 | 5,254 | 6,170 |
| 2017 | 815 | 5,718 | 6,533 |
Industrial design applications filed abroad by Canadians
Figure 26 shows the top three destinations for international industrial design filings by Canadians in 2016. The United States received the most filings with 994, accounting for a majority share (66%) of Canadian international filings. The EUIPO and China followed respectively. Together, these destinations accounted for 87% of total industrial design filings abroad by Canadians, a share that is virtually unchanged from 2007. Filings by Canadians to the EUIPO have grown 89% since 2007.

Figure 26 - Text version
| Destination | Canadian Industrial Design Applications | Share of all canadian international industrial design applications |
|---|---|---|
| United States | 994 | 66% |
| European Union Intellectual Property Office | 181 | 12% |
| China | 124 | 8% |
Figure 27 shows the trend in international filings for industrial designs by Canadians from 2007 to 2016. Canadians filed 1,495 design applications abroad in 2016, a 9% increase from the previous year. Filings by Canadians are up 35% since 2007, owing to strong growth during the 2008 financial crisis, in 2012 and in 2016. Overall, the moderate declines seen in 2010–2011 and 2014–2015 have left filings relatively stagnant since 2009.

Figure 27 - Text version
| Year | Volume | Growth (right axis) |
|---|---|---|
| 2007 | 1,110 | 31% |
| 2008 | 1,206 | 9% |
| 2009 | 1,554 | 29% |
| 2010 | 1,493 | -4% |
| 2011 | 1,409 | -6% |
| 2012 | 1,626 | 15% |
| 2013 | 1,629 | 0% |
| 2014 | 1,545 | -5% |
| 2015 | 1,366 | -12% |
| 2016 | 1,495 | 9% |
Industrial design usage by Canadian and foreign firms
In 2016, CIPO engaged the OECD to conduct research to assist in better understanding Canadian IP activity. The resulting research applied a number of interesting data analysis methods and yielded valuable insights into how Canadian firms use IP. Factor analysis was used to group classes of IP assets in Canada based on the types of applicants that use them.Footnote 27 See Appendix B for a list of IP classes.
Table 1 displays the resulting factors for Canadian firms with IP rights in Canada from 2010–2014.Footnote 28 In this table, blue cells depict patents, green cells depict trademarks, and orange cells depict industrial designs. It is observed that industrial designs have very little prominence amongst the seven factors, except for its usage with leisure and education products.
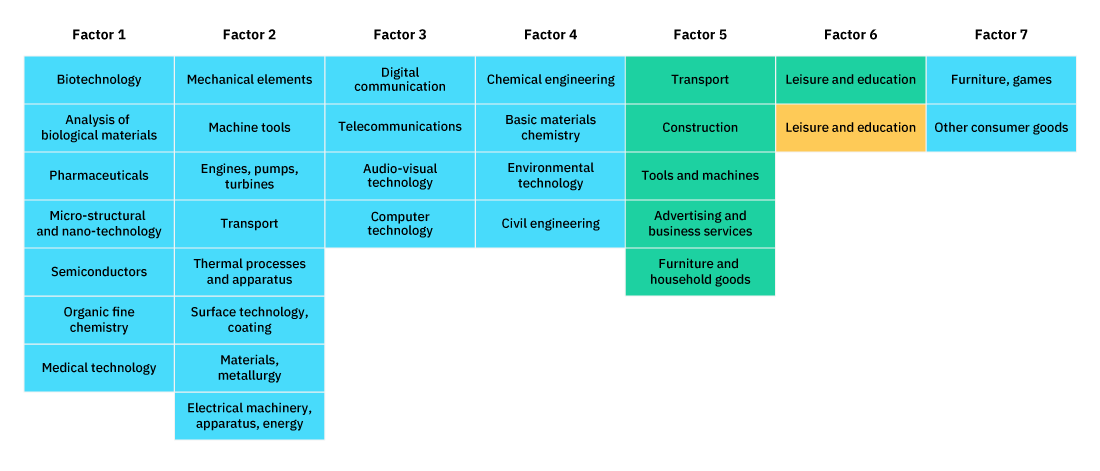
Table 1 - Text version
| Factor 1 | Factor 2 | Factor 3 | Factor 4 | Factor 5 | Factor 6 | Factor 7 |
|---|---|---|---|---|---|---|
| Biotechnology (P) | Mechanical elements (P) | Digital communication (P) | Chemical engineering (P) | Transport (T) | Leisure and education (T) | Furniture, games (P) |
| Analysis of biological materials (P) | Machine tools (P) | Telecommunications (P) | Basic materials chemistry (P) | Construction (T) | Leisure and education (ID) | Other consumer goods (P) |
| Pharmaceuticals (P) | Engines, pumps, turbines (P) | Audio-visual technology (P) | Environmental technology (P) | Tools and machines (T) | N/A | N/A |
| Micro-structural and nano-technology (P) | Transport (P) | Computer technology (P) | Civil engineering (P) | Advertising and business services (T) | N/A | N/A |
| Semiconductors (P) | Thermal processes and apparatus (P) | N/A | N/A | Furniture and household goods (T) | N/A | N/A |
| Organic fine chemistry (P) | Surface technology, coating (P) | N/A | N/A | N/A | N/A | N/A |
| Medical technology (P) | Materials, metallurgy (P) | N/A | N/A | N/A | N/A | N/A |
| N/A | Electrical machinery, apparatus, energy (P) | N/A | N/A | N/A | N/A | N/A |
Table 2 shows the resulting factors for foreign firms with IP in Canada from 2010–2014. The foreign firms were from six OECD benchmark countries: Australia, Germany, the United Kingdom, France, Japan, and the United States. This table shows industrial designs are much more prominent in the IP bundles of foreign firms in Canada. This analysis suggests there are technology areas where Canadian firms can improve competitiveness by enhancing their use of industrial designs.
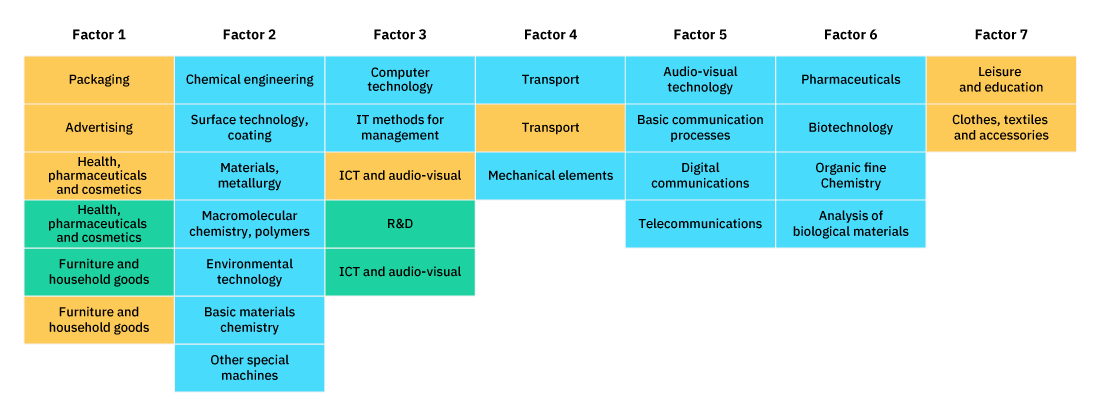
Table 2 - Text version
| Factor 1 | Factor 2 | Factor 3 | Factor 4 | Factor 5 | Factor 6 | Factor 7 |
|---|---|---|---|---|---|---|
| Packaging (ID) | Chemical engineering (P) | Computer technology (P) | Transport (P) | Audio-visual technology (P) | Pharmaceuticals (P) | Leisure and education (ID) |
| Advertising (ID) | Surface technology, coating (P) | IT methods for management (P) | Transport (ID) | Basic communication processes (P) | Biotechnology (P) | Clothes, textiles and accessories (ID) |
| Health, pharmaceuticals and cosmetics (ID) | Materials, metallurgy (P) | ICT and audio-visual (ID) | Mechanical elements (P) | Digital communication (P) | Organic fine chemistry (P) | N/A |
| Health, pharmaceuticals and cosmetics (T) | Macromolecular chemistry, polymers (P) | R&D (T) | N/A | Telecommunications (P) | Analysis of biological materials (P) | N/A |
| Furniture and household goods (T) | Environmental technology (P) | ICT and audio-visual (T) | N/A | N/A | N/A | N/A |
| Furniture and household goods (ID) | Basic materials chemistry (P) | N/A | N/A | N/A | N/A | N/A |
| N/A | Other special machines (P) | N/A | N/A | N/A | N/A | N/A |
The results of this factor analysis along with other interesting insights will be published in an upcoming OECD report, "Intellectual Property Activities of Canadian Firms". This study will support CIPO to increase awareness on the use of IP by firms, by providing evidence on IP activity across industries, in Canada and select OECD countries.
Conclusion
The upward trends of non-resident filings in Canada and filings abroad by Canadians reflect the growing importance of industrial designs globally. Non-resident filings have grown 24% since 2008 and Canadian filings abroad have grown 35%. However, resident filings in Canada have stagnated since 2009, suggesting that Canadian filers could be making better use of industrial design rights domestically. Research conducted by the OECD shows that industrial designs are more prominent in the IP bundles of foreign applicants in Canada than they are for Canadian firms. This analysis may show areas where Canadian firms can improve competitiveness through the use of industrial designs.
Conclusion
Conclusion
This year's "IP Canada Report" continued to highlight long-term trends in IP usage by Canadians and in Canada. It also presented new research about Canadian usage of patents, trademarks and industrial designs. Trademarks and industrial designs continue to be the fastest growing types of IP rights filed for by Canadians, both domestically and abroad. The recent accession to the Hague Agreement and the upcoming implementation of the Madrid Protocol will make filing for trademarks and industrial designs abroad simpler and more cost effective for Canadian businesses. This report includes an analysis of the potential use of the Madrid System, which specifically highlights that 25% of all filings abroad by Canadians will be by way of a single international application in eight to ten years following Canada's accession. Patent applications in Canada have remained stable since 2011, while patenting by Canadians abroad grew 13% between 2007 and 2016. Research into patenting by technologies showed that since the 2008 economic crisis, Canadian patenting has tracked or outpaced world trends in fields such as Digital Communication, Medical Technology, and Civil Engineering.
As Canada continues to become more integrated with the global economy, obtaining high-quality IP rights will continue to be a top priority for Canadian businesses. CIPO remains committed to advancing innovation through a modern IP framework, active international collaboration, and research that reveals important insights about Canadian IP usage globally.
Appendix A
Appendix A
CIPO oversees Canada's IP system, administering rights in the form of patents, trademarks, and industrial designs. Each type of IP protection is designed for different circumstances.
Patents
Patents provide a time-limited, legally protected, exclusive right to make, use and sell an invention. In this way, patents serve as a reward for ingenuity. Patents apply to newly developed technology, as well as to improvements on products or processes.
Patent protection applies in the country or region that issues the patent. In Canada, a patent lasts for 20 years from the date that it is filed. Patents can have a great deal of value. They can be sold, licensed or used as assets to attract funding from investors.Footnote 29
In exchange for these benefits, a full description of the invention must be provided when filing a patent. This helps enrich technical knowledge worldwide. Details of patent applications filed in Canada are disclosed to the public after an 18-month period of confidentiality.
To be eligible for patent protection, an invention must be: new (first in the world), useful (functional and operative), and inventive (showing ingenuity and not obvious to someone of average skill who works in the field of the invention). The invention can be: a product (e.g., door lock); a composition (e.g., chemical composition used in lubricants for door locks); a machine (e.g., for making door locks); a process (e.g., a method for making door locks); an improvement on any of these.
In Canada, the first applicant to file a patent application is entitled to obtain the patent. The patent should be filed as soon as possible after an invention is completed in case someone else is on a similar track.
Any public disclosure of an invention before filing may make it impossible to obtain a patent. There is an exception in Canada and the United States if the public disclosure was made by the inventor or by someone who learned of the invention from the inventor less than one year before filing the patent application. Please be aware that in some countries disclosing the invention to the public anywhere in the world before filing a patent application may, in many circumstances, prevent the inventor from obtaining a patent.Footnote 30
Standard fees are first, small entity fees are in parentheses:
Patent application fee: $400 ($200)
Examination fee: $800 ($400)
Final fee (before grant): $300 ($150)
Additional fees may apply
Maximum duration: 20 years
Renewal: Annually (maintenance fees vary based on the anniversary of filing)
Trademarks
Trademarks can be one or many words, sounds or designs used to distinguish the goods or services of one person or organization from those of others. Over time, trademarks stand for not only the actual goods or service a person or company makes, but also the reputation of the producer. Trademarks are very valuable intellectual property.Footnote 31
There are three types of trademarks:
An ordinary mark is made up of words, sounds, designs or a combination of these used to distinguish the goods or services of one person or organization from those of others. For example, suppose you started a courier business that you chose to call Giddy-up. You could register these words as a trademark (if you met all the legal requirements) for the service that you offer.
A certification mark can be licensed to many people or companies for the purpose of showing that certain goods or services meet a defined standard. For example, the Woolmark design, owned by Woolmark Americas Ltd., is used on clothing and other goods.
A distinguishing guise is shape of goods or their containers, or a way of wrapping or packaging goods that shows they have been made by a specific individual or firm. For example, if you manufactured butterfly-shaped candy you could register the butterfly shape as a distinguishing guise.
Trademark application fee: $250 (online) or $300 (paper)
Trademark registration fee: $200
Duration: 15 years, renewable for $350 (online) or $400 (paper)
Industrial designs
Industrial designs are about how things look. More technically speaking, they are the visual features of shape, configuration, pattern or ornament, or any combination of these features, applied to a finished article. For example, the shape of a table or the shape and decoration of a spoon may be industrial designs.Footnote 32 If you want to register an industrial design, it has to be original. Registering your industrial design will provide you with an exclusive right to your design for up to 10 years after you register.
Examination of an application to register a design: $400
Maintenance of a registration of a design: $350 (due 5 years after registration)
Maximum duration: 10 years
Appendix B
Appendix B
List of IP classes
Research in the section of this report titled "Analysis of Patenting by Technology Field" refers to technology fields for patents listed in the table below. The section titled "Industrial Design Usage by Canadian and Foreign Firms" uses these technology fields, as well as the trademark fields and design product groupings listed below. The OECD created these trademark fields using the Nice classification and product classifications for industrial designs based on the Locarno classes and CIPO's own design classification.Footnote 33
Patents by technology fields
- Electrical machinery, apparatus, energy
- Audio-visual technology
- Telecommunications
- Digital communication
- Basic communication processes
- Computer technology
- IT methods for management
- Semiconductors
- Optics
- Measurement
- Analysis of biological materials
- Control
- Medical technology
- Organic fine chemistry
- Biotechnology
- Pharmaceuticals
- Macromolecular chemistry, polymers
- Food chemistry
- Basic materials chemistry
- Materials, metallurgy
- Surface technology, coating
- Micro-structural and nano-technology
- Chemical engineering
- Environmental technology
- Handling
- Machine tools
- Engines, pumps, turbines
- Textile and paper machines
- Other special machines
- Thermal processes and apparatus
- Mechanical elements
- Transport
- Furniture, games
- Other consumer goods
- Civil engineering
Trademarks by fields
- Chemicals
- Transport
- Construction
- Clothes, textiles and accessories
- Tools and machines
- Advertising and business services
- Agricultural products
- R&D
- Health, pharmaceuticals and cosmetics
- Furniture and household goods
- ICT and audio-visual
- Leisure and education
- Hotels, restaurants and other services
Designs by products
- Advertising
- Agricultural and food products
- Clothes, textiles and accessories
- Construction
- Electricity and lighting
- Furniture and household goods
- Health, pharmaceuticals and cosmetics
- ICT and audio-visual
- Leisure and education
- Packaging
- Tools and machines
- Transport