

Author(s): Liang Zhang, Yiyan Wu, Sebastien Lafleche, Xinping Huang, Sarah Dumoulin, Richard Paiement, Adrian Florea
April 03, 2020
CRC Unique number: 031019-TR-01
Approved for issue as a CRC Technical Report by: Adrian Florea
To obtain a copy of this publication, or to receive it in an alternate format (Braille, large print, etc.), please fill out the Publication Request Form atwww.ic.gc.ca/Publication-Requestor contact:
Web Services Centre
Innovation, Science and Economic Development Canada
C.D. Howe Building
235 Queen Street
Ottawa, ON K1A 0H5
Canada
Telephone (toll-free in Canada): 1-800-328-6189
Telephone (international): 613-954-5031
TTY (for hearing impaired): 1-866-694-8389
Business hours: 8:30 a.m. to 5:00 p.m. (Eastern Time)
Email: ISED@canada.ca
Permission to Reproduce
Except as otherwise specifically noted, the information in this publication may be reproduced, in part or in whole and by any means, without charge or further permission from the Department of Industry, provided that due diligence is exercised in ensuring the accuracy of the information reproduced; that the Department of Industry is identified as the source institution; and that the reproduction is not represented as an official version of the information reproduced or as having been made in affiliation with,
or with the endorsement of, the Department of Industry.
For permission to reproduce the information in this publication for commercial purposes, please fill out the Application for Crown Copyright Clearance atwww.ic.gc.ca/copyright-requestor contact the Web Services Centre mentioned above.
© Her Majesty the Queen in Right of Canada, as represented by the Minister of Industry, 2020.
Aussi offert en français sous le titre Évaluation de la capacité des systèmes fixes d'accès sans fil à fournir des services Internet à large bande.
Executive summary
Wireless Internet Service Providers (WISPs) play a key role in providing broadband internet access services to rural and remote areas in Canada, as well as complementing service delivery by wired broadband systems in urban communities.
Given the regulatory targets for broadband access speeds introduced in Canada and as well in other jurisdictions, there is a need for WISPs to be able to estimate the ability of their planned wireless deployments to meet specific performance metrics.
In 2016, the Canadian Radio-television and Telecommunications Commission (CRTC) established a universal service objective that Canadian residential and business subscribers of fixed broadband internet access service should be able to access speeds of at least 50 megabits per second (Mbps) download and 10 Mbps upload, and to subscribe to a service offering with an unlimited monthly data allowance. These requirements are significantly higher than the previous requirements of 5/1 Mbps download/upload speeds. Given the ongoing advancement of technology and user requirements, it is possible and even likely that at some point in the future the access speed targets may be increased again.
This technical report proposes a generic methodology and a set of criteria to quantitatively evaluate the capability of Fixed Wireless Access (FWA) systems to deliver broadband internet access service meeting a specific set of download/upload speed requirements, , where, for example, would take the values of 50/10 Mbps for the current CRTC requirements. Under this proposed methodology, an FWA system under evaluation is defined by: (1) a selected wireless technology with specific deployment configuration, and (2) a service coverage scenario with an intended number of subscribing households over a specific geographical area.
The proposed methodology serves to:
- determine if an FWA system is capable of delivering high-quality broadband internet access service over a specific coverage area, especially for rural and remote areas in Canada;
- measure to what extend an FWA system could deliver the target download/upload speed requirements to the subscribing households in a specific geographic area.
The proposed method relies on a number of assumptions, further detailed in this report, on the level of minimal service quality (QoS) and the system's capability to achieve peak capacity. Such assumptions will inevitably evolve with advancement of wireless technologies and increasing demand of internet applications for higher internet access speed.
Table of contents
- List of acronyms
- 1 Introduction
- 2 System evaluation methodology
- 3 Case studies
- 4 Conclusions
- References
- Annex I: CRTC Determinations on fixed residential broadband access
- Annex II: LTE Cell peak capacity
List of Acronyms
- CA
- Carrier Aggregation
- CRC
- Communications Research Centre Canada
- CRTC
- Canadian Radio-television and Telecommunications Commission DL Downlink
- FDD
- Frequency Division Duplexing
- FWA
- Fixed Wireless Access
- HD
- High Definition
- HEVC
- High-Efficiency Video Coding
- ISP
- Internet Service Provider
- LTE
- Long Term Evolution
- Mbps
- Megabits per second
- MIMO
- Multiple Input Multiple Output
- OSR
- Oversubscription Ratio
- QAM
- Quadrature Amplitude Modulation
- QoS
- Quality of Service
- TDD
- Time Division Duplexing
- UHD
- Ultra-High Definition
- UL
- Uplink
- VVC
- Versatile Video Coding
- WISP
- Wireless Internet Service Provider
1 Introduction
Fixed and mobile broadband internet are essential services that enable all Canadians to participate in the digital economy and society.
The Canadian Radio-television and Telecommunications Commission (CRTC) established a universal service objective [1]:
- Canadians, in urban areas as well as in rural and remote areas, have access to voice services and broadband internet access services, on both fixed and mobile wireless networks.
The criteria to measure successful achievement of this objective are defined by CRTC as follows:
- Canadian residential and business fixed broadband internet access service subscribers should be able to access speeds of at least 50 megabits per second (Mbps) download and 10 Mbps upload, and to subscribe to a service offering with an unlimited data allowance; and
- the latest generally deployed mobile wireless technology should be available not only in Canadian homes and businesses, but on as many major transportation roads as possible in Canada.
Table 1 summarizes the current criteria defined by CRTC for fixed broadband internet access service to all Canadians in urban, rural and remote areas. In addition to the download/upload speeds and the monthly data usage, there are also three Quality of Service (QoS) criteria [2][3].
| Speed | 50/10 Mbps for Download/Upload | |
|---|---|---|
| Capacity | Unlimited | |
| QoS | Latency | ≤ 50 millisecond (round-trip) |
| Packet loss | ≤ 0.25% | |
| Jitter | ≤ 5 milliseconds | |
While Internet Service Providers (ISPs) deliver broadband internet access services in urban areas mostly using wired infrastructure, Wireless Internet Service Providers (WISPs) play a key role to provide broadband internet services to rural and remote areas in Canada, as well as to eliminate unserved coverage gaps in urban communities where the wired infrastructure cannot reach.
Wireless communications technologies have evolved significantly during recent years, which enables new service capabilities to deliver not only much higher transmission speeds but also significantly better quality of service (QoS). Different wireless systems can be deployed to deliver fixed broadband internet access services meeting these requirements. Depending on the selected technology and deployment configuration, there can be a significant range in capabilities to deliver internet services and to reach remote households.
In this technical report, a generic evaluation methodology is proposed with a set of criteria to quantitatively evaluate the capability of Fixed Wireless Access (FWA) systems to provide broadband internet access service meeting a specific set of download/upload speed requirements, i.e., . At current time, = 50/10 Mbps for CRTC target requirement. However, this target would likely change over time.
Under this proposed methodology, an FWA system under evaluation is defined by a selected wireless technology with specific deployment configuration, and a service coverage scenario with an intended number of subscribing households over a specific geographical area. Popular wireless technologies include 3GPP Long Term Evolution (LTE), also called 4th generation (4G) mobile broadband systems, IEEE 802.11 (Wi-Fi) systems, IEEE 802.16 (WiMax) systems, 5th generation (5G) mobile broadband systems, etc.
The proposed methodology is carried out in two steps:
- Step-1: A Pass/Fail evaluation is conducted to determine if an FWA system could meet some basic Quality of Service (QoS) requirements, given certain assumptions on internet applications. This step evaluates the system against three criteria, establishing if it meets minimum technical requirements, such as providing the target download/upload speeds when required by subscribing households up to the farthest edge of the service area, and providing a minimum QoS to all subscribing households at all times.
- Step-2: For an FWA system that has passed in Step-1, a capability evaluation process is carried out to estimate the degree to which the system under evaluation can deliver the target Mbps download/upload speed requirements. The output of this step is a quality score. The score can be based on either one, or a combination, of the following metrics: 1) oversubscription ratio; and 2) guaranteed percentage of households simultaneously having access to the target download/upload speeds .
The evaluation assumes availability of the necessary amount of spectrum, and a backhaul with sufficient capacity to support the service.
2 System Evaluation Methodology
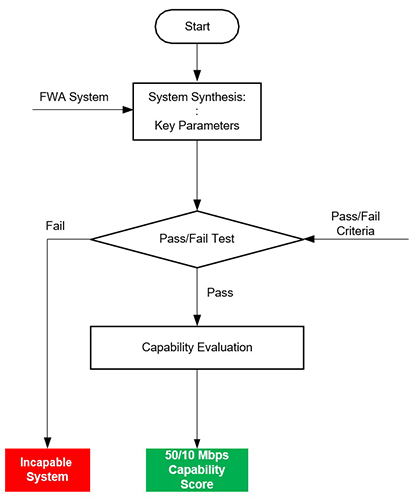
The proposed evaluation workflow is illustrated in Figure 1. First, an "FWA System Synthesis" is carried out to abstract the key information that is required for system capability evaluation, including:
- system capacity per cell provided by the wireless technology,
- maximal number of subscribing households per cell, and
- the longest tower-to-household distance.
Then, a Pass/Fail process is carried out against three basic criteria to decide if the system under evaluation could deliver internet services with sufficient QoS considering today's typical internet applications and quality requirements, and if the system can deliver the target download/upload speeds over the entire coverage area. A system that fails one or more of the three criteria would fail this process and is determined as disqualified to meet the target download/upload speeds requirements.
When a system passes the above "Pass/Fail" evaluation, a "Capability Evaluation" is carried out to quantitatively characterize to what extend this system meets the target speed requirements. The outputs of the "Capability Evaluation" is a Capability Score.
Figure 1 : Evaluation Flowchart
2.1 System Synthesis
An FWA system under evaluation is defined by a wireless technology deployment and a service coverage scenario with an intended number of subscribing households over a specific geographical area.
Most modern wireless technologies utilize multi-cell deployment to maximize reuse of available spectrum over a relatively large geographical area. Recent technologies, such as LTE and 5G, can reuse the full spectrum at each cell, i.e., a frequency reuse factor close to one (1). This allows the wireless technology to deliver almost its full capacity in each cell. Therefore, the capability evaluation of an FWA system is conducted based on each coverage cell.
The objective of the system synthesis is to collect the information required to determine (1) the system capacity and (2) service coverage requirements to conduct the capability evaluation that follows.
2.1.1 System Capacity Per Cell
To determine the system capacity of an FWA system, the following information is required:
- Wireless technology and releases: for example, LTE and release number
- Operating frequency and bandwidth
- Number of base station antennas per cell and antenna gain
- Number of subscriber antennas per household and antenna gain
- Transmission power per cell
A wireless technology with a specific deployment configuration can usually be characterized by a system peak capacity per cell, which is calculated assuming all frequency resources being fully used with the system configurations for the highest throughput, e.g. the highest modulation order, highest coding rate, lowest overhead ratio, and highest order multiple-input-multiple-output (MIMO) antenna configurations at both base station and subscriber device.
The number of base station antennas and subscriber antennas are used to determine the supported multiple antenna configurations, also called MIMO configurations. Different MIMO configurations could result in significant difference in the achievable system capacity.
Increasing the transmission power could be a useful option to improve the link capacity, especially for remote areas with sparsely distributed populations.
The system peak capacity represents an upper-bound in ideal conditions, where all subscribing households have strong signal reception and could share the radio resources evenly, with a constant data traffic model. For simplicity, the peak system capacity is used in the proposed evaluation process.
It needs to be pointed out that using the peak system capacity results in optimistic capability evaluation scores. In practice, the achievable system capacity is always lower than the peak capacity and is impacted by the following factors:
- Multi-cell or single-cell deployment;
- network loading and data traffic model;
- coverage area size and terrain type.
First of all, for each cell, the system capacity in a multi-cell deployment would be smaller than the single-cell deployment because of the co-channel interference (CCI) between the adjacent cells.
Secondly, the network loading and data traffic model could also make a difference in the achievable capacity.
Finally, the coverage area size and terrain type could cause low received signal strength at the subscribing households close to the edge of the cell. The direct impact is a reduced system capacity.
2.1.2 Service Coverage Requirements
To conduct the capability evaluation, the two major coverage requirements are:
- the number of subscribing households in each cell
- the longest tower-to-household distance
The number of subscribing households in a cell determines the total internet traffic capacity requirement within this cell. The longest tower-to-household distance determines the level of service quality that can be received by the farthest subscribing households within the cell.
To identify the value of these two requirements, the following information needs to be collected:
- Service area
- Number of towers and tower location
- Number of sectors/cells per tower
- Number of targeted households in each sector/cell
In the most common deployment of wireless systems, a coverage area of a base-station is usually divided into multiple sectors, where each sector is served by different antennas mounted on the same transmission tower. In this case, each sector is counted as a cell since it can use the full spectrum to deliver services to the subscribing households within this sector. In this document, cell and sector are used interchangeably.
For an FWA system, the most challenging case occurs for the cell with the highest subscribing household density. Therefore, the evaluation could be conducted with the maximum number of serving households in a cell. This guarantees the minimal service quality is achievable for subscribing households in all the cells over the entire service area.
An alternative approach is to use the average household per cell over the entire service area. This, however, will result in over-estimate of the system capability in some cells.
2.1.3 Required Information for System Evaluation
All the required information to evaluate the capability of an FWA system to deliver high-speed internet services, as discussed in Sections 2.1.1 and 2.1.2, is listed in Table 2.
This information is sufficient to identify both the system capacity and the service coverage requirements for the system capability evaluation.
Note that items 7 and 8 serve to identify the supported MIMO configurations, and can be replaced by a single item on the supported maximum downlink (DL) and uplink (UL) MIMO layers.
| # | Description | |
|---|---|---|
| 1 | Service area (geographical contour) | |
| 2 | Number of towers and tower locations | |
| 3 | Number of cells/sectors per tower | |
| 4 | Number of targeted households per cell, or Number of targeted households within the service area | |
| 5 | Type of wireless technology and release | |
| 6 | Carrier frequency and bandwidth | |
| 7 | Number of base station antennas per cell | Maximum DL/UL MIMO |
| 8 | Number of subscriber antennas per household | Maximum DL/UL MIMO |
| 9 | Base station / subscriber site antenna gains | |
| 10 | Transmission power per cell | |
2.2 Evaluation Procedure
The system evaluation is divided into two steps. The first step is a Pass/Fail test to examine if the FWA system could meet some minimal criteria to provide high-quality broadband internet access services and to deliver the target download/upload speed requirements to subscribing households that request this level of services. A system that fails any of the criteria is determined as a disqualified system.
For an FWA system passing the Pass/Fail test, further evaluations are conducted in a second step to characterize its capability to deliver internet services at the download/upload speeds. A quality score is determined using quantitative measures based either on the oversubscription ratio, or on the percentage of households that could simultaneously achieve while maintaining QoS for all the other subscribing households.
2.2.1 Step-1: "Pass/Fail" Test
This step is to evaluate if an FWA system, defined by a wireless technology deployment and a coverage scenario, is (1) capable of delivering a defined quality internet access to all subscribing households simultaneously, and (2) capable of delivering the target download/upload speeds to a minimal percentage of households within the coverage area.
The following three criteria, described in more details below, are used for the Pass/Fail test:
- Criterion-1: all subscribing households within the coverage area should at all times simultaneously have access to a set of minimal download and upload speeds that are sufficient to access broadband applications with a minimal guaranteed QoS, considering multiple entertainment applications and business applications at the same time.
- Criterion-2: at least X% of the subscribing households could simultaneously achieve the target Mbps download/upload speed requirements.
- Criterion-3: the farthest subscribing household at the edge of the coverage area could achieve the target Mbps download/upload speed requirements, without significantly reducing service quality of other subscribing households, for example, using less than Y% of the spectrum resource, etc. The system is evaluated with the understanding that 100% coverage is often impossible to achieve when using wireless systems, due to the adverse propagation conditions related to the terrain elevation variations, blockage from trees, hills and other obstacles, and actual locations of the subscribing households. A household in a blocked area will typically suffer from poor quality of service or even no service.
2.2.1.1 Criterion-1:
This criterion requires that the system be able to simultaneously deliver broadband internet access services to all subscribing households with a minimal level of quality, during the peak traffic hours.
This criterion can be expressed as,
where and are the system downlink and uplink capacities per cell, is the number of subscribing household within each cell, while and are the required household throughput to support the minimal internet service qualities on the downlink and uplink, respectively.
The most demanding period of the day, i.e., peak hours, for broadband internet access services is usually between 7:00pm to 11:00pm, when most people are at home accessing internet.
Among the different internet applications, the most popular, and also the most demanding on data throughput, are those providing high-resolution video streaming, e.g., Netflix, Disney Plus, YouTube, etc. For these applications, the required connection speeds are mainly determined by video resolution and video coding technology.
High-definition (HD) quality has become the norm for consumer video service consumption. The most commonly consumed video resolutions are 720p HD (1280x720 pixels), 1080p HD (1920x1080 pixels) and 4k UltraHD (4k UHD, 3840x2160 pixels). Naturally, higher resolution videos require higher transmission speeds for real-time streaming.
The current state-of-the-art video coding technology is named High-Efficiency Video Coding (HEVC), also known as H.265. HEVC is becoming the mainstream video codec (coder/decoder) for internet streaming services due to its significantly higher compression efficiency.
The next-generation video coding technology is named Versatile Video Coding (VVC) and is currently under development. The standardization of VVC is planned to be completed by the end of 2020, with chipset development and technology deployment to follow in the subsequent years. Using VVC should provide at least 35% further data compression relative to HEVC.
In Table 3, the required data rates for streaming services with different resolutions are summarized for the three most commonly consumed video resolutions. The HEVC data rates are what can be expected with today's technology, while VVC data rates could become mainstream in 4 to 5 years.
It needs to be considered that a subscribing household typically has multiple residents, who could access different internet services at the same time. Therefore, just assuming one video streaming service per household may not capture most of the internet activities at the peak hours.
| Video Format | HEVC (Current) | VVC (Future) |
|---|---|---|
| 720p HD (1280x720) | 2 Mbps | 1.3 Mbps |
| 1080p HD (1920x1080) | 4 Mbps | 2.6 Mbps |
| 4k UHD (3840x2160) | 12 Mbps | 7.8 Mbps |
In this report, a simple approach is adopted to approximate the average download data rate from all internet activities incurred within one subscribing household during the peak hours. It is assumed that, on average, there is always one HD video streaming service and some other internet services, such as emails, social media, video calling, etc. The other internet services usually consume much lower data rate than the HD video streaming service. Therefore, it is further assumed that the total combined data rate required by all the other internet services is half of that required by one HD video streaming service.
There are a few internet applications requiring high upload speeds. These include video conferencing, video calling, video uploading on social networks, and video uploading from Internet of Things (IoT) devices (e.g., surveillance cameras), which by nature don't continuously stream. Therefore, the requirement on upload speed is much lower than that on download. The Criterion-1 evaluation only considers the required download speed and assumes the required upload speed is one-fifth (1/5) of the required download speed, i.e., a required download to upload speed ratio of five to one (5:1). This assumption is made to be consistent with the download to upload ratios adopted by CRTC in both the earlier 5/1 Mbps and current 50/10 Mbps download/upload speed requirements.
In Table 4, the broadband download speed per subscribing household are listed for three estimates of the overall per household internet usage, represented by a multiplication factor, N:
- N = 1: assuming one HD video streaming service per household, with concurrent low data rate internet services, e.g., emails, text messages, social media with low resolution video, etc.
- N = 1.5: assuming one HD video streaming service per household, with concurrent medium data rate internet services, e.g., standard definition (SD) video conferencing, remote classroom, online-gaming, etc., in addition to low data rate internet services;
- N = 2: assuming two HD video streaming service per household, or one streaming with concurrent high data rate internet services, e.g., HD video conferencing, virtual reality applications, etc.
The associated upload speeds are also presented in Table 4, assuming the 5:1 download to upload speed ratio. Note that HD video streaming applications usually have upload data rate requirements which are much lower than one fifth the download data rate, resulting in additional upload capacity for other household uses.
Among these scenarios, and for this discussion, N = 1.5 is selected as a good compromise considering that in most instances, not all households will be streaming HD video simultaneously.
Assuming a minimal QoS requirement of 1080p streaming with N = 1.5 per household, for a coverage cell with 100 target households, the FWA system needs to deliver at least 6´100 = 600 Mbps download speed and 1.2´100 = 120 Mbps upload speed, for the current HEVC video coding technology.
| Required Download and Upload Speeds per Household [Mbps] | |||||
|---|---|---|---|---|---|
| HEVC (Current) | VVC (Future) | ||||
| Download | Upload | Download | Upload | ||
| N = 1.0 streaming per household | 720p | 2 Mbps | 0.4 Mbps | 1.3 Mbps | 260 kbps |
| 1080p | 4 Mbps | 0.8 Mbps | 2.6 Mbps | 520 kbps | |
| 4k-UHD | 12 Mbps | 2.4 Mbps | 7.8 Mbps | 1.56 Mbps | |
| N = 1.5 streaming per household | 720p | 3 Mbps | 0.6 Mbps | 1.95 Mbps | 390 kbps |
| 1080p | 6 Mbps | 1.2 Mbps | 3.9 Mbps | 780 kbps | |
| 4k-UHD | 18 Mbps | 3.6 Mbps | 11.7 Mbps | 2.34 Mbps | |
| N = 2.0 streaming per household | 720p | 4 Mbps | 0.8 Mbps | 2.6 Mbps | 520 kbps |
| 1080p | 8 Mbps | 1.6 Mbps | 5.2 Mbps | 1.04 Mbps | |
| 4k-UHD | 24 Mbps | 4.8 Mbps | 15.6 Mbps | 3.12 Mbps | |
2.2.1.2 Criterion-2:
This criterion directly addresses the target Mbps download/upload speed requirements. It requires that the FWA system should be capable of delivering target speeds to at least X% of the subscribing households simultaneously, which can be expressed in formula as,
This household percentage is directed related to the oversubscription ratio (OSR) of the FWA system, which are defined for download and upload transmissions as,
where and are the download and upload oversubscription ratios, and are the download and upload system capacities provided by the selected wireless technology, and is the number of subscribing households.
A lower threshold for the subscribing household percentage X corresponds to a higher threshold for the OSR. In fact, X = 1/OSR.
In this report, a threshold of X = 5% is chosen as a reasonable value, corresponding to a maximal OSR of 20.
It should be noted, Criterion-2 is a theoretical construct to establish if the system is capable of delivering speeds. In practice, if all system capacity would be used to provide high speed to a minority of users, the rest of the users would be left in an outage situation.
2.2.1.3 Criterion-3:
This criterion requires that the FWA system be able to deliver the target Mbps download/upload speeds to the farthest subscribing household, assuming line of sight (LOS) propagation between the transmission tower and subscribing households. However, the system should not use more than Y% of the radio resource to deliver the Mbps to the farthest subscribing household, to avoid significant QoS degradation to other subscribing households. This approach determines in a simplified way whether the system is capable of delivering the target speeds over the entire service area.
A link budget analysis needs to be conducted to evaluate how much spectrum resource is required to deliver the required download/upload speeds to the farthest subscribing houses, i.e., at the edge of the service area.
A threshold of Y = 20% is currently considered, i.e., delivering Mbps to the farthest subscribing household would consume no more than 20% of the total spectrum resource in the cell servicing this household, resulting in on average 20% capacity loss to the remaining subscribing households.
2.2.2 Step-2: Capability Evaluation
Once a system is deemed to meet the minimum qualification requirements as defined in Step-1, a more detailed capability evaluation is conducted to provide a quantitative measure on how capable this FWA system is to meet the target Mbps download/upload speed requirements over the service area.
Two metrics are proposed:
- Oversubscription ratio (OSR) of the FWA system
The OSR provides a good indication on the extent to which the system could support simultaneous Mbps download/upload speeds for multiple subscribing households. The OSRs are defined in Eq. (2) for both download and upload speeds, which is repeated here for easy reading:
(4)where and are the download and upload oversubscription ratios, and are the download and upload system capacities of the selected wireless technology, and is the number of subscribing households.
Once again, for recent wireless technologies such as LTE and 5G, the calculation is performed for each cell, or for the cell with the highest household population.
A download OSR of one (1) means that the wireless system could support SDL Mbps download speeds for all subscribing households at the same time; while an upload OSR of one (1) means that the system could support SUL Mbps upload speeds simultaneously for all subscribing households.
However, in practice, a broadband system is most likely deployed with an OSR higher than one. First of all, not all subscribing households are willing to pay the high cost for the service package with high speeds. Secondly, it is
unlikely that all households would be using internet services that require Mbps at the same time. It is therefore uneconomical for a broadband system to operate with an OSR of one (1).
For capability evaluation, a higher OSR value indicates a lower capability to deliver simultaneously the required Mbps download/upload speeds to a large number of households. - Guaranteed percentage of households with download/upload speeds
A second metric is defined as the percentage of subscribing households that are guaranteed to achieve download/upload speeds simultaneously, while all other households would still get a minimum QoS. Further in this document we will refer to this parameter as guaranteed household percentage (GHP).
Assuming the system would support Z% of the subscribing households to access speeds simultaneously, i.e., a GHP of Z%, the required download and upload system capacities are calculated as,
(5)where RDL-QoS and RUL-QoS are the download and upload speeds required to deliver the minimal QoS simultaneously to all subscribing households, i.e., to meet the Criterion-1 in the Pass/Fail test.
With the download system capacities calculated by Eq. (5), the guaranteed household percentage having access to SDL download speed is calculated as,(6)A wireless system with the capacity to simultaneously deliver a download speed SDL to all subscribing households has a GHP of 100%.
A wireless system with a capacity to simultaneously deliver higher than SDL Mbps to all subscribing households has a GHP higher than 100%.
In general, not all the households are willing to subscribe to high-speed services, and not all subscribing households would use internet services requiring high speed at the same time. Therefore, to be economically viable, WISPs usually deploy wireless systems that cannot simultaneously deliver SDL to all subscribing households. Therefore, the value of GHP, Z%, is most likely less than 100%.
For upload, the GHP with SUL Mbps upload speed is calculated as,
(7)A wireless system with the capacity to simultaneously support SUL Mbps upload speed to all subscribing households has an upload GHP percentage of 100%.
A wireless system with a capacity to simultaneously deliver higher than SUL Mbps upload speed to all subscribing households has an upload GHP higher
3 Case Studies
This section demonstrates how the proposed evaluation method can be applied to FWA systems, for a few use cases. Two sets of speed requirements are considered, the current 50/10 Mbps download/upload target speed requirements from CRTC and a set of reduced download/upload speeds of 25/5 Mbps.
3.1 Use Case Scenarios and Deployment Models
Six service scenarios are considered, as identified in Table 5, each having a specific number of subscribing households per cell ( = 50, 100 or 200) and a required minimal throughput or capacity (3 or 6 Mbps) to support the minimal service quality (N = 1.5 with 720p or 1080p, respectively, as main HD video streaming service).
| Scenarios | Number of Households per Cell () | Min. Capacity Per Household () [Mbps] |
|---|---|---|
| Scn-1 | 50 | 3.0 (1.5 x 720p) |
| Scn-2 | 50 | 6.0 (1.5 x 1080p) |
| Scn-3 | 100 | 3.0 (1.5 x 720p) |
| Scn-4 | 100 | 6.0 (1.5 x 1080p) |
| Scn-5 | 200 | 3.0 (1.5 x 720p) |
| Scn-6 | 200 | 6.0 (1.5 x 1080p) |
All use cases assume LTE technology, since it is the most popular candidate wireless system in terms of the technical maturity, the equipment availability and the cost efficiency. Frequency division duplex (FDD) mode of LTE deployment is chosen in the studies because it is the most popular commercial deployment option.
For LTE systems, different releases and deployment options could have significantly different system capacities. In Table 6, the system peak download capacities are summarized for different LTE releases in FDD mode, with different bandwidth and MIMO configurations.
| Modulation | MIMO Configuration | Bandwidth | |||
|---|---|---|---|---|---|
| 5 MHz | 10 MHz | 20 MHz | 40 MHz with CA | ||
| 64-QAM LTE Rel. 11 and prior | 2x2 | 38 Mbps | 76 Mbps | 151 Mbps | 302 Mbps |
| 4x4 | 76 Mbps | 151 Mbps | 302 Mbps | 604 Mbps | |
| 8x8 (DL only) | 151 Mbps | 302 Mbps | 605 Mbps | 1210 Mbps | |
| 256-QAM LTE Rel. 12 and after | 2x2 (DL only) | 50 Mbps | 101 Mbps | 202 Mbps | 403 Mbps |
| 4x4 (DL only) | 101 Mbps | 202 Mbps | 403 Mbps | 806 Mbps | |
| 8x8 (DL only) | 202 Mbps | 403 Mbps | 806 Mbps | 1612 Mbps | |
In the following case studies, for each service scenario, four different LTE system deployments are considered, each with a different peak system capacity. FDD is always assumed, with a bandwidth of 20 MHz. In addition, a wider bandwidth of 40 MHz is also considered as a more capable version of the system, which is achieved by using Carrier Aggregation (CA) technology of LTE to combined two 20 MHz channels.
It is further assumed that the subscribing households can install high-gain roof-top antennas so the received signal strength is sufficiently high to support the most efficient transmission mode, i.e., with the highest spectral efficiency (e.g., modulation, coding, and MIMO configuration). This assumption ensures that the example system always meets the Criterion-3 in the Pass/Fail test.
3.2 System Evaluation
3.2.1 Evaluation of Downlink vs Uplink Speeds
The system evaluation should be conducted for download and upload separately, from which the lower capability score is taken as the final system capability score.
On the other hand, for LTE systems, there are good reasons to conduct the evaluation of FWA systems only on the download speed requirements.
For LTE in FDD mode, where downlink and uplink have the same spectrum bandwidth, the uplink peak throughput for (16QAM, 4x4 MIMO) is about one to three (1:3) of the downlink peak throughput for (64QAM, 8x8 MIMO), i.e., the system offers a capacity ratio higher than the required one to five (1:5) for 50/10 or 25/5, so the system limitation is on the downlink.
For typical mobile broadband systems, the achievable uplink capacity is in general much lower than the peak capacity due to the limited transmission power of the handsets. However, this report focuses on the fixed wireless access system, which could install a high-gain antenna on roof-top and does not have a power consumption limitation on the subscriber side. Therefore, the uplink capacity could approach the peak system capacity.
Therefore, in the following case studies, only download speed requirement is considered in the capability evaluation. It is assumed that the upload speed requirement is much easier to meet as comparing to download speed.
3.2.2 Pass/Fail Test
To calculate the required system capacity to meet Criterion-1 in the Pass/Fail test, it is assumed that for each household, there is one real-time HD video streaming (720p or 1080p) and some other internet activities consuming half of the capacity required for the HD video streaming; this corresponds to N = 1.5 as defined for Criterion-1. Using Table 4, the required system capacities per cell to meet Criterion-1, CCri-1, are calculated for the six scenarios and are reported in Table 7.
| Scenario | [Mbps] | 50/10 Mbps | 25/5 Mbps | |||
|---|---|---|---|---|---|---|
| CCri-1 [Mbps] | CCri-2, 5% [Mbps] | CCri-1 [Mbps] | CCri-2, 5% [Mbps] | |||
| Scn-1 | 50 | 3.0 (1.5 x 720p) | 150 | 125 | 150 | 62.5 |
| Scn-2 | 50 | 6.0 (1.5 x 1080p) | 300 | 125 | 300 | 62.5 |
| Scn-3 | 100 | 3.0 (1.5 x 720p) | 300 | 250 | 300 | 125 |
| Scn-4 | 100 | 6.0 (1.5 x 1080p) | 600 | 250 | 600 | 125 |
| Scn-5 | 200 | 3.0 (1.5 x 720p) | 600 | 500 | 600 | 250 |
| Scn-6 | 200 | 6.0 (1.5 x 1080p) | 1200 | 500 | 1200 | 250 |
For the Criterion-2 of the Pass/Fail test, a threshold of 5% is chosen, i.e., at least 5% of the subscribing household are capable of receiving the required download speed (50 or 25 Mbps) at all time, the required minimal system download capacities, CCri-2, to meet this criterion for all service scenarios are calculated using Eq.(2) and reported also in Table 7.
It is shown that, for the specific scenarios under consideration, Criterion-1 requires a higher capacity than Criterion-2.
The system evaluation results are reported in Table 8 to Table 13 for the six service scenarios, respectively. For each scenario, the corresponding table summarizes the Pass/Fail results and the capability scores for four different LTE deployments, two bandwidths, and against the 50/10 and 25/5 Mbps download/upload speed requirements.
The Pass/Fails results are shown in columns with headings Cri-1 and Cri-2 for Criterion-1 and Criterion-2, respectively.
3.2.3 Capability Evaluation
After the Pass/Fails tests, the two capabilities metrics, oversubscription ratio () and guaranteed household percentage (GHP) achieving target download speed (ZDL) are calculated using Eq. (4) and (6) for both 50 Mbps and 25 Mbps download speed requirements. The capability scores are reported in Tables 8-11 below in the columns with heading and respectively ZDL.
Scenarios 1 (Scn-1) and 2 (Scn-2) consider a relatively light population density, with 50 subscribing households per cell. Scn-1 considers a QoS of 720p video streaming per household with some other medium intensity internet activities, and Scn-2 considers a higher QoS of 1080p video streaming per household with some other medium intensity internet activities. The system evaluation results are reported in Table 8 and Table 9.
It can be observed that for Scn-1 and Scn-2, all LTE deployments considered are successful at the Pass/Fail test. However, different deployments achieve significantly different capability scores.
For the current CRTC requirement of 50 Mbps download speed, the oversubscription ratio () varies from 8.3 to 1.55, the lower the better for consumers but also more expensive for operators; while the guaranteed household percentage for 50 Mbps (ZDL) download speed varies from as low as 0.1% to as high as 62%, the higher the better for consumers.
| Deploy ment | Max. Mod. | Max. MIMO | BW [MHz] | Sys. Cap. [Mbps] | 50/10 Mbps | 25/5 Mbps | ||||||
|---|---|---|---|---|---|---|---|---|---|---|---|---|
| Cri-1 | Cri-2 | ZDL | Cri-1 | Cri-2 | ZDL | |||||||
| No Carrier Aggregation, Bandwidth = 20 MHz | ||||||||||||
| 1 | 64QAM | 4x4 | 20 | 302 | Pass | Pass | 8.3 | 6.5% | Pass | Pass | 4.1 | 13.8% |
| 2 | 64QAM | 8x8 | 20 | 605 | Pass | Pass | 4.1 | 19% | Pass | Pass | 2.1 | 41.4% |
| 3 | 256QAM | 4x4 | 20 | 403 | Pass | Pass | 6.2 | 10.7% | Pass | Pass | 3.1 | 23% |
| 4 | 256QAM | 8x8 | 20 | 806 | Pass | Pass | 3.1 | 28% | Pass | Pass | 1.55 | 59.6% |
| Carrier Aggregation, Bandwidth = 40 MHz | ||||||||||||
| 5 | 64QAM | 4x4 | 40 | 605 | Pass | Pass | 4.1 | 19% | Pass | Pass | 2.1 | 41.4% |
| 6 | 64QAM | 8x8 | 40 | 1210 | Pass | Pass | 2.1 | 45% | Pass | Pass | 1.0 | 96.4% |
| 7 | 256QAM | 4x4 | 40 | 806 | Pass | Pass | 3.1 | 28% | Pass | Pass | 1.55 | 59.6% |
| 8 | 256QAM | 8x8 | 40 | 1612 | Pass | Pass | 1.55 | 62% | Pass | Pass | 0.78 | 133% |
| Deploy ment | Max. Mod. | Max. MIMO | BW [MHz] | Sys. Cap. [Mbps] | 50/10 Mbps | 25/5 Mbps | ||||||
|---|---|---|---|---|---|---|---|---|---|---|---|---|
| Cri-1 | Cri-2 | ZDL | Cri-1 | Cri-2 | ZDL | |||||||
| No Carrier Aggregation, Bandwidth = 20 MHz | ||||||||||||
| 1 | 64QAM | 4x4 | 20 | 302 | Pass | Pass | 8.3 | 0.1% | Pass | Pass | 4.1 | 0.2% |
| 2 | 64QAM | 8x8 | 20 | 605 | Pass | Pass | 4.1 | 1.4% | Pass | Pass | 2.1 | 32.1% |
| 3 | 256QAM | 4x4 | 20 | 403 | Pass | Pass | 6.2 | 4.7% | Pass | Pass | 3.1 | 10.8% |
| 4 | 256QAM | 8x8 | 20 | 806 | Pass | Pass | 3.1 | 23% | Pass | Pass | 1.55 | 53.3% |
| Carrier Aggregation, Bandwidth = 40 MHz | ||||||||||||
| 5 | 64QAM | 4x4 | 40 | 605 | Pass | Pass | 4.1 | 14% | Pass | Pass | 2.1 | 32.1% |
| 6 | 64QAM | 8x8 | 40 | 1210 | Pass | Pass | 2.1 | 41% | Pass | Pass | 1.0 | 95.8% |
| 7 | 256QAM | 4x4 | 40 | 806 | Pass | Pass | 3.1 | 23% | Pass | Pass | 1.55 | 53.3% |
| 8 | 256QAM | 8x8 | 40 | 1612 | Pass | Pass | 1.55 | 59.6% | Pass | Pass | 0.78 | 138% |
The guaranteed household percentage GHP is a better metric than the oversubscription ratio since it also shows the capability of the different LTE deployments to support the different QoS per household.
When all else is equal, the required download speed is reduced by half, i.e., 25 Mbps, the oversubscription ratio is also reduced by half. The guaranteed household percentage achieving this download speed is more than double of that for the 50 Mbps. This is a much easier target for the system to achieve.
Table 10 and Table 11 show the evaluation results for Scn-3 and Scn-4 with a higher population density of 100 subscribing households per cell, where Scn-3 considers a QoS of 720p and Scn-4 of 1080p
For Scn-3, while all the deployments pass the Pass/Fail test, their capability results are significantly lower than those for the lower subscribing population density Scn-1 and Scn-2.
For Scn-4, i.e., a higher subscribing population and a higher QoS requirement, two LTE deployments (1 and 3) fail the Pass/Fail test, which are reported in rows with red-colored font. Correspondingly, the capability metric in terms of the guaranteed household percentage of these two deployments are set to zero.
| Deploy ment | Max. Mod. | Max. MIMO | BW [MHz] | Sys. Cap. [Mbps] | 50/10 Mbps | 25/5 Mbps | ||||||
|---|---|---|---|---|---|---|---|---|---|---|---|---|
| Cri-1 | Cri-2 | ZDL | Cri-1 | Cri-2 | ZDL | |||||||
| No Carrier Aggregation, Bandwidth = 20 MHz | ||||||||||||
| 1 | 64QAM | 4x4 | 20 | 302 | Pass | Pass | 16.6 | 0.04% | Pass | Pass | 8.3 | 0.09% |
| 2 | 64QAM | 8x8 | 20 | 605 | Pass | Pass | 8.3 | 6.5% | Pass | Pass | 4.1 | 13.9% |
| 3 | 256QAM | 4x4 | 20 | 403 | Pass | Pass | 12.4 | 2.2% | Pass | Pass | 6.2 | 4.7% |
| 4 | 256QAM | 8x8 | 20 | 806 | Pass | Pass | 6.2 | 11% | Pass | Pass | 3.1 | 23% |
| Carrier Aggregation, Bandwidth = 40 MHz | ||||||||||||
| 5 | 64QAM | 4x4 | 40 | 605 | Pass | Pass | 8.3 | 6.5% | Pass | Pass | 4.1 | 13.9% |
| 6 | 64QAM | 8x8 | 40 | 1210 | Pass | Pass | 4.1 | 19.4% | Pass | Pass | 2.1 | 41.4% |
| 7 | 256QAM | 4x4 | 40 | 806 | Pass | Pass | 6.2 | 11% | Pass | Pass | 3.1 | 23% |
| 8 | 256QAM | 8x8 | 40 | 1612 | Pass | Pass | 3.1 | 28% | Pass | Pass | 1.55 | 59.6% |
| Deploy ment | Max. Mod. | Max. MIMO | BW [MHz] | Sys. Cap. [Mbps] | 50/10 Mbps | 25/5 Mbps | ||||||
|---|---|---|---|---|---|---|---|---|---|---|---|---|
| Cri-1 | Cri-2 | ZDL | Cri-1 | Cri-2 | ZDL | |||||||
| No Carrier Aggregation, Bandwidth = 20 MHz | ||||||||||||
| 1 | 64QAM | 4x4 | 20 | 302 | Fail | Pass | 16.6 | 0 | Fail | Pass | 8.3 | 0 |
| 2 | 64QAM | 8x8 | 20 | 605 | Pass | Pass | 8.3 | 0.11% | Pass | Pass | 4.1 | 0.26% |
| 3 | 256QAM | 4x4 | 20 | 403 | Fail | Pass | 12.4 | 0 | Fail | Pass | 6.2 | 0 |
| 4 | 256QAM | 8x8 | 20 | 806 | Pass | Pass | 6.2 | 4.5% | Pass | Pass | 3.1 | 10.8% |
| Carrier Aggregation, Bandwidth = 40 MHz | ||||||||||||
| 5 | 64QAM | 4x4 | 40 | 605 | Pass | Pass | 8.3 | 0.11% | Pass | Pass | 4.1 | 0.26% |
| 6 | 64QAM | 8x8 | 40 | 1210 | Pass | Pass | 4.1 | 13.9% | Pass | Pass | 2.1 | 32.1% |
| 7 | 256QAM | 4x4 | 40 | 806 | Pass | Pass | 6.2 | 4.68% | Pass | Pass | 3.1 | 10.8% |
| 8 | 256QAM | 8x8 | 40 | 1612 | Pass | Pass | 3.1 | 23% | Pass | Pass | 1.55 | 53.3% |
Table 12 and Table 13 show the evaluation results for Scn-5 and Scn-6 with a higher population density of 200 subscribing households per cell, where Scn-5 considers a QoS of 720p and Scn-6 of 1080p. Following the same trend, more LTE deployments fail the eligibility assessment.
| Deploy ment | Max. Mod. | Max. MIMO | BW [MHz] | Sys. Cap. [Mbps] | 50/10 Mbps | 25/5 Mbps | ||||||
|---|---|---|---|---|---|---|---|---|---|---|---|---|
| Cri-1 | Cri-2 | ZDL | Cri-1 | Cri-2 | ZDL | |||||||
| No Carrier Aggregation, Bandwidth = 20 MHz | ||||||||||||
| 1 | 64QAM | 4x4 | 20 | 302 | Fail | Fail | 33.1 | 0 | Fail | Pass | 16.6 | 0 |
| 2 | 64QAM | 8x8 | 20 | 605 | Pass | Pass | 16.5 | 0.05% | Pass | Pass | 8.3 | 0.11% |
| 3 | 256QAM | 4x4 | 20 | 403 | Fail | Fail | 24.8 | 0 | Fail | Pass | 12.4 | 0 |
| 4 | 256QAM | 8x8 | 20 | 806 | Pass | Pass | 12.4 | 2.2% | Pass | Pass | 6.2 | 4.7% |
| Carrier Aggregation, Bandwidth = 40 MHz | ||||||||||||
| 5 | 64QAM | 4x4 | 40 | 605 | Pass | Pass | 16.6 | 0.05% | Pass | Pass | 8.3 | 0.11% |
| 6 | 64QAM | 8x8 | 40 | 1210 | Pass | Pass | 8.3 | 6.5% | Pass | Pass | 4.1 | 13.9% |
| 7 | 256QAM | 4x4 | 40 | 806 | Pass | Pass | 12.4 | 2.2% | Pass | Pass | 6.2 | 4.7% |
| 8 | 256QAM | 8x8 | 40 | 1612 | Pass | Pass | 6.2 | 10.8% | Pass | Pass | 3.1 | 23% |
| Deploy ment | Max. Mod. | Max. MIMO | BW [MHz] | Sys. Cap. [Mbps] | 50/10 Mbps | 25/5 Mbps | ||||||
|---|---|---|---|---|---|---|---|---|---|---|---|---|
| Cri-1 | Cri-2 | ZDL | Cri-1 | Cri-2 | ZDL | |||||||
| No Carrier Aggregation, Bandwidth = 20 MHz | ||||||||||||
| 1 | 64QAM | 4x4 | 20 | 302 | Fail | Fail | 33.1 | 0 | Fail | Pass | 16.6 | 0 |
| 2 | 64QAM | 8x8 | 20 | 605 | Fail | Pass | 16.5 | 0 | Fail | Pass | 8.3 | 0 |
| 3 | 256QAM | 4x4 | 20 | 403 | Fail | Fail | 24.8 | 0 | Fail | Pass | 12.4 | 0 |
| 4 | 256QAM | 8x8 | 20 | 806 | Fail | Pass | 12.4 | 0 | Fail | Pass | 6.2 | 0 |
| Carrier Aggregation, Bandwidth = 40 MHz | ||||||||||||
| 5 | 64QAM | 4x4 | 40 | 605 | Fail | Pass | 16.6 | 0 | Fail | Pass | 8.3 | 0 |
| 6 | 64QAM | 8x8 | 40 | 1210 | Pass | Pass | 8.3 | 0.1% | Pass | Pass | 4.1 | 0.3% |
| 7 | 256QAM | 4x4 | 40 | 806 | Fail | Pass | 12.4 | 0 | Fail | Pass | 6.2 | 0 |
| 8 | 256QAM | 8x8 | 40 | 1612 | Pass | Pass | 6.2 | 4.7% | Pass | Pass | 3.1 | 10.8% |
Especially for Scn-6 with the higher quality requirement, all example LTE deployments with 20 MHz bandwidth failed the Criterion-I and are deemed not capable of providing 50/10 Mbps download/upload speed requirements. For this scenario, using more spectrum becomes necessary.
However, it needs to be pointed out that 200 households per cell is a quite high device density, more typical for mobile broadband systems (as opposed to4 Conclusions
This technical report proposes a generic methodology and a set of criteria to quantitatively evaluate the capability of Fixed Wireless Access (FWA) systems to deliver broadband internet access service meeting a specific set of download/upload speed requirements, Mbps, where take values of 50/10 for the current CRTC requirements.
The proposed methodology serves to:
- determine if an FWA system is capable of delivering high-quality broadband internet access service over a coverage area, especially for rural and remote areas in Canada;
- measure to what extend an FWA system could deliver the target Mbps download/upload speed requirements to the subscribing households in a specific geographic area.
The proposed method relies on a number of assumptions stated in this report on the level of minimal service quality (QoS) and the system's capability to achieve peak capacity. Such assumptions will inevitably evolve with advancement of wireless technologies and increasing demand of internet applications for higher internet access speed.
References
[1]. Telecom Regulatory Policy CRTC 2016-496, "Modern telecommunications services – The path forward for Canada's digital economy," CRTC, Dec. 21, 2016. [https://crtc.gc.ca/eng/archive/2016/2016-496.htm]
[2]. Telecom Decision CRTC 2018-241, "CISC Network Working Group – Non-consensus report on quality of service metrics to define high-quality fixed broadband Internet access service," CRTC, July 13, 2018. [https://crtc.gc.ca/eng/archive/2018/2018-241.htm]
[3]. Telecom Regulatory Policy CRTC 2019-42, "Establishment of an appropriate quality of service metric for jitter to define high-quality fixed broadband Internet access service," CRTC, Feb. 12, 2019. [https://crtc.gc.ca/eng/archive/2019/2019-42.htm]
[4]. "Rural Opportunity, National Prosperity: An Economic Development Strategy for Rural Canada," Infrastructure Canada, June 2019. [https://www.infrastructure.gc.ca/rural/strat-eng.html]
[5]. "Building a Better Canada: Universal High-Speed Internet," Department of Finance Canada, 2019. [https://www.budget.gc.ca/2019/docs/nrc/infrastructure-infrastructures-internet-en.pdf]
[6]. LTE peak throughput calculator https://5g-tools.com/4g-lte-throughput-calculator/
Annex I: CRTC Determinations on Fixed Residential Broadband Access
- [2016-496] Canadian residential and business fixed broadband Internet access service subscribers should be able to access speeds of at least 50 megabits per second (Mbps) download and 10 Mbps upload, and to subscribe to a service offering with an unlimited data allowance.
- [2016-496] 80. In light of all the above, the Commission establishes the following criterion to assess whether the broadband portion of the universal service objective is achieved: Canadian residential and business fixed broadband Internet access service subscribers can access speeds of at least 50 Mbps download and 10 Mbps upload.
- [2016-496] 81. These speeds are to be the actual speeds delivered, not merely those advertised. That stated, the Commission recognizes that the broadband Internet access service speeds actually experienced by users are affected by a wide range of factors, some of which are outside the control of the network provider.
- [2016-496] 97. In light of the above, the Commission establishes the following criterion to assess whether the broadband portion of the universal service objective is achieved: Canadian residential and business customers can subscribe to fixed broadband Internet access service that includes the option of unlimited data allowance.
- [2016-496] For mobile wireless broadband Internet access: LTE technology is currently the latest generally deployed mobile wireless technology and is available to 97% of the population. However, many factors can uniquely affect the performance of mobile wireless broadband Internet access service, such as the terrain, spectrum, distance from the antenna, weather, type of device, and number of end-users connected to the network at any one time. As a result, the Commission specifies below the mobile wireless technology to which Canadians should have access as a measure of achievement of the broadband portion of the universal service objective.
- [2016-496] Many of Canada's trading partners, such as the United States and members of the European Commission, are implementing digital strategies to achieve download speeds of 50 Mbps or more within the next few years to enhance network infrastructures and to meet the growing demand for higher Internet speeds.
- [2016-496] A comprehensive solution to affordability issues will require a multi-faceted approach, including the participation of other stakeholders. In this regard, the record of this proceeding demonstrates that various stakeholders, including ISPs and community organizations, have begun to implement innovative solutions to meet the wide-ranging needs of lower-income consumers. The Commission is mindful that its regulatory frameworks should be sufficiently flexible to allow for such solutions and does not want to take regulatory action that would inadvertently hinder the development of further private and public sector initiatives.
- [2018-241] 19. The Commission launched the Broadband Measurement Project in 2015 to objectively measure broadband Internet performance in Canadian homes. This Project is a collaboration between the Commission and major Canadian ISPs. SamKnows conducted the broadband QoS measurement study in Canada on behalf of the Commission, and submitted two broadband measurement reports (one in December 2016 and one in April 2016) [hereafter, "the broadband measurement reports"].
- [2018-241] 20. While the primary focus of the Broadband Measurement Project is to measure actual Internet connection speeds, ISPs' performance data (latency, packet loss, and jitter) are also measured. In its CRTC Three-Year Plan 2017-2020, the Commission indicated that it would continue to collect performance data from participants and expand the Project to include more ISPs and performance measurement parameters.
- [2018-241] [59] The Commission considers that high-quality fixed broadband Internet access service should be able to support QoS-critical applications. These applications are important in today's digital economy, in which most online and even some offline services are being offered using an online cloud-based model. In addition, fixed broadband Internet access service that supports QoS-critical applications can support important services, such as e-health, remote surgery, online education, teleconferencing, and teleworking through virtual private network access.
- [2018-241] 60. The QoS metrics required to support QoS-critical applications should therefore serve as the minimum thresholds to define high-quality fixed broadband Internet access service. Accordingly, the Commission determines that fixed broadband Internet access service is defined as a high-quality service if it provides the subscriber with a smooth experience when using real-time QoS-critical applications.
- [2018-241] 70. The Commission considers that CIRA et al.'s recommended threshold of 50 ms most closely aligns with the Commission's intentions based on evidence showing that this threshold is reasonable and achievable, and that it can support QoS-critical applications. As well, the broadband measurement reports indicate that the highest average peak period latency measured from subscribers of the major ISPs in Canada was below 22 ms for digital subscriber line (DSL), cable, and fibre-to-the-home (FTTH) technologies.
- [2018-241] 71. In light of all the above, the Commission establishes a round-trip latency threshold of 50 ms to define high-quality fixed broadband Internet access service and to measure the successful achievement of the broadband portion of the universal service objective. As mentioned above, this threshold is based on measurement during peak times (i.e. from 7 p.m. to 11 p.m. local time on weekdays), and from the modem in the customer premises to an IXP in a Canadian Tier 1 city.
- [2019-42] 23. Accordingly, the Commission considers that 5 ms is an appropriate jitter threshold to support QoS-critical applications and define high-quality fixed broadband Internet access service to meet the broadband portion of the universal service objective.
- [2019-42] 24. In light of all the above, the Commission sets a threshold for jitter of 5 ms to define high-quality fixed broadband Internet access service to meet the broadband portion of the universal service objective. As previously determined, this threshold would be measured during peak times (i.e. from 7 p.m. to 11 p.m. local time on weekdays), and from the modem at the customer premises to a server located off-net at the Internet exchange point in a Canadian Tier 1 city.
Annex II: LTE Cell Peak Capacity
LTE FDD Systems
| Modulation | MIMO | Bandwidth | |||
|---|---|---|---|---|---|
| 5 MHz | 10 MHz | 20 MHz | 40 MHz with CA | ||
| 16-QAM | SISO | 13 | 25 | 50 | 100 |
| 2x2 | 25 | 50 | 101 | 202 | |
| 4x4 | 50 | 101 | 202 | 403 | |
| 64-QAM | SISO | 19 | 38 | 76 | 152 |
| 2x2 | 38 | 76 | 151 | 302 | |
| 4x4 | 76 | 151 | 302 | 604 | |
| 8x8 (DL only) | 151 | 302 | 605 | 1210 | |
| 256-QAM | SISO (DL only) | 25 | 50 | 101 | 202 |
| 2x2 (DL only) | 50 | 101 | 202 | 403 | |
| 4x4 (DL only) | 101 | 202 | 403 | 806 | |
| 8x8 (DL only) | 202 | 403 | 806 | 1612 | |
* Source: https://5g-tools.com/4g-lte-throughput-calculator/
LTE TDD Systems
| Modulation | MIMO | Bandwidth | |||
|---|---|---|---|---|---|
| 5 MHz | 10 MHz | 20 MHz | 40 MHz with CA | ||
| 16-QAM | SISO | 9/3 | 19/5 | 37/11 | 75/22 |
| 2x2 | 19/5 | 37/11 | 75/22 | 149/43 | |
| 4x4 | 37/11 | 75/22 | 149/43 | 298/86 | |
| 64-QAM | SISO | 14/4 | 28/8 | 56/16 | 112/32 |
| 2x2 | 28/8 | 56/16 | 112/32 | 224/65 | |
| 4x4 | 56/16 | 112/32 | 224/65 | 448/130 | |
| 8x8 (DL only) | 112/- | 224/- | 448/- | 895/- | |
| 256-QAM | SISO (DL only) | 19/- | 37/- | 75/- | 149/- |
| 2x2 (DL only) | 37/- | 75/- | 149/- | 298/- | |
| 4x4 (DL only) | 75/- | 149/- | 298/- | 597/- | |
| 8x8 (DL only) | 149/- | 298/- | 597/- | 1193/- | |
* Source: https://5g-tools.com/4g-lte-throughput-calculator/