
View as PDF (PDF: 5.4 MB; 54 pages)

IP Canada Report 2019
Acknowledgments
Elias Collette, Chief of Economic Research and Strategic Analysis, Canadian Intellectual Property Office
Diego Santilli, Senior Economist, Canadian Intellectual Property Office
Contact Information
For more information on the research included in this report, please contact CIPO-IPResearch@canada.ca.
The fourth report in a series of annual intellectual property (IP) reports that presents current statistics and trends on the use of the IP system in Canada and the global IP system by Canadians.
Message from the CEO
Message from the CEO
The 2019 IP Canada Report is the fourth in an annual series that presents current statistics and trends around the use of intellectual property (IP) in Canada, and internationally by Canadians. This year's report also features an analysis based on the results of the 2017 Survey on Financing and Growth of Small and Medium Enterprises, and an overview of patenting activity in the agri-food processing sector. Research conducted at the Canadian Intellectual Property Office (CIPO) educates both policy makers and the public on important trends in the use of IP.
In the past twelve months, Canada has implemented five international IP treaties. In November 2018, Canada implemented the Hague Agreement for industrial designs; in June 2019, Canada brought into force three international trademark treaties: the Madrid Protocol, the Singapore Treaty and the Nice Agreement; and on , the Patent Law Treaty will come into force in Canada. International IP treaties connect Canada's IP system to the world, helping business get reliable, high-quality IP rights more easily in multiple countries and markets. Future research at CIPO will look at the trends in IP use stemming from the implementation of these treaties.
CIPO also promotes IP literacy in Canada through our IP Awareness and Education Program. The program, which launched two and a half years ago, delivers tools and resources to help businesses better understand their IP and unlock its value.
This report provides important insights into IP and how it supports Canadian innovation. Understanding how Canadians use IP is an important priority for our office and we will continue our efforts to help make Canada a global centre for innovation.
Johanne Bélisle
Commissioner of Patents, Registrar of Trademarks and Chief Executive Officer
About us
About us
The Canadian Intellectual Property Office (CIPO), a Special Operating Agency of Innovation, Science and Economic Development Canada (ISED), is responsible for the administration and processing of intellectual property in Canada. CIPO contributes to Canada's innovation and economic success by providing greater certainty in the marketplace through high-quality and timely IP rights; fostering and supporting invention and creativity through knowledge sharing; raising awareness to encourage innovators to better exploit IP; helping businesses compete globally through international cooperation and the promotion of Canada's IP interests; and administering Canada's IP system and office efficiently and effectively.Footnote 1
Our five-year business strategy:Footnote 2
 Advance innovation
- Harmonize Canada's IP system with international standards to support businesses operating globally
- Strengthen global collaboration to advance Canadian interests
- Modernize Canada's IP framework to support innovation

 Deliver quality and timely IP rights
- Provide IP rights and services that reflect client expectations, market needs and respect the public interest
- Be recognized as a quality-based organization
- Modernize our practices, processes and tools

 Build IP awareness and education
- Deliver an enhanced IP awareness and education program
- Expand our presence and partnerships in innovation-focussed networks and communities

 Offer a modern service experience
- Provide a consistent and client-centric service experience
- Enhance our web presence, promote self-service and improve online transactions
- Improve access to our IP data

 Foster an agile and high-performing organization
- Attract, retain and develop a highly skilled and engaged workforce
- Optimize our work environment and integrate new business and technological solutions
- Strengthen management excellence
Executive summary
Executive summary
Canada is a major destination and source of IP rights, with almost 150,000 applications coming to CIPO and going out of Canada annually (for patents, trademarks, and industrial designs). The IP Canada Report presents trends and research in IP usage both in Canada and by Canadians globally, using data from CIPO and the World Intellectual Property Organization (WIPO).
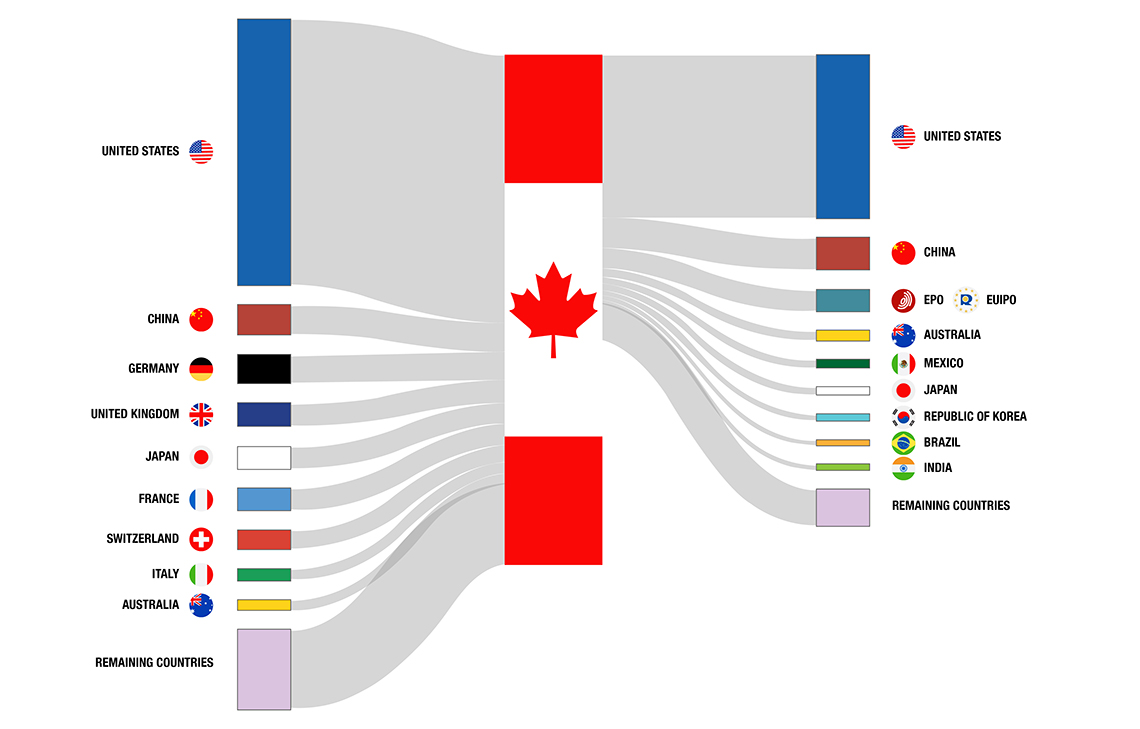
Figure 1 - Text version
Figure 1 is a Sankey diagram which maps the flow of IP applications into Canada by origin and out of Canada by destination. The centre of the diagram shows the Canadian flag, with IP applications to Canada on the left side and IP applications from Canada on the right side. Each side shows flow bars for the top nine filing origins or destinations, as well as a flow bar for all remaining countries combined. The width of the flow bars is proportional to the number of IP applications to or from that country.
Annual growth in most IP categories, impressive long-term growth in trademarks
IP activity continues to grow both in Canada and by Canadians internationally. In 2018, CIPO received applications for 36,162 patents, 63,059 trademarks and 6,568 industrial designs. Patent applications grew 3% at CIPO, including a 7% increase in resident filings, while trademark filings grew 7% and industrial design applications grew marginally. Trademark filings abroad by Canadians saw strong growth of 17% in 2017, with 19,808 applications. Canadians filed 19,448 patent applications abroad in 2017, a 2% decline, and 1,436 industrial design applications, a 4% decline.
Long-term trends show a consistent growth in trademark filings both at CIPO and by Canadians to international destinations. Trademark applications at CIPO grew by 54% between 2009 and 2018, though 2009 was a temporary low year for filings due to the 2008 financial crisis. Meanwhile, filings abroad by Canadians grew 66% from 2008–2017. Growth in trademark filings underscores the importance of brand recognition in the Canadian and global markets. Trends for patents and industrial designs have been relatively stagnant since 2010, except for non-resident industrial designs, which have grown consistently over the last ten years.
The impact of IP on small and medium enterprises
Research presented in this report explores the relationship between IP awareness and holdings on the business activities of small and medium enterprises (SMEs), using data from ISED's 2017 Survey on Financing and Growth of Small and Medium Enterprises. Data from this survey indicate that businesses that have higher awareness of IP along with those that hold formal IP are much more likely to experience higher growth, expand their markets, and receive various types of financing.
Patenting in agri-food and fish processing
This report also examines patenting in the Canadian fisheries subsector of the agri-food industry, using data from Clarivate Analytics' Derwent Innovation database.Footnote 3 Since 2000, groups of individuals have been responsible for most of the innovation in the area of processing rather than large organizations like universities and corporations. Many of these innovations originate in the Atlantic provinces, reflecting the obvious importance of this region to the fishing industry, further explored in this report.
Introduction
Introduction
The 2019 IP Canada Report is the fourth report in an annual series that presents trends and research in IP usage, both in Canada and by Canadians globally. The first three sections of this report present the most current data on applications for patents, trademarks and industrial designs, respectively. CIPO provides data for the most recent year (2018) of IP activity in Canada. International data come from WIPO's Statistics Data Center.Footnote 4 International data lag domestic data by one year due to the time needed to compile data across all WIPO members; accordingly, data for filings outside of Canada are available only up to 2017.
CIPO administers three other forms of IP that are not included in this report. CIPO administers copyrights, integrated circuit topographies, and geographical indications (GI). Copyright does not need to be registered to be enforceable in Canada,Footnote 5 so formal data do not fully encompass its usage. Integrated circuit topographies refer to the three-dimensional configurations of electronic circuits embodied in integrated circuit products or layout designsFootnote 6 and are not included due to a lack of readily accessible data on domestic and international activity. A GI can identify a wine or spirit, or an agricultural product or food of a category set out in the Trademarks Act. CIPO is responsible for processing requests for protection of GIs and ensuring that they are entered on the list of protected GIs maintained by the Registrar. Plant breeders' rights protect new varieties of plants in a similar fashion to patents and are administered by the Canada Food Inspection Agency.Footnote 7
Canadians across both public and private sectors recognize the importance of IP to further economic prosperity. Though Canada performs relatively well on innovation, ranking 17th in WIPO's Global Innovation Index 2019, our innovation input rank (9th) exceeds our innovation output rank (22th) substantially.Footnote 8 IP rights like patents, trademarks, and industrial designs are central to a country's innovation output. Patents incentivize innovation by giving owners exclusive rights to control the usage of their processes and technologies. Trademarks allow business owners to protect their unique branding, helping them distinguish their products and services in the marketplace and profit from their good reputation. Industrial designs protect the unique aesthetic features of products, which can give them a competitive edge in the marketplace. Growing the use of IP rights by Canadians—both domestically and abroad—is critical for success in an increasing intangibles-driven economy.
Advancing innovation through a modern IP framework and strong international collaboration is one of CIPO's main strategic priorities.Footnote 9 CIPO has worked diligently in recent years to implement five international treaties to support the future use of IP in Canada and abroad by Canadians. In November 2018, Canada acceded to the Hague Agreement for industrial designs, and in 2019, Canada brought into force three trademark treaties (the Madrid Protocol, the Singapore Treaty, and the Nice Agreement) and the Patent Law Treaty.Footnote 10 These treaties aim to reduce administrative burden, harmonize administrative procedures, and provide Canadians with a faster, simpler, and more cost-effective way of protecting their IP in multiple countries.
While long-term trends show important growth for Canadian trademark rights, patent and industrial design rights remain relatively stagnant. However, patenting in Canada did show positive signs in 2018, particularly resident filings, with the largest annual growth rate in over a decade. In addition to recent data and trends in the three main IP rights, this report also presents research on the use of IP by SMEs in Canada, and how that relates to business outcomes. These data come from the 2017 Survey on Financing and Growth of Small and Medium Enterprises. They convey interesting findings about the benefits of IP awareness and use on outcomes related to growth, financing and market expansion. Also highlighted in this report are findings from IP analytics research into the agri-food and fish processing industries in Canada and globally.
Patents
Patents
Patents incentivize innovation by providing a time-limited, legally protected, exclusive right to make, use, and sell an invention. In 2018, patent filings at CIPO totalled 36,162 applications, growing 3% over the previous year. Resident filings grew by 7%, their largest growth in over a decade, with 4,348 applications, while non-resident filings totalled 31,814 applications. Though long-term trends still show that Canadian filings have declined by 14% since 2009, filings abroad by Canadians grew 14% from 2008 to 2017, with 19,448 applications to foreign patent offices in 2017.
Patent Applications Filed in Canada
CIPO received 36,162 patent applications in 2018, with the top six countries of origin presented in Figure 2. Given that Canada is a small open economy, resident filings account for only 12% of filings at CIPO. The United States is the largest origin of non-resident applications at CIPO, with 16,464 applications and accounting for 46% of those filings. The remaining top four origins of non-resident filings at CIPO in 2018 include Germany (2,152 applications), Japan (1,851), France (1,424) and Switzerland (1,362). The top five foreign origins account for 73% of non-resident applications at CIPO and 64% of total applications.
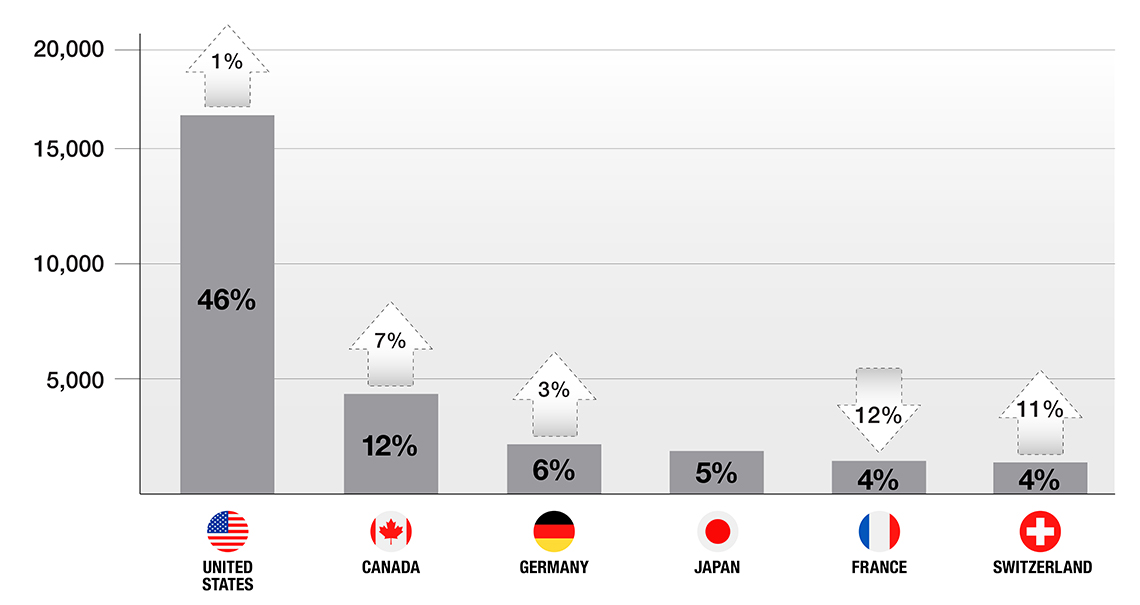
Figure 2 - Text version
| Country of origin | Number of Patents | Share of total | Year over year percentage change |
|---|---|---|---|
| United States | 16,464 | 46% | 1% |
| Canada | 4,348 | 12% | 7% |
| Germany | 2,152 | 6% | 3% |
| Japan | 1,851 | 5% | 0% |
| France | 1,424 | 4% | -12% |
| Switzerland | 1,362 | 4% | 11% |
Patent applications at CIPO showed encouraging growth in 2018, particularly for residents, after a decade of relative stagnation. Figure 3 shows patent applications broken down by residency status from 2009 to 2018. In 2018, CIPO received 4,348 applications from residents, a 7% increase from the previous year, and 31,814 applications from non-residents, a 3% increase. The 36,162 applications in 2018 represent a 3% growth from the previous year. Total applications are still down 4% since 2009, with resident applications 14% below 2009 levels and non-resident applications 2% below those from ten years ago.
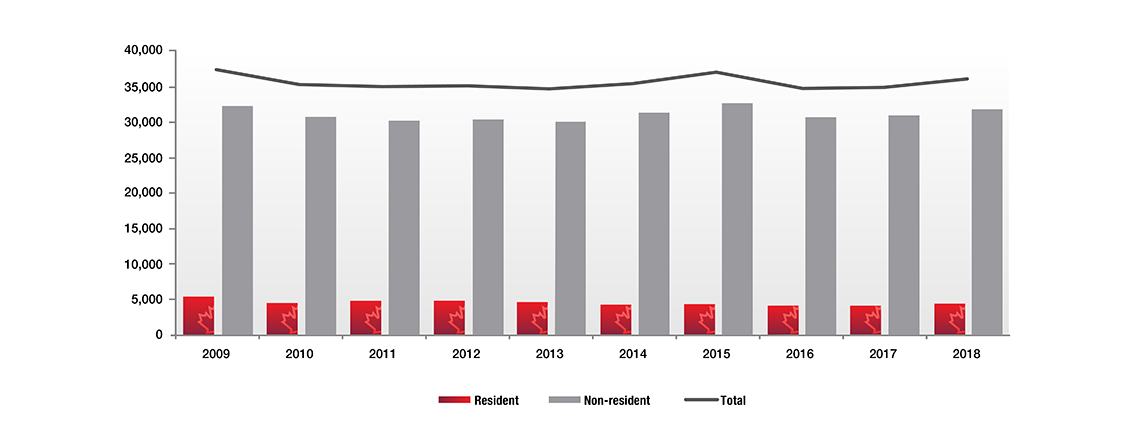
Figure 3 - Text version
| Year | Resident | Non-resident | Total |
|---|---|---|---|
| 2009 | 5,067 | 32,410 | 37,477 |
| 2010 | 4,550 | 30,899 | 35,449 |
| 2011 | 4,754 | 30,357 | 35,111 |
| 2012 | 4,709 | 30,533 | 35,242 |
| 2013 | 4,567 | 30,174 | 34,741 |
| 2014 | 4,198 | 31,283 | 35,481 |
| 2015 | 4,277 | 32,687 | 36,964 |
| 2016 | 4,078 | 30,667 | 34,745 |
| 2017 | 4,053 | 30,969 | 35,022 |
| 2018 | 4,348 | 31,814 | 36,162 |
Figure 4 shows applications at CIPO by filing route. Applicants can file either directly to CIPO or using the Patent Cooperation Treaty (PCT) System, which allows applicants to designate multiple signatory countries in a single application.Footnote 11 CIPO received 7,765 direct applications in 2018 and 28,397 PCT applications. The share of PCT applications has trended upwards since 2009, as can be seen in the figure below, accounting for about 79% of total filings to the office in 2018, up from 75% in 2009.
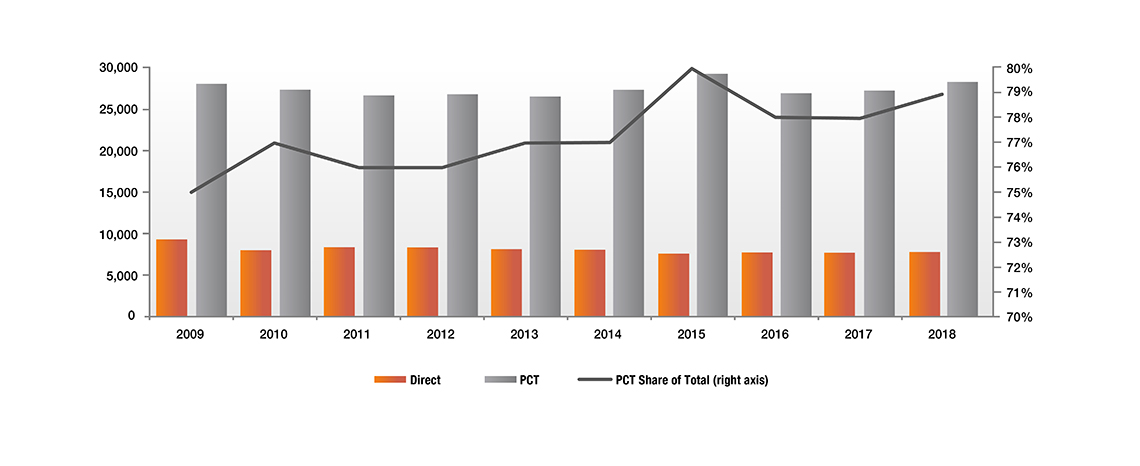
Figure 4 - Text version
| Year | Direct | PCT | PCT Share of Total |
|---|---|---|---|
| 2009 | 9,308 | 28,169 | 75% |
| 2010 | 7,989 | 27,460 | 77% |
| 2011 | 8,352 | 26,759 | 76% |
| 2012 | 8,338 | 26,904 | 76% |
| 2013 | 8,114 | 26,627 | 77% |
| 2014 | 8,030 | 27,451 | 77% |
| 2015 | 7,571 | 29,393 | 80% |
| 2016 | 7,724 | 27,021 | 78% |
| 2017 | 7,672 | 27,350 | 78% |
| 2018 | 7,765 | 28,397 | 79% |
Patent Applications Filed Abroad by Canadians
Canadians file for patents in other jurisdictions to control the production of their inventions abroad and expand their markets. Canadians filed 4.8 times more patents abroad in 2017 than they did at CIPO, a ratio that was 3.4 times in 2008. In 2017, the United States, the European Patent Office (EPO), which includes most European countries, and China continued to be the top three international destinations for Canadians filing abroad, as seen in THE IMPACT OF IP ON FINANCING AND GROWTH OF SMALL AND MEDIUM ENTERPRISES. Together these three offices accounted for 81% of patent applications abroad by Canadians. Canadians filed many more patents in the United States than at any other office. This makes sense, as the United States remains the main partner for most Canadian businesses.Footnote 12 Patent filings in China by Canadians grew 10% from 2008 to 2017.
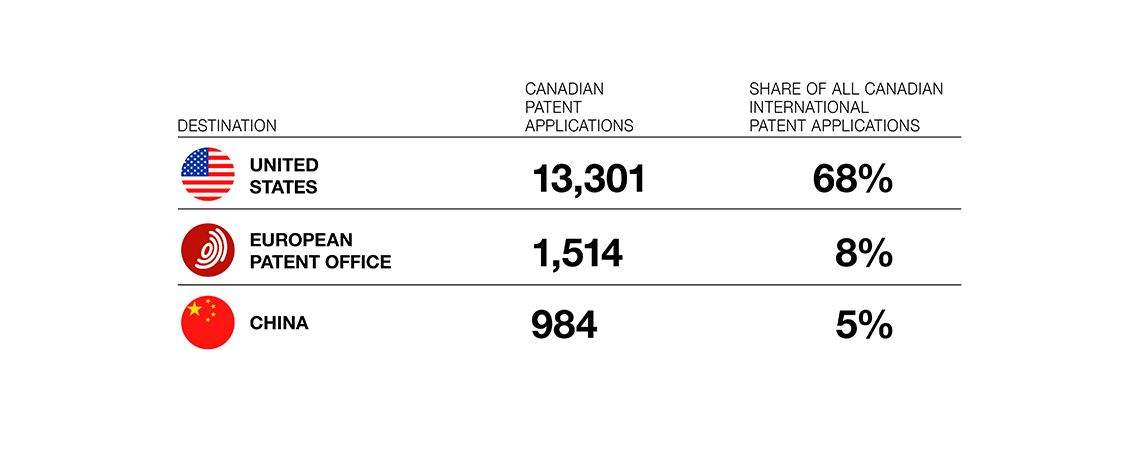
Figure 5 - Text version
| Destination | Canadian Patent Applications | Share of all Canadian International Patent Applications |
|---|---|---|
| United States | 13,301 | 68% |
| European Patent Office | 1,514 | 8% |
| China | 984 | 5% |
Figure 6 shows applications abroad by Canadians from 2008 to 2017, by filing route. Canadians filed for 19,448 patents outside of Canada in 2017: 7,312 filings via the PCT System and 12,136 direct filings. Direct and PCT filings declined by 2% each that year, but are still 14% above 2008 levels. While PCT filings grew steadily over this period by 35%, direct filings grew mainly between 2009 and 2012 before declining and then remaining flat since 2014.
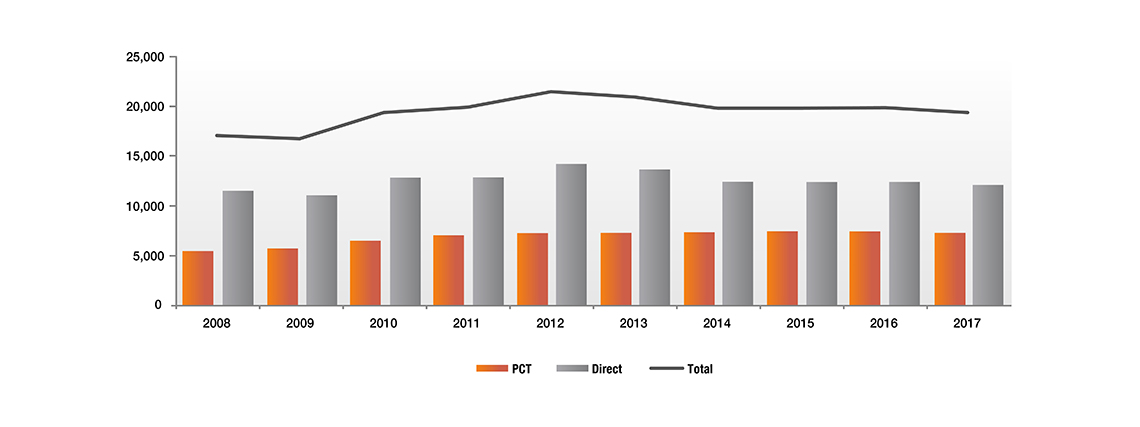
Figure 6 - Text version
| Route | 2008 | 2009 | 2010 | 2011 | 2012 | 2013 | 2014 | 2015 | 2016 | 2017 |
|---|---|---|---|---|---|---|---|---|---|---|
| Direct | 11,551 | 11,094 | 12,880 | 12,903 | 14,255 | 13,706 | 12,461 | 12,426 | 12,437 | 12,136 |
| PCT | 5,475 | 5,732 | 6,514 | 7,057 | 7,288 | 7,313 | 7,365 | 7,463 | 7,454 | 7,312 |
| Total | 17,026 | 16,826 | 19,394 | 19,960 | 21,543 | 21,019 | 19,826 | 19,889 | 19,891 | 19,448 |
Conclusion
While patent activity in Canada saw promising growth in 2018, applications in Canada and applications abroad by Canadians have generally stagnated during the last decade. The gains in patenting abroad, seen mainly in the early part of this decade, were not sustained in the years that followed, and were observed predominantly in direct filings. PCT applications abroad by Canadians grew consistently from 2008 to 2013, after which they grew only marginally before declining by 2% in 2017. In Canada, resident applications saw a promising growth of 7% in 2018, but remain 14% below 2009 levels. Non-resident filings are 2% below 2009 levels, but have also stagnated in the last decade.
Trademarks
Trademarks
Trademarks protect the words, sounds, designs, or a combination of these which businesses use to distinguish their goods and services amongst consumers.Footnote 13 In 2018, CIPO received 63,059 trademark applications: 27,321 from Canadian residents and 35,738 from non-residents. Trademark applications at CIPO and abroad by Canadians have grown steadily in the last ten years, emphasizing the importance businesses place in protecting their brands in both Canadian and international markets.
Trademark Applications Filed in Canada
Figure 7 shows the top six countries of origin for trademarks filed in Canada in 2018. Canadians continue to file the largest share at CIPO (43%), with 27,321 applications. The United States followed with 18,702 applications, then China (2,885), the United Kingdom (1,722), Germany (1,664), and France (1,502) rounding out the top five non-resident countries of origin. The largest growth has been with filings from China, with a 33% increase in 2018.

Figure 7 - Text version
| Country of origin | Number of Trademarks | Share of total | Year over year percentage change |
|---|---|---|---|
| Canada | 27,321 | 43% | 6% |
| United States | 18,702 | 30% | 9% |
| China | 2,885 | 5% | 33% |
| United Kingdom | 1,722 | 3% | 2% |
| Germany | 1,664 | 3% | 4% |
| France | 1,502 | 2% | 7% |
Figure 8 shows trademark filings in Canada by residency status from 2009 to 2018. CIPO received 63,059 trademark applications in 2018, representing 7% growth from the previous year. Non-resident applications grew 8%, with 35,738 applications in 2018, while resident filings grew by 6% in 2018. Both resident and non-resident filings have grown 54% since 2009. This strong growth is partially explained by the fact that filings in 2009 were at a low point due to the 2008 financial crisis, before recovering in 2010. Annual growth for trademark filings at CIPO has averaged 3% over the last decade.

Figure 8 - Text version
| Year | Resident | Non-resident | Total |
|---|---|---|---|
| 2009 | 18,663 | 22,293 | 40,956 |
| 2010 | 20,449 | 24,771 | 45,220 |
| 2011 | 21,337 | 27,135 | 48,472 |
| 2012 | 21,741 | 28,369 | 50,110 |
| 2013 | 21,449 | 28,370 | 49,819 |
| 2014 | 21,348 | 29,680 | 51,028 |
| 2015 | 22,589 | 29,872 | 52,461 |
| 2016 | 23,652 | 31,013 | 54,665 |
| 2017 | 25,853 | 33,060 | 58,913 |
| 2018 | 27,321 | 35,738 | 63,059 |
Trademark Applications Filed Abroad by Canadians
Trademark filings abroad by Canadians showed remarkable growth of 17% in 2017. Figure 9 shows the top destinations for Canadian trademark applicants in 2017. Canadians filed for 9,013 trademarks in the United States, 3,401 in China,Footnote 14 and 1,291 at the European Union Intellectual Property Office (EUIPO). While the United States continues to receive the largest share of filings abroad by Canadians (46%), China and the EUIPO saw substantial increases in Canadian filings, with 265% and 46% respectively, between 2008 and 2017.

Figure 9 - Text version
| Destination | Canadian Trademark Applications | Share of all Canadian International Trademark Applications |
|---|---|---|
| United States | 9,013 | 46% |
| China | 3,401 | 17% |
| European Union Intellectual Property Office | 1,291 | 7% |
Figure 10 shows Canadian trademark filings abroad and annual growth rates from 2008 to 2017. Filings by Canadians have grown consistently almost every year since the 2008 financial crisis. Trademark applications abroad by Canadians totalled 19,808 in 2017, growing by 66% since 2008.
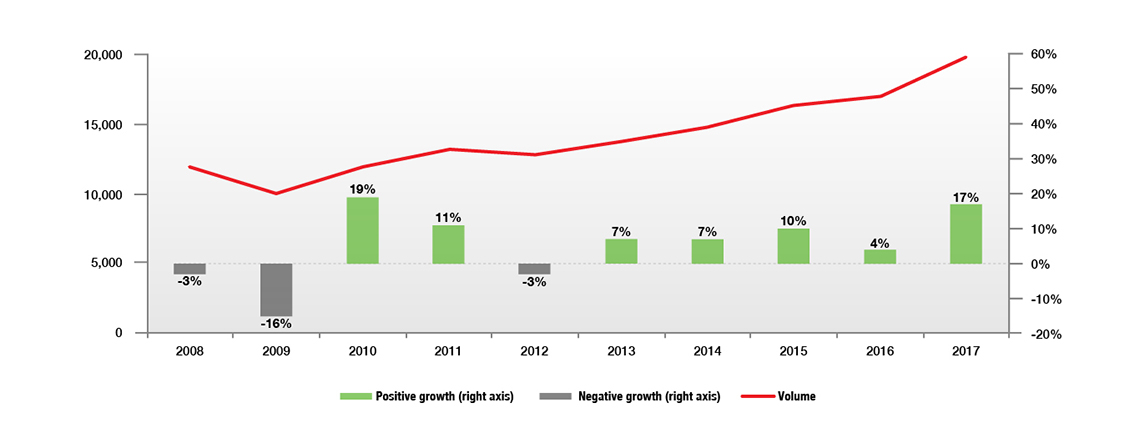
Figure 10 - Text version
| Year | Volume | Growth (right axis) |
|---|---|---|
| 2008 | 11,963 | -3% |
| 2009 | 10,057 | -16% |
| 2010 | 11,959 | 19% |
| 2011 | 13,227 | 11% |
| 2012 | 12,863 | -3% |
| 2013 | 13,781 | 7% |
| 2014 | 14,801 | 7% |
| 2015 | 16,316 | 10% |
| 2016 | 16,983 | 4% |
| 2017 | 19,808 | 17% |
Conclusion
Trademark activity continues to be the fastest‑growing form of IP, both in Canada and abroad by Canadians. Trademark filings in Canada grew 54% over the last decade and 7% in the last year alone. Applications abroad by Canadians grew 66% between 2008 and 2017.
marked the coming into force of three international trademark treaties in Canada, including the Madrid Protocol. Research from the 2018 IP Canada Report looked at the future usage of the Madrid System at CIPO and by Canadians filing abroad.Footnote 15 These treaties will make filing for trademarks in multiple jurisdictions both simpler and more cost‑effective, helping Canadians expand to new markets and promote their brands internationally.
Industrial designs
Industrial designs
Industrial design is about how something looks. It protects the visual features of shape, configuration, pattern or ornament, or any combination of these features applied to a finished article. In other words, it protects the appearance of a product. Industrial design rights are valuable intellectual property that enhance a product's distinctiveness and give the IP holder a competitive edge in the marketplace. CIPO received 6,568 applications in 2018, representing 1% growth over the previous year and 54% growth since 2009. Non-resident filings have shown substantial growth since 2009, while resident filings have been relatively stagnant. Filings for industrial designs abroad by Canadians grew 23% from 2008 to 2017, mainly due to growth in the first half of this period.
Industrial Design Applications Filed in Canada
Figure 11 shows the top countries of origin for industrial design applications at CIPO in 2018. The United States continues to file the majority of industrial design applications in Canada with 3,638 applications, representing a 55% share of the total. Canada ranks second with 760 filings and a 12% share. Japan (240), Germany and China (229 each), and the United Kingdom (173) follow respectively. The top five non‑resident filers accounted for 69% of non-resident filings in 2018.
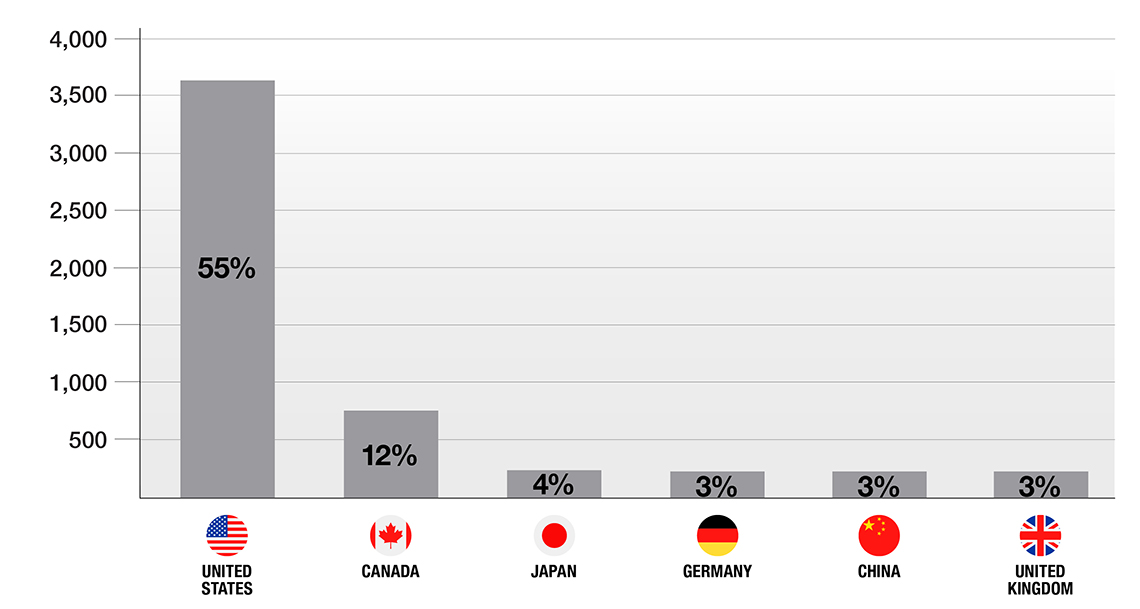
Figure 11 - Text version
| Country of Origin | Number of Industrial Designs | Share of total |
|---|---|---|
| United States | 3,638 | 55% |
| Canada | 760 | 12% |
| Japan | 240 | 4% |
| Germany | 229 | 3% |
| China | 229 | 3% |
| United Kingdom | 173 | 3% |
Figure 12 shows industrial design applications filed in Canada by residency status from 2009 to 2018. CIPO received 6,568 industrial design applications in 2018, a marginal increase over the previous year, with residents filing 760 applications and non-residents filing 5,808 applications. While non-resident filings grew substantially (69%) from 2009 to 2018, resident filings have declined by an average of 1% annually since 2010.
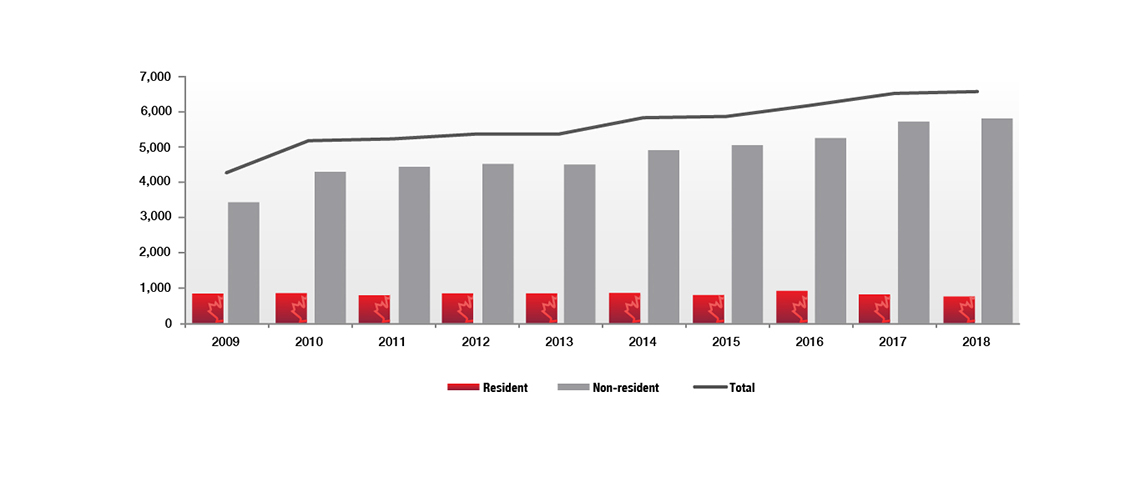
Figure 12 - Text version
| Year | Resident | Non-resident | Total |
|---|---|---|---|
| 2009 | 839 | 3,430 | 4,269 |
| 2010 | 851 | 4,291 | 5,142 |
| 2011 | 790 | 4,437 | 5,227 |
| 2012 | 847 | 4,515 | 5,362 |
| 2013 | 846 | 4,500 | 5,346 |
| 2014 | 859 | 4,908 | 5,767 |
| 2015 | 797 | 5,049 | 5,846 |
| 2016 | 916 | 5,254 | 6,170 |
| 2017 | 815 | 5,718 | 6,533 |
| 2018 | 760 | 5,808 | 6,568 |
Industrial Design Applications Filed Abroad by Canadians
Figure 13 shows the top three destinations for industrial design filings abroad by Canadians in 2017. The United States received 960 filings from Canadians, accounting for two thirds of those filings abroad. The EUIPO and China followed respectively with 11% and 8% of the total share. Together, these destinations accounted for 86% of total industrial design filings abroad by Canadians, a share that has remained relatively unchanged since 2007. Filings by Canadians to the EUIPO have grown 78% since 2008.
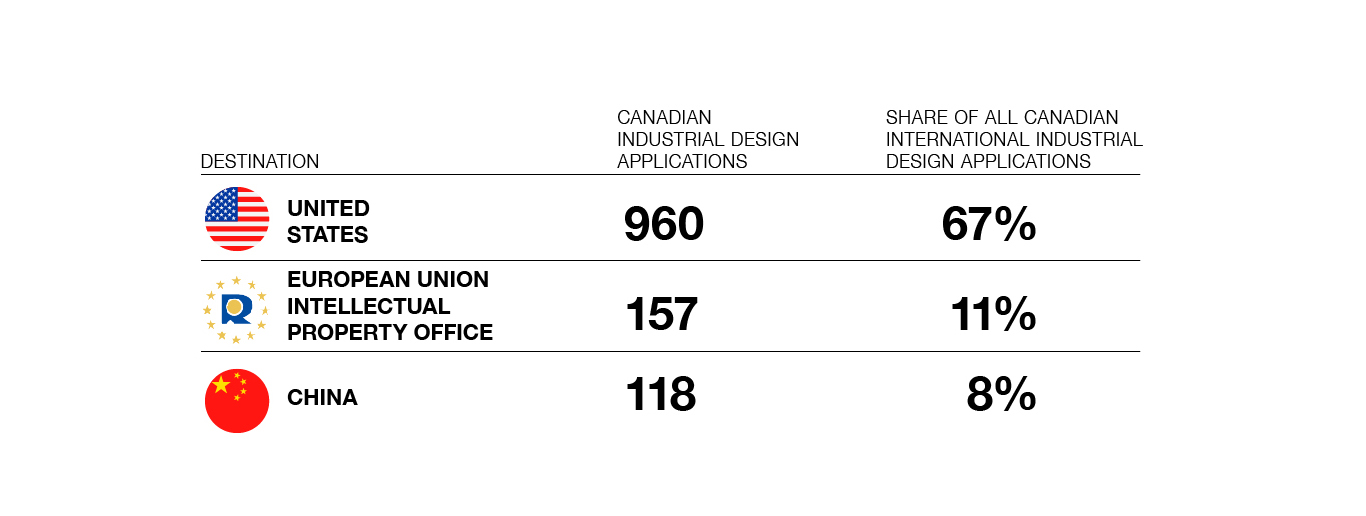
Figure 13 - Text version
| Destination | Canadian Industrial Design Applications | Share of all Canadian International Industrial Design Applications |
|---|---|---|
| United States | 960 | 67% |
| European Union Intellectual Property Office | 157 | 11% |
| China | 118 | 8% |
Figure 14 shows the trend in filings abroad for industrial designs by Canadians from 2008 to 2017. Canadians filed 1,436 industrial design applications abroad in 2017, a 4% decrease from the previous year. Filings by Canadians are up 19% since 2008, owing to strong growth in 2009, 2012 and 2016. The declines seen in 2010, 2011, 2014 and 2015 have limited the potential growth.
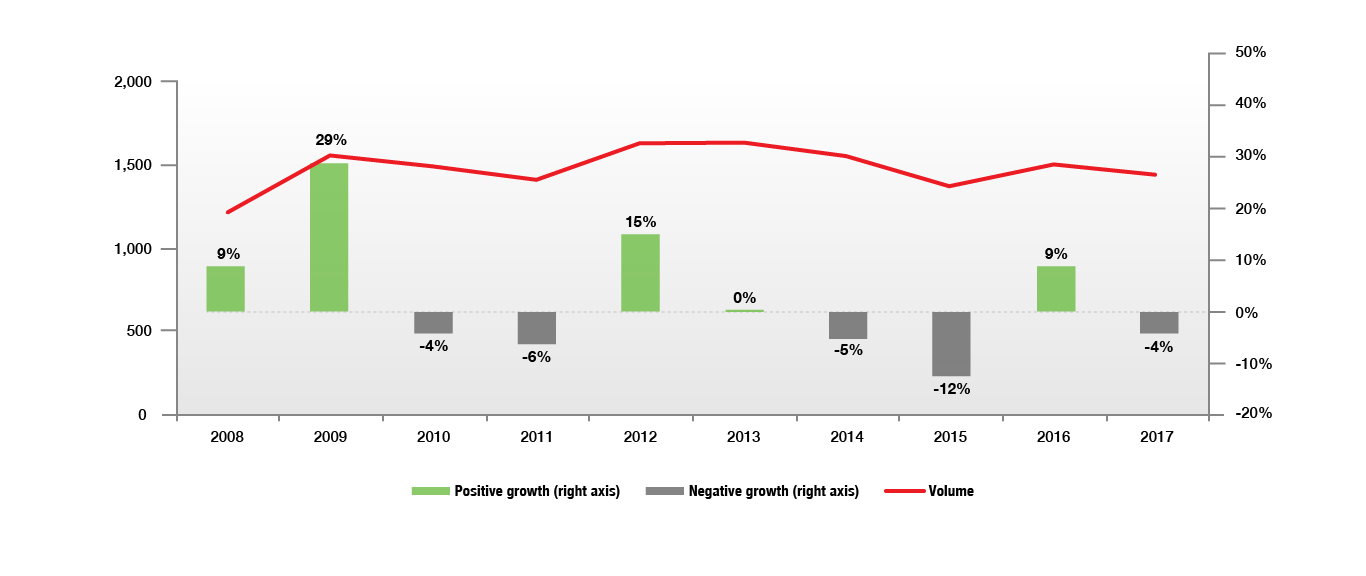
Figure 14 - Text version
| Year | Volume | Growth (right axis) |
|---|---|---|
| 2008 | 1,206 | 9% |
| 2009 | 1,554 | 29% |
| 2010 | 1,493 | -4% |
| 2011 | 1,409 | -6% |
| 2012 | 1,626 | 15% |
| 2013 | 1,629 | 0% |
| 2014 | 1,545 | -5% |
| 2015 | 1,366 | -12% |
| 2016 | 1,495 | 9% |
| 2017 | 1,436 | -4% |
Conclusion
The upward trends of non-resident filings reflect the growing importance of industrial designs globally. Non-resident filings have grown 69% since 2009 and filings abroad by Canadians have grown 19% since 2008. However, resident filings in Canada have remained flat since 2009, suggesting that Canadian filers could be making more use of industrial design rights both domestically and abroad. On , Canada acceded to the Hague Agreement and significantly modernized its industrial design regime. The Hague System allows applicants to acquire, maintain and manage industrial design rights in multiple countries through a single application filed with WIPO. The next IP Canada Report will include data for the first full year of filing activity at CIPO using the Hague System, while data on filings abroad by Canadians for 2019 will be reported in two years' time.
The impact of IP on financing and growth of small and medium enterprises
The impact of IP on financing and growth of small and medium enterprises
SMEs are an important part of the Canadian economy, as they are a significant source of innovation and job growth. SMEs accounted for 90% of the private labour force and 85% of net employment growth.Footnote 16 In late 2018, ISED published the first results from the 2017 Survey on Financing and Growth of Small and Medium Enterprises.Footnote 17 The objective of this tri-annual survey is to collect data on small- and medium-sized businesses, their financing activities, growth, government contracting, exporting, innovation and intellectual property, and owner characteristics. This section explores the results, which show a linkage between finance, growth, and the awareness and use of IP among SMEs.Footnote 18
Of additional interest for CIPO is that this is the second survey where IP use was compared to the main factors of importance for SMEs' financing and growth. This allowed for a comparative analysis between the 2014 and 2017 iterations of the survey for areas surrounding IP use. The 2017 edition explored for the first time IP awareness among SMEs. The public data tables were designed such that the criterion for IP awareness is relatively low, as SMEs which reported being "slightly familiar" with at least one type of IP were considered "familiar". CIPO's mandate includes increasing the awareness of IP by Canadian innovators and businesses. To achieve this, CIPO has implemented an IP Awareness and Education program to help Canadian innovators and businesses better understand and leverage IP for commercial success. Information about the program along with IP information, resources and tools to expand and succeed in domestic and foreign markets can be found on CIPO's IP for business webpage.Footnote 19
In addition, when looking at exports and growth, the survey looks both at what the firms experienced in the preceding three years and what they expect from the next three. What was found is that SMEs that hold formal IP are optimistic. Specifically, while they are more likely to have exported or experienced high growth compared to those not holding IP, they were even more likely to expect to export or to be a high growth firm in the coming years. When comparing the optimistic expectations from the 2014 survey with the realized outcomes from the 2017 survey, it can be seen that not only were SMEs holding formal IP, as a group, optimistic, they were also realistic as they mostly achieved the expectations they had set in 2014. Considering IP awareness was studied in 2017 for the first time, comparative analysis will be possible following future iterations of the survey.
IP Awareness and Use
The levels of IP awareness are higher than levels of IP use. Overall, 73% of SMEs in Canada are at least slightly aware of IP, and 25% hold at least one form of IP. The percentage of IP use is 9% when only formal IP is considered.Footnote 20
Figure 15 breaks down these results by formal IP right, showing that 59% of SMEs are at least slightly aware of patents; however, only 2% of SMEs hold at least one. Interestingly, the awareness of patents is higher than the awareness of trade secrets, yet the use of patents is lower. This could indicate that the relatively low use of IP by some SMEs cannot be fully explained by a lack of awareness.
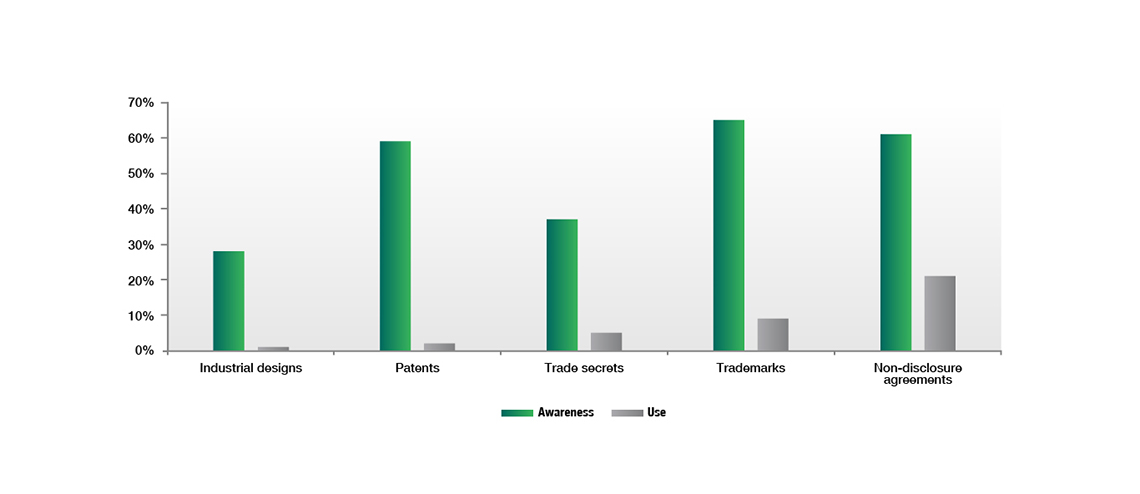
Figure 15 - Text version
| IP Right | Awareness | Use |
|---|---|---|
| Industrial designs | 28% | 1% |
| Patents | 59% | 2% |
| Trade secrets | 37% | 5% |
| Trademarks | 65% | 9% |
| Non-disclosure agreements | 61% | 21% |
IP and Firm Size
The larger the SMEs, the more likely they are to be aware of or hold IP. Figure 16 shows levels of awareness and use of IP by firm size. This is not surprising as firms aware of using IP are more likely to be innovating and exporting, activities that require additional employees to manage and perform. The relationships between IP, innovation and exporting are explored below.
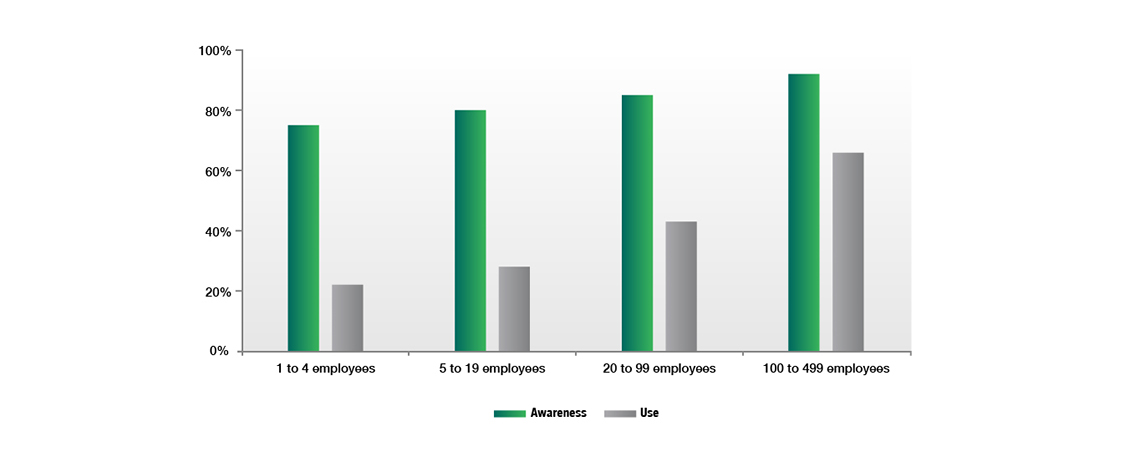
Figure 16 - Text version
| Size of SME | Awareness | Use |
|---|---|---|
| 1 to 4 employees | 75% | 22% |
| 5 to 19 employees | 80% | 28% |
| 20 to 99 employees | 85% | 43% |
| 100 to 499 employees | 92% | 66% |
Note that the figure above includes formal and informal IP,Footnote 21 and those percentages are affected by the relatively high percentage of awareness and use of non-disclosure agreements. Table 1 restricts the analysis to formal IP, showing that firm size is positively associated with the levels of awareness and use of patents and trademarks, while the use of industrial designs is observed primarily in larger SMEs.
| Size of SME | Patents | Trademarks | Industrial Designs | |||
|---|---|---|---|---|---|---|
| Awareness | Use | Awareness | Use | Awareness | Use | |
| 1 to 4 employees | 58% | 1% | 62% | 5% | 28% | 1% |
| 5 to 19 employees | 60% | 2% | 68% | 11% | 28% | 1% |
| 20 to 99 employees | 66% | 3% | 71% | 22% | 31% | 1% |
| 100 to 499 employees | 69% | 15% | 80% | 37% | 36% | 7% |
IP and Financing
SMEs face important challenges with respect to financing. SMEs that use formal IP are actually more likely to face these challenges. In particular, they are 1.5 times more likely to experience problems maintaining cash flows and 1.4 times more likely to find obstacles when trying to obtain financing. The first finding may be why SMEs that are aware of or holding formal IP are more likely to request external financing. Overall, 47% of SMEs requested financing in 2017.
The richness of the survey allows appreciating the differences between financing habits of SMEs that are aware of or use IP and their counterparts. SMEs that are aware of IP were 14% more likely to request financing, and those that use formal IP were 27% more likely to request financing. Figure 17 breaks down these results by financing type, in ratios.Footnote 22 Note that with regard to financing, IP use is a more important factor than awareness, with the greatest difference being in the area of equity financing.
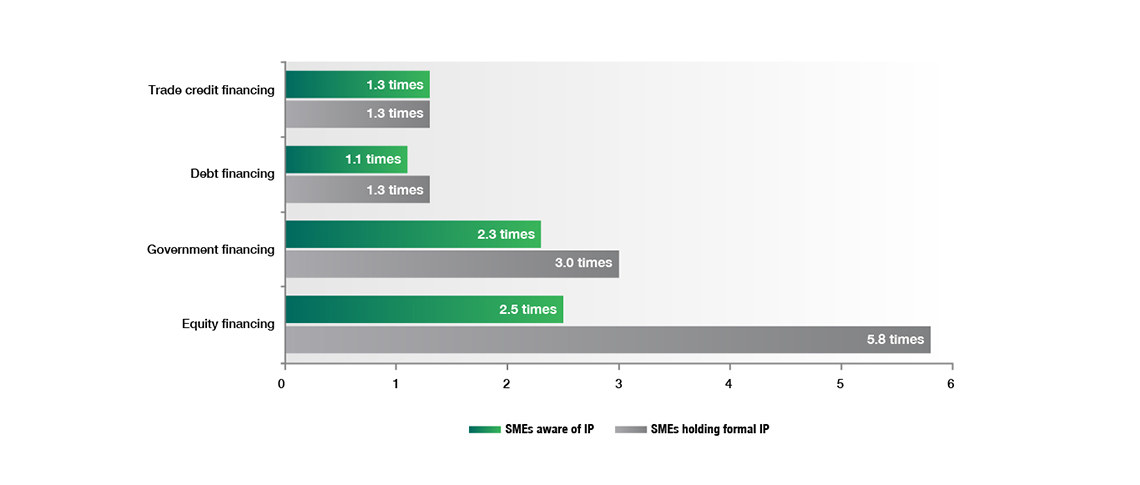
Figure 17 - Text version
| Type of Financing | SMEs aware of IP | SMEs holding formal IP |
|---|---|---|
| Equity financing | 2.5 | 5.8 |
| Government financing | 2.3 | 3.0 |
| Debt financing | 1.1 | 1.3 |
| Trade credit financing | 1.3 | 1.3 |
The preceding paragraph suggests that SMEs that are aware of or hold IP have higher financing needs than those that do not. It is intuitive then that they obtain higher amounts when they are successful. Figure 18 presents the ratio of the amounts authorized to SMEs that are aware of and use IP, compared to those that are not aware of or do not use IP. An interesting result is when considering equity financing, firms that are aware of IP receive much higher amounts than those that hold formal IP. Trade secrets and non-disclosure agreements could play an important role in equity financing.

Figure 18 - Text version
| Type of Financing and amounts received | SMEs aware of IP | SMEs holding formal IP |
|---|---|---|
| Trade credit financing | 1.8 | 2.8 |
| Debt financing | 1.2 | 2.5 |
| Government financing | 1.9 | 1.9 |
| Equity financing | 4.1 | 1.4 |
IP and Innovation
SMEs aware of or holding formal IP are more innovative than SMEs that do not. This is not surprising given the important role that IP plays in innovation. Figure 19 summarizes the relationship between innovation within SMEs, and their IP awareness and use. The first two bars refer to the overall innovation-related activities and indicate that SMEs that are aware of IP are 1.7 times more likely to be innovative; similarly, SMEs holding formal IP are two times more likely to be innovative. Figure 19 also presents a more detailed breakdown of types of innovation: marketing innovation (a new way of selling goods or services), organizational innovation (a new organizational method in business practices, workplace organization or external relations), process innovation (a new or significantly improved production process or method), and product innovation (a new or significantly improved good or service).
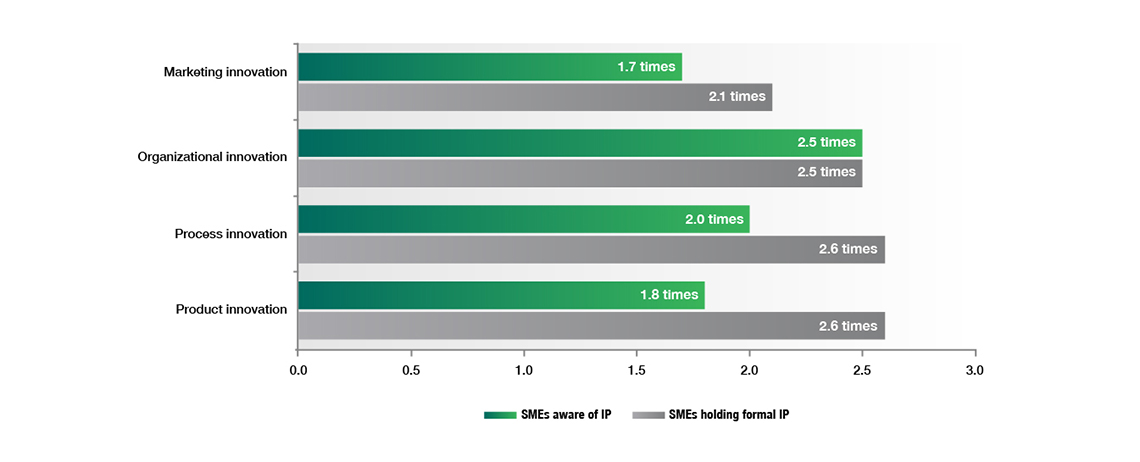
Figure 19 - Text version
| SMEs aware of IP | SMEs holding formal IP | |
|---|---|---|
| Product innovation | 1.8 | 2.6 |
| Process innovation | 2.0 | 2.6 |
| Organizational innovation | 2.5 | 2.5 |
| Marketing innovation | 1.7 | 2.1 |
IP and Market Expansion
SMEs aware of or holding formal IP are more likely to have expanded, or intend to expand, to domestic and international markets. This is where the idea of SMEs holding IP being both optimistic and realistic becomes evident. Figure 20 shows that SMEs holding formal IP are 3.0 times more likely to have expanded domestically and 4.3 times more likely to have expanded internationally. Those that are aware of IP are 1.9 times more likely to have expanded domestically and 2.4 times more likely to have expanded internationally. The expectations are even more impressive: 3.8 times more likely to intend to expand domestically, and 5.4 times more likely to intend to export.
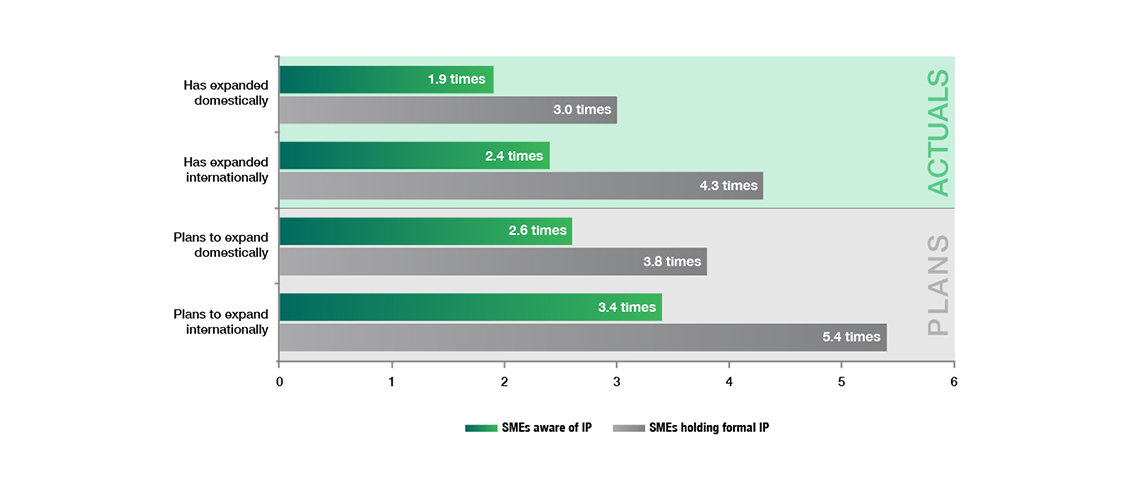
Figure 20 - Text version
| SMEs aware of IP | SMEs holding formal IP | |
|---|---|---|
| Plans to expand internationally | 3.4 | 5.4 |
| Plans to expand domestically | 2.6 | 3.8 |
| Has expanded internationally | 2.4 | 4.3 |
| Has expanded domestically | 1.9 | 3.0 |
Results from the 2014 survey showed that SMEs holding formal IP were 3.1 times more likely to intend to expand domestically and 4.9 times more likely to intend to go international. The comparison of the likelihood of intending to expand domestically in 2014 of 3.1 to the 3.0 likelihood experienced reveals that their expectations were realized. While not as closely aligned, the likelihood of intention to expand internationally in 2014 of 4.9 is within the area of the 4.3 likelihood experienced.
IP and Growth
SMEs aware of or holding formal IP are more likely to be high-growth firms, despite facing some obstacles. SMEs that were aware of IP were 1.6 times more likely to have experienced high growth (i.e., greater than or equal to 20% per year) in the past three years, and 1.7 times more likely to expect high growth in the next three years. Similar to the previous subsection, comparing the answers on IP use given by SMEs in the 2017 iteration of the survey with those from 2014 provides a unique way to see the optimistic and realistic characteristics of SMEs that hold formal IP.
Figure 21 shows that in 2014, SMEs holding IP were 1.6 times more likely to have experienced high growth in the past three years than SMEs not using IP, and 2.0 times more likely to expect high growth. In 2017, the figures were 1.9 and 2.5, respectively. Two important appreciations can be made from these findings. First, the likelihood of high growth in 2017 was higher than that reported in 2014, for both expectations and actuals. Second, similar to the expansion story of the previous subsection, the likelihood of expecting to be a high-growth firm in 2014 of 2.0 aligns closely with the 1.9 likelihood experienced. Again, the SMEs that hold formal IP are both optimistic, always expecting to do better than the previous period, and, at least for this period, realistic, as they achieved their expectations as a group.

Figure 21 - Text version
| Actual | Expected | |
|---|---|---|
| 2014 Holds formal IP | 1.6 | 2.0 |
| 2017 Holds formal IP | 1.9 | 2.5 |
Conclusion
The results of the 2017 iteration of the Survey on Financing and Growth of Small and Medium Enterprises were published in late 2018. The purpose of this section was to explore the relationship between IP awareness and use among SMEs, and their financing activities, actual and expected growth, market expansion, innovation, and characteristics such as firm size. The robust results of this survey provide a strong base of data that CIPO will use to support evidence-based policy decision making. Further exploration of the data could include multivariate analysis to further understand the influence of variables such as exports and firm size on IP awareness and use.
Overall, SMEs that are aware of or hold formal IP have improved outcomes relative to their counterparts. These enterprises were more likely to request financing and received higher amounts, more likely to innovate in various ways across their business lines, more likely to have and realize plans for expansion both domestically and internationally, and more likely to expect and experience higher growth. In most cases, firms holding IP performed better across these metrics than firms that were aware of but did not hold any IP. Indeed, it seems that the SMEs that hold IP are both optimistic and realistic, setting higher growth and expansion expectations than their counterparts, and for the most part achieving them.
Patenting in agri-food and fish processing
Patenting in agri-food and fish processing
As part of CIPO's annual industry snapshot, this section of the report highlights important findings about the Canadian fishing industry and the role of intellectual property. Fish and seafood are among Canada's largest exports of food products,Footnote 23 thus playing an important role in Canada's agri-food industry. In 2018, Canada exported over $6.9 billion worth of fish and seafood; lobster accounted for the largest proportion in terms of dollar value (32%).Footnote 24 From 2015 to 2017, Canada has increased employment in the industry by 6.7%, with 77,036 people employed in commercial harvesting, production and packaging as well as aquaculture.
Patent data provides a good starting point to assess technological innovation in an industry; they include rich technical details about inventions and information on inventors and applicants (e.g., location and company name), all of which can be used to track the development of technologies. This analysis uses data on patent families—inventions with applications in at least two jurisdictions—given that patent families are more likely to be higher-valued inventions that firms expect to commercialize.Footnote 25 This analysis refers to patent families as patented inventions from this point forward.Footnote 26
Patenting in the fish-processing industry by Canadians is sparse, so trends found in the year-over-year data are not likely to work well as predictors of future patenting. However, the data put in evidence the importance of the Atlantic provinces (New Brunswick, Newfoundland and Labrador, Nova Scotia, and Prince Edward Island) in Canada's fish-processing industry. Patented inventions in this industry most often come from the Atlantic provinces and these are the provinces that benefit the most from the patents they register.
Worldwide Patented Inventions in the Agri-Food Processing Industry
With this in mind, the volume of patented inventions in the agri-food processing industry across the world grew steadily from 2000 to 2017, with an annual growth rate of 11%. There were approximately 4,600 patented inventions worldwide in 2017, 10 of which involved Canadian assignees. Notably, fish and crustacean processing patents grew approximately 600% over that same timespan. Figure 22 is a visualization of worldwide patenting in the agri-food processing industry by subsector from 2000 to 2017.
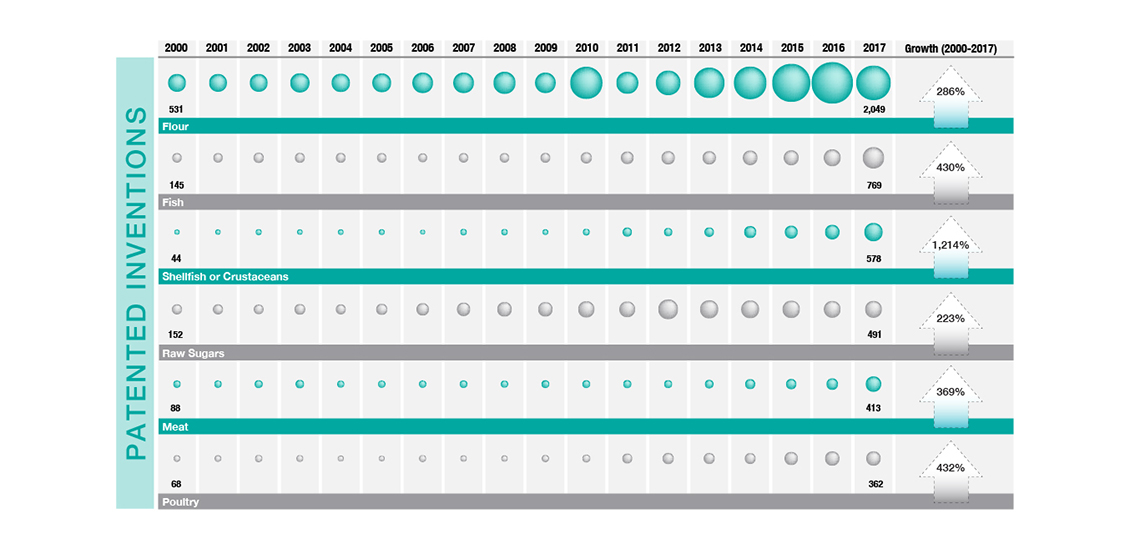
Figure 22 - Text version
| Subsector of Agri-Food Processing | 2000 | 2001 | 2002 | 2003 | 2004 | 2005 | 2006 | 2007 | 2008 | 2009 | 2010 | 2011 | 2012 | 2013 | 2014 | 2015 | 2016 | 2017 | Growth 2000-2017 |
|---|---|---|---|---|---|---|---|---|---|---|---|---|---|---|---|---|---|---|---|
| Flour | 531 | 549 | 556 | 647 | 580 | 611 | 737 | 744 | 843 | 729 | 1,805 | 840 | 1,029 | 1,599 | 1,854 | 2,525 | 2,970 | 2,049 | 286% |
| Fish | 145 | 156 | 186 | 163 | 163 | 153 | 140 | 152 | 159 | 168 | 216 | 276 | 298 | 301 | 360 | 387 | 487 | 769 | 430% |
| Shellfish or Crustaceans | 44 | 51 | 64 | 53 | 56 | 60 | 46 | 75 | 73 | 59 | 82 | 148 | 121 | 155 | 252 | 286 | 367 | 578 | 1214% |
| Raw Sugars | 152 | 178 | 166 | 202 | 175 | 220 | 269 | 311 | 369 | 366 | 462 | 434 | 682 | 575 | 555 | 526 | 487 | 491 | 223% |
| Meat | 88 | 95 | 112 | 126 | 88 | 94 | 94 | 103 | 92 | 107 | 107 | 116 | 113 | 130 | 177 | 185 | 231 | 413 | 369% |
| Poultry | 68 | 80 | 96 | 83 | 66 | 60 | 88 | 76 | 74 | 91 | 110 | 172 | 219 | 211 | 205 | 306 | 361 | 362 | 432% |
Patenting by Canadians in the Fish, Shellfish and Crustacean Processing Industry
This subsection looks at patented inventions for the processing of fish by Canadians and Canadian organizations, one of the three subsectors of the fishing industry. Patented inventions in fish, shellfish and crustacean processing have grown steadily since 2012, to the point where, across the world, there were 1,347 patented inventions applied for in 2017 in that industry subsector. Canada's patented inventions in this field are sporadic and account for 48 of the 7,247 patented inventions worldwide since 2000. It is more common (65%) in these 48 applications for the assignee to be an individual or group of individuals rather than a corporation, university or non-profit organization.
Figure 23 shows the locations associated with Canadian filings of patented inventions for fish, shellfish and crustacean processing, and the intensity of this patenting in each province since 2000. The provinces have been color coded in different shades of green, with those that have higher levels of patent activity being darker. When looking at the geographical profile of patenting activity, it is found that these patented inventions come largely from the Atlantic provinces. Individuals and organizations from Nova Scotia, New Brunswick, Prince Edward Island and Newfoundland were assignees on the majority (56%) of fish-, shellfish- and crustacean-processing patents.
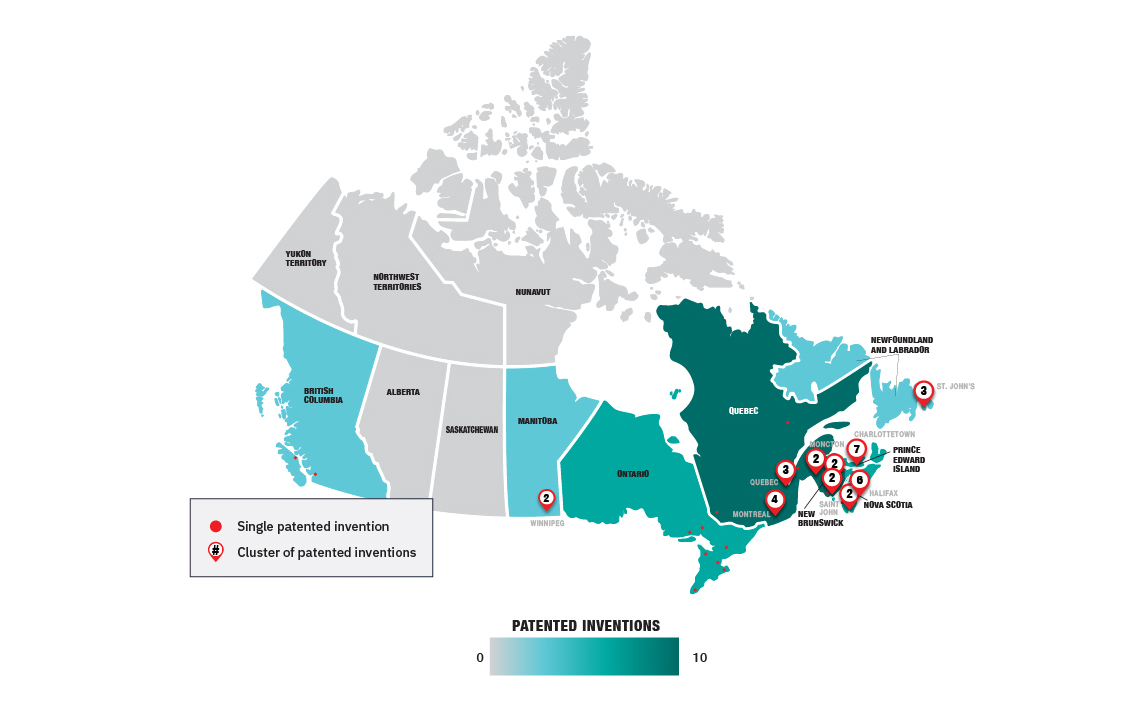
Figure 23 - Text version
Figure 23 is a map of Canada which shows patent activity in fish processing. The provinces have been colour coded in different shades of green, with darker shades for provinces that have a higher number of patented inventions. Quebec (10 patented inventions) has the darkest shade of green, followed by, Nova Scotia (9), New Brunswick (8) and Ontario (7), Prince Edward Island (7), Newfoundland and Labrador (3), Manitoba (2) and British Colombia (2). The map is overlaid with the location of the ten patent clusters (comprised of 2 or more patents), identified by red circles with the corresponding number of patented inventions labelled in each circle. Charlottetown is the largest cluster with seven patented inventions, followed by Halifax with six, Québec City with 4, Montreal and St. John's with 3 and the following locations with two patented inventions each: Moncton, Saint John, Riviere Verte, and Winnipeg. Individual patented inventions outside of the clusters are identified by the red dots overlaid on the map.
Conclusion
This section speaks to the importance of the Atlantic provinces in Canada's fishing industry. In 2017, 73% of harvesting and 72% of packaging and processing employees in Canada worked in these provinces.Footnote 27 Innovation ecosystems that bring together businesses, academics, and other innovation actors are essential to creating a culture of innovation and driving improvements in research and technology performance. Innovation, Science and Economic Development Canada's Innovation Supercluster Initiative includes an Ocean Supercluster,Footnote 28 with over 100 participants, including Dalhousie University, which is associated with eight of the aforementioned forty-eight Canadian fish-processing patents. Innovation is a key priority for the Government of Canada, thus making patenting in the fish-processing industry interesting to monitor in the coming years.
Conclusion
Conclusion
The 2019 IP Canada Report presented the most recent data and trends in IP usage at CIPO and abroad by Canadians. Patenting activity in Canada showed positive signs of growth in 2018, but was relatively flat during the last decade after declines in the years following the 2008 financial crisis. While non-resident industrial design filings at CIPO have grown 69% in the last decade, Canadian filings at home and abroad have been relatively static since 2010. Trademark filings continued their steady growth trend, with a 54% increase in filings at CIPO since 2009 and a 66% increase in filings abroad by Canadians from 2008 to 2017.
Research on the impact of IP on SMEs revealed many important findings. Businesses that reported awareness or use of formal IP were more likely to request and receive different types of financing. They were also more likely to report innovation in the areas of marketing, organization, processes, and products. They were more likely to have expanded domestically and abroad, and more likely to have plans to expand. In addition, these firms were also more likely to have experienced higher growth and to anticipate higher growth for their business over the next few years.
This year's report also featured research on patenting in the agri-food processing industry. Global patenting in agri-food processing grew 11% annually on average from 2000 to 2017, with fish- and crustacean-processing patents seeing 655% growth over this period. During this time, most Canadian patents for fish processing originated in the Atlantic provinces, highlighting the important role of this region in the national industry.
These findings highlight the potential for IP to enhance the success of Canadian businesses. Canada's implementation of the Hague Agreement, the Madrid Protocol, the Singapore Treaty, the Nice Agreement, and the Patent Law Treaty will help Canadian businesses, making it simpler and more cost-effective to file in Canada and in multiple IP offices around the world. The future Canadian economy depends on the creativity of businesses, using a modern IP framework to leverage their inventions, brands, and designs both at home and globally.
Appendix A and B
Appendix A
CIPO oversees Canada's IP system, administering rights in the form of patents, trademarks, and industrial designs. Each type of IP protection is designed for different circumstances.
Patents
Patents provide a time-limited, legally protected, exclusive right to make, use and sell an invention. In this way, patents serve as a reward for ingenuity. Patents apply to newly developed technology, as well as to improvements on products or processes.
Patent protection applies in the country or region that issues the patent. In Canada, a patent lasts for 20 years from the date that it is filed. Patents can have a great deal of value. They can be sold, licensed or used as assets to attract funding from investors.Footnote 29
In exchange for these benefits, a full description of the invention must be provided when filing a patent. This helps enrich technical knowledge worldwide. Details of patent applications filed in Canada are disclosed to the public after an 18‑month period of confidentiality.
To be eligible for patent protection, an invention must be: new (first in the world), useful (functional and operative), and inventive (showing ingenuity and not obvious to someone of average skill who works in the field of the invention). The invention can be: a product (e.g., door lock); a composition (e.g., chemical composition used in lubricants for door locks); a machine (e.g., for making door locks); a process (e.g., a method for making door locks); an improvement on any of these.
In Canada, the first applicant to file a patent application is entitled to obtain the patent. The patent should be filed as soon as possible after an invention is completed in case someone else is on a similar track.
Any public disclosure of an invention before filing may make it impossible to obtain a patent. There is an exception in Canada and the United States if the public disclosure was made by the inventor or by someone who learned of the invention from the inventor less than one year before filing the patent application. Please be aware that in some countries disclosing the invention to the public anywhere in the world before filing a patent application may, in many circumstances, prevent the inventor from obtaining a patent.Footnote 30
Standard fees are first, small entity fees are in parentheses:
- Patent application fee: $400 ($200)
- Examination fee: $800 ($400)
- Final fee (before grant): $300 ($150)
- Additional fees may apply
- Maximum duration: 20 years
- Renewal: Annually (maintenance fees vary based on the anniversary of filing)
For applications using the PCT, please see https://www.wipo.int/pct/en/.
Trademarks
Trademarks can be one or many words, designs, tastes, textures, moving images, mode of packaging, holograms, sounds, scents, three-dimensional shapes, colours, or a combination of these used to distinguish the goods or services of one person or organization from those of others. Over time, trademarks stand for not only the actual goods or service a person or company makes, but also the reputation of the producer. Trademarks are very valuable intellectual property.Footnote 31 For example, suppose you started a courier business that you chose to call Giddy-up. You could register these words as a trademark (if you met all the legal requirements) for the service that you offer.
A certification mark, a type of trademark, can be licensed to many people or companies for the purpose of showing that certain goods or services meet a defined standard. For example, the Woolmark design, owned by Woolmark Americas Ltd., is used on clothing and other goods.
Prior to
- Trademark application fee: $250 (online) or $300 (paper)
- Trademark registration fee: $200
- Duration: 15 years, renewable for $350 (online) or $400 (paper)
After
Trademark application fee:
- $330(online) or $430 (paper) - includes the first class of goods or service to which the application relates as of the filing date
- $100 for each additional class of goods or services to which the application relates as of the filing date
Duration: 10 years, renewable for $ 400 (online) or $500 (paper)
- includes the first class of goods or service to which the request for renewal relates
- $125 for each additional class of goods or services to which the request for renewal relates
For applications using the Madrid Protocol, please see:
http://www.ic.gc.ca/eic/site/cipointernet-internetopic.nsf/eng/wr04619.html
Industrial Designs
Industrial design is about how something looks. It protects the visual features of shape, configuration, pattern or ornament, or any combination of these features applied to a finished article. In other words, it protects the appearance of an article. For example, industrial designs can be found in many everyday products, such as the unique contour of a car hood, the graphical user interface on a phone or the specific shape or pattern of your favourite shoes.Footnote 32 If you want to register an industrial design, it has to be novel. Registering your industrial design will provide you with an exclusive right to your design for up to 15 years after you register.
- Examination of an application to register a design: $400
- Maintenance of a registration of a design: $350 (due 5 years after registration)
- Maximum duration: 15 years
You may file for registration through CIPO or through the Hague System. If you choose to file an application through CIPO you may protect your design only in Canada. If you choose to file an application through the Hague System, you may protect your design in multiple countries at the same time, including in Canada. For more information on the how to apply for registration, please see the Industrial Designs Guide.Footnote 33
Appendix B
Interpreting Patent Data
Patent data is a good starting point for analysis of the development of new technologies as it provides important information on the specific innovation in the invention and who the inventors and applicant are. Like any data source, patent data has its strengths and weaknesses, and if used in the wrong way, it can lead to erroneous conclusions and poor policy. The following provides context on the use of patents in understanding innovation.
While patents measure the flow of new ideas, it has been argued that patents may not measure innovation for three important reasons: patents do not include non-patented innovations, not all patents result in commercialization, and many patents are strategic in nature.Footnote 34 For this reason, the analysis is based on patent families that include applications in at least two jurisdictions. This makes it more likely that these patent families will be a higher-valued invention and that the firm expects to commercialize the invention.Footnote 35
Another challenge presented is that many innovations or inventions remain hidden as trade secrets. These innovations will be missed in a measure that includes only patents. However, a 2008 study indicates that world-first innovators patent more frequently. Conversely, firms that patent infrequently tend to be imitators.Footnote 36 In addition, the study finds that firms that protect their intellectual property are more likely to increase their profits than those that do not. Moreover, SMEs that patent are more likely to be high-growth firms, which is important for success.Footnote 37 These conclusions are reinforced by a Canadian study that noted that firms that are aggressive innovators, introducing radically new products that involve patent protection, have higher profits.Footnote 38 Finally, while some inventions are not patented, patents are obtained for almost all economically significant inventions.Footnote 39
Below are the primary ways to view or interpret patent data:
Market Reach
Patent filings in foreign markets are a good indicator of firms accessing those markets. Surveys have shown that firms that hold patents are more likely to be exporters.Footnote 40
Innovative Activity
When we do not account for filings in multiple jurisdictions, we are double and triple counting the number of patented inventions or innovative activities. In order to address this, patent data allows for the formation of patent families whereby each family includes all related or similar patents in all jurisdictions.
Scientific Strength
It is possible to identify the researchers or scientists, rather than the company or applicant. While these can be the same, they are often different. In this way, we can see the inventive activity of Canadian researchers working in other countries or for non-Canadian companies.
Relative Advantage
Canada is a small open economy. For this reason, it is unlikely that our industries or innovators would have an absolute advantage in a particular area, be the most prolific IP users, or have the largest global market share. However, there are areas where we have a comparative or relative advantage. Much work has been done in the creation of metrics of relative technological advantage and relative specialization.