
Interim Guideline for Licensing of Earth Stations in the Fixed-Satellite, Earth Exploration-Satellite and Space Research Services in the Frequency Bands 26.5-27.5 GHz and 37.5-40.0 GHz
Issue 3
September 2025
Preface
Interim guideline GL-10, Interim Guideline for Licensing of Earth Stations in the Fixed-Satellite, Earth Exploration-Satellite and Space Research Services in the Frequency Bands 26.5-27.5 GHz and 37.5-40.0 GHz, issue 3, replaces GL-10, Interim Guideline for Licensing of Earth Stations in the Fixed-Satellite, Earth Exploration-Satellite and Space Research Services in the Frequency Bands 26.5-28.35 GHz and 37.5-40.0 GHz, issue 2.
The following are the main changes:
- updated applicable frequency ranges and frequency blocks for which GL-10 applies, following the publication of SPB-001-25, Addendum to the Non-Competitive Local Licensing Framework to include Spectrum in the 27.5-28.35 GHz Band.
- made editorial changes and clarifications, as appropriate.
Earth stations operating in the 27.5-28.35 GHz frequency range must now refer to SRSP-102, Band-Specific Technical Requirements for Earth Stations in the Fixed-Satellite Service.
As stated in the background of this document, Innovation, Science and Economic Development Canada (ISED) will consult on the licensing framework for flexible use, update earth station licensing rules and develop coordination rules in the future. Until the earth station licensing rules and coordination rules are finalized, earth stations in the millimetre wave bands will be licensed in accordance with the interim licensing guideline GL-10, issue 3.
Issued under the authority of
the Minister of Industry
Wen Kwan
Director General
Engineering, Planning and Standards Branch
1. Background
In June 2019, Innovation, Science and Economic Development Canada (ISED), on behalf of the Minister of Innovation, Science and Economic Development, published a Decision on Releasing Millimetre Wave Spectrum to Support 5G (“the Decision”) through Canada Gazette notice SLPB-003-19. Furthermore, in April 2021, ISED released SAB-002-21, Moratorium on the Licensing of Earth Stations in the Frequency Bands 26.5-28.35 GHz and 37.5-40.0 GHz in Certain Areas. Through the Decision, ISED indicated that it will consult on the licensing framework for flexible use, update earth station licensing rules and develop coordination rules in the future. As well, ISED stated that until the earth station licensing rules and coordination rules are finalized, earth stations in the millimetre wave bands will be licensed in accordance with an interim licensing guideline. Therefore, ISED will be applying the interim rules specified in this document to facilitate the licensing of Earth exploration-satellite service (EESS) and space research service (SRS) earth stations in the frequency band 26.5-27.0 GHz, and fixed-satellite service (FSS) earth stations in the frequency bands 27.0-27.5 GHz and 37.5-40.0 GHz.
2. Intent
This guideline will be used in all cases where prospective licensees apply to ISED to seek authorizations for EESS and SRS earth stations in the frequency band 26.5-27.0 GHz, and FSS earth stations in the frequency bands 27.0-27.5 GHz and 37.5-40.0 GHz.
This guideline will remain in effect until ISED adopts earth station licensing and coordination rules to facilitate sharing between EESS/SRS/FSS earth stations and flexible use systems. Other licensing requirements for earth station applications (such as those specified in CPC-2-6-01, Procedure for the Submission of Applications for Spectrum Licences and Site Approvals for Earth Stations Requiring Site Approval) and all the relevant provisions of the Radiocommunication Act and Radiocommunication Regulations continue to apply.
As indicated in the Decision, ISED recognizes the important and often critical role of satellite communications in providing connectivity in rural and remote areas such as the North. To facilitate earth station deployment in these areas, ISED intends to consult, through the licensing framework consultation, on a set of specific areas that could be afforded some flexibility when applying the licensing and coordination rules. In GL-10, issue 3, flexibility is provided to earth stations operating in certain areas. Annex A contains a preliminary list of Tier 4 service areas in which earth stations are exempted from certain provisions. Given that this list is subject to future consultation, the flexibility provided to earth stations operating in these service areas (including relaxation of certain rules or exemption from certain provisions; see section 3) is on a provisional basis. Depending on the result of the consultation, these earth stations may be required to comply with additional provisions, including those from which they are currently exempt. Note that although Tier 4 service areas are used throughout this document, the decision on flexible use licence areas will be developed through an upcoming licensing framework consultation.
Authorization for an earth station obtained under GL-10, issue 3, may also be subject to the licensing and coordination rules to be established in the future. ISED intends to gather experience on the use of this guideline to develop the licensing and coordination rules, and may modify this guideline as required. The terms used in GL-10, issue 3, are defined in table 1 below.
| Term | Definition |
|---|---|
| Census metropolitan area (CMA) |
For the purposes of applying this guideline, the Statistics Canada definition of census metropolitan area (CMA) applies. For details refer to Dictionary, Census of Population, 2021. |
| Co-located earth station | For the purposes of applying this guideline, an earth station is considered co-located with existing earth station(s) if the transmit/receive contour of the proposed earth station overlaps the transmit/receive contour of the existing earth station(s), regardless of whether these earth stations are located at the same site. |
| Incremental contour |
For a scenario where the proposed earth station location is not co-located with any existing authorized earth stations, the incremental contour is the same as the transmit/receive contour of the proposed earth station. For a scenario where the proposed earth station is co-located with existing authorized earth stations, the incremental contour is the portion of the proposed earth station’s transmit/receive contour that is not already covered by the transmit/receive contour of the existing authorized earth stations. For more information, refer to annex E. |
| Incremental population |
The incremental population is the population within the incremental contour. For more information, refer to annex E. |
| Large population centre (LPC) |
For the purposes of applying this guideline, the Statistics Canada definition for a large urban population centre applies: a centre with a population of 100,000 or more. For details, refer to Dictionary, Census of Population, 2021. |
| Major infrastructure | See annex D. |
| Major roadway | See annex D. |
| Maximum radius of the transmit/receive contour | The maximum radius of the transmit/receive contour is the maximum distance between the location of the earth station and the edge of the transmit/receive contour. |
| Medium population centre (MPC) |
For the purposes of applying this guideline, the Statistics Canada definition for a medium population centre applies: a centre with a population between 30,000 and 99,999. For details, refer to Dictionary, Census of Population, 2021. |
| Receive contour | The receive contour is intended to represent a region within which there is a potential that the operation of a flexible use service system may cause harmful interference to the operation of the earth station. |
| Simple polygon | A simple polygon is a shape consisting of straight, non-intersecting line segments or “sides” that are joined pair-wise to form a closed shape with no holes. |
| Spectrum grid cell | As defined in Service areas for competitive licensing, issue 4, October 2015: The minimum size of the grid cell is 1 minute latitude × 1 minute longitude. Larger square grid cells, e.g. 3 minute × 3 minute cells or 15 minute × 15 minute cells, are implemented for interiors of service areas where fine granularity is not required. |
| Transmit contour | The transmit contour of an earth station is intended to represent a region beyond which its transmission may not exceed a specified power flux density limit. |
3. Licensing guidelines for new earth stations
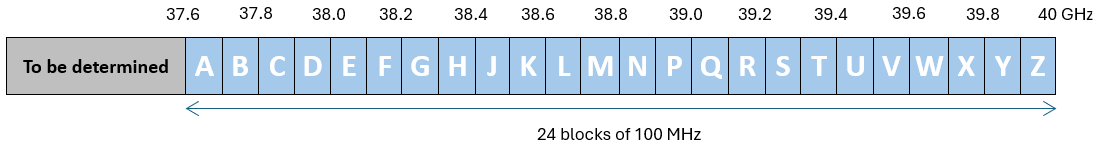
An application for a receiving EESS, SRS and FSS earth station licence in the frequency bands 26.5-27.0 GHz and 37.5-40.0 GHz, or an application for a transmitting FSS earth station licence in the frequency band 27.0-27.5 GHz must include a receive contour or a transmit contour. A contour is required for each relevant frequency block in the 26.5-27.5 GHz and 37.5-40.0 GHz. The band plans are illustrated in figures 1 and 2, respectively. For the purpose of applying this guideline, the frequency band 37.5-37.6 GHz shall be treated as an individual 100 MHz frequency block.
Figure 1: Fixed and mobile services band plan for the frequency band 26.5-27.5 GHz

Figure 2: Fixed and mobile services band plan for the frequency band 37.6-40.0 GHz
As indicated in the Decision, ISED will develop coordination rules using a population-impact based approach to enable coexistence between flexible use stations and satellite earth stations in the millimetre wave bands. Specifically, this approach will set limits on earth station deployment such that its deployment would not affect a material amount of the population in a given flexible use licence area.
For transmitting earth stations, ISED could establish exclusion zones where flexible use systems would not be able to claim protection unless an agreement is reached between the licensees.
For receiving earth stations, protection zones could be established where flexible use systems would only be able to deploy upon successful coordination with earth station licensees.
In order to establish these zones, the transmit/receive contours described below could be used. Additional coordination rules could also be developed. ISED will develop proposed coordination rules through consultation with stakeholders.
Aside from the requirements described in this guideline, to obtain a licence, earth station applicants must satisfy the requirements outlined in CPC-2-6-01.
3.1 Acceptable transmit/receive contours
The following sections describe requirements for acceptable receiver and transmit contours.
3.1.1 Receive contour
For all receiving earth stations regardless of their locations, the applicant must submit a contour in the shape of a simple polygon specifying a region around the receiving earth station using the method described in annex B.
Contours submitted to ISED must be in Well-Known Text (.wkt) electronic format. The applicant must also complete and attach the table in annex C, which describes the assumptions and parameters used to generate the contour.
3.1.2 Transmit contour
For all transmitting earth stations regardless of their locations, the applicant must submit a contour in the shape of a simple polygon specifying a region beyond which the aggregate power flux density (PFD) of the proposed transmitting earth station and any other existing authorized co-located transmitting earth stations does not exceed, for more than 10% of the time, a value of -77.6 dBm/m2/MHz at 10 metres above ground level that is generated using the method described in annex B.
Contours submitted to ISED must be in Well-Known Text (.wkt) electronic format. The applicant must also complete and attach the table in annex C, which describes the assumptions and parameters used to generate the contour.
Where an applicant’s proposed earth station is co-located with one or more other existing authorized or pending earth station, the applicant is encouraged to contact the operator(s) of the existing authorized and/or pending earth stations for information relating to their contours.
Recognizing that the transmit contour is estimated using engineering models, ISED may request a transmitting earth station licensee to demonstrate compliance through field measurements, if necessary.
In the event that the emissions from transmitting earth stations exceed the limit or cause harmful interference to flexible use systems operating in the same area, ISED may also require adjustment to radio and auxiliary equipment in radio stations to enable coexistence. ISED may conduct a review of the transmit contours submitted with earth station authorizations on a case-by-case basis.
3.2 Further requirements for the transmit/receive contours
For proposed earth stations located in a Tier 4 service area listed in annex A, the licence applicant is required to provide an analysis at the time the application is submitted to demonstrate that the following requirements are satisfied for each flexible use frequency block in which the proposed earth station will operate:
- Maximum radius and area of the transmit/receive contour: The maximum radius of the transmit/receive contour (i.e. the maximum distance between the location of the earth station and the edge of the contour) should be less than 30 km. The area of the transmit/receive contour should be less than 315 km2. If the maximum radius of the transmit/receive contour is greater than 30 km or the area of the transmit/receive contour is greater than 315 km2, authorization may be considered on a case-by-case basis, taking into consideration justifications submitted by the applicant that may include, but are not limited to:
- the engineering calculations and assumptions used to produce the contour
- the impact on any nearby populated areas
- the rationale for siting the earth station at the location specified
- demonstration that the proposed earth station would not unnecessarily encumber future fixed and mobile services operating in the same frequency block(s)
For proposed earth stations located in a Tier 4 service area not listed in annex A, the licence applicant is required to provide an analysis at the time the application is submitted to demonstrate that all the following operational requirements are satisfied for each flexible use frequency block in which the proposed earth station will operate:
- Maximum radius and area of the transmit/receive contour: The maximum radius of the transmit/receive contour (i.e. the maximum distance between the location of the earth station and edge of the contour) should be less than or equal to 10 km. The area of the transmit/receive contour should be less than 100 km2. If the maximum radius of the transmit/receive contour is greater than 10 km or the area of the transmit/receive contour is greater than 100 km2, authorization may be considered on a case-by-case basis, taking into consideration justifications submitted by the applicant that may include, but are not limited to:
- the engineering calculations and assumptions used to produce the contour
- the impact on any nearby populated areas
- the rationale for siting the earth station at the location specified
- demonstration that the proposed earth station would not unnecessarily encumber future fixed and mobile services operating in the same frequency block(s)
- Siting restrictions: In accordance with SAB-002-21, a proposed earth station cannot be located within the boundaries of Tier 4 service area 4-051 (Montreal), 4-077 (Toronto) or 4-152 (Vancouver); an LPC; or an MPC.
- Avoidance of some Tier 4 service areas and LPCs: In accordance with SAB-002-21, the proposed earth station’s transmit/receive contour must not overlap Tier 4 service area 4-051 (Montreal), 4-077 (Toronto) or 4-152 (Vancouver), and/or an LPC in another tier.
- Avoidance of major infrastructure: The transmit/receive contour must not overlap any major infrastructure within a relevant census metropolitan area (CMA) as described in annex D.
- Incremental population limit: The incremental population that is affected by the authorization of the proposed earth station, as calculated using the transmit/receive contour and the method described in annex E, must be less than or equal to the maximum permitted incremental population limit of 2,500 people, as specified in table 2 below.
- Aggregate population limit: For each flexible use frequency block in a Tier 4 service area, the aggregate population overlapped by the contours of all existing licensed earth stations and the proposed earth station must be less than or equal to the maximum aggregate population limit in table 2 below for each Tier 4 service area overlapped by the proposed earth station’s contour.
| Population of the Tier 4 service area where the proposed earth station is located | Incremental earth station population limit that could be affected by the authorization of the proposed earth station (see note below), per flexible use frequency block in the Tier 4 service area where the proposed earth station is located | Maximum permitted aggregate population that could be affected by the authorization of the proposed earth station (see note below), per flexible use frequency block in the Tier 4 service area where the proposed earth station is located |
|---|---|---|
| Greater than 500,000 people | 2,500 people | 25,000 people |
| Between 100,000 and 500,000 people | 2,500 people | 5% of the Tier 4 population |
| Less than 100,000 people | 2,500 people | 5,000 people |
Note: A description of the Tier 4 service areas with corresponding aggregate population limits per flexible use frequency block is provided in annex F using population data available at this time. Going forward, determination of the aggregate Tier 4 population limits for earth station licensing shall be based on the most up-to-date population census data made available by ISED at the time the earth station licence application is submitted.
To assist in the licensing application process, a checklist to help applicants demonstrate compliance with the above requirements is included in tables G1 and G2 of annex G. In addition, examples demonstrating compliance with requirements described in this guideline are included in annex H.
ISED may review the submitted transmit/receive contours and work with operators to ensure the submitted contours are generated in conformance with annex B, if necessary.
3.3 Meeting the requirements
All applicants for an earth station licence who meet the requirements outlined in GL-10, issue 3 will be eligible for a licence with the standard terms and conditions.
Where the proposed transmitting or receiving earth station does not meet all of the conditions in this guideline but does meet the other applicable requirements, ISED may consider authorizing the earth station(s) on a no-interference, no-protection basis with respect to future flexible use licensees operating in the same frequency block on a case-by-case basis. In such instances, ISED may impose certain specific conditions on the authorization.
4. Earth stations licensed or submitted prior to the publication of GL-10, issue 3
Earth stations licensed in the 26.5-27.5 GHz frequency range in accordance with GL-10, issue 1 and issue 2, are not required to submit new applications to show compliance with GL-10, issue 3.
Applications for earth stations operating millimetre wave bands submitted but not authorized prior to the publication of GL-10, issue 3 will be licensed in accordance with this interim licensing guideline.
5. Applications to modify an existing licence
Modifications to any existing licences, including those for earth stations licensed under GL-10, issue 1 and 2 , may be permitted, provided that licensees:
- submit updated transmit/receive contours, as appropriate (described in section 3.1 and 3.2)
- remain in compliance with their current conditions of licence, and
- ensure that the proposed modifications do not result in increased potential for interference to future flexible use licensees.
To demonstrate that there is no increase in potential for interference, an applicant must provide and demonstrate the following:
- Frequency required: The overlapped flexible use frequency block is the same as those listed in the existing licence for the corresponding earth station.
- Updated transmit/receive contour, as appropriate: The transmit/receive contour, as appropriate, resulting from the modification of the earth station licence or addition of a co-located earth station has no part falling outside the area covered by the contour for the original earth station.
To assist in the licensing application process, a checklist to help demonstrate compliance with the above requirements is included in table G3 of annex G.
Annex A: Preliminary list of Tier 4 service areas exempted from certain provisions
For a detailed explanation, see section 3.
| Tier | Service area name |
|---|---|
| 4-005 | Labrador |
| 4-062 | Val-d'Or |
| 4-066 | Chibougamau |
| 4-103 | Kapuskasing |
| 4-104 | Kenora/Sioux Lookout |
| 4-105 | Iron Bridge |
| 4-107 | Marathon |
| 4-109 | Fort Frances |
| 4-112 | Lac du Bonnet |
| 4-115 | Portage la Prairie |
| 4-117 | Creighton/Flin Flon |
| 4-118 | Thompson |
| 4-130 | Northern Saskatchewan |
| 4-147 | Peace River |
| 4-157 | Powell River |
| 4-161 | Ashcroft |
| 4-164 | Williams Lake |
| 4-165 | Quesnel/Red Bluff |
| 4-166 | Skeena |
| 4-168 | Smithers |
| 4-169 | Dawson Creek |
| 4-170 | Yukon |
| 4-171 | Nunavut |
| 4-172 | Northwest Territories |
Annex B: Method for generating earth station contours
B.1 Method for generating the receive contour
The receive contour shall be generated for each flexible use frequency block (refer to figures 1 and 2 in section 3) that is overlapped by the proposed earth station’s operating frequencies. The applicant may select the protection criteria (e.g. I/N or C/I) that is appropriate for their particular earth station. Applicants are expected to use best engineering practices that take into account factors such as the effect of terrain and man-made and natural obstructions, to the extent possible.
ISED recognizes that standards for deploying flexible use systems are not yet developed. Therefore, for the purposes of modelling the receive contour, applicants may use the following technical parameters to model flexible use systems in the fixed/mobile service:
- Fixed services: Parameters described in SRSP-338.6, Technical Requirements for Fixed Radio Systems Operating in the Band 38.6-40.0 GHz
- Mobile services:
- Maximum EIRP* of 55 dBm/MHz or TRP** of 40 dBm for base stations
- Maximum EIRP of 43 dBm or TRP of 23 dBm for portable (mobile) devices
- Maximum EIRP of 55 dBm or TRP of 40 dBm for transportable devices
It should be noted that the above technical parameters are offered for guidance and do not necessarily represent technical parameters that will be implemented in future flexible use system technical standards.
*EIRP: Equivalent isotropically radiated power
**TRP: Total radiated power
B.2 Method for generating the transmit contour (applicable to all earth stations)
The transmit contour shall be generated based on the aggregate emissions of all co-located transmitting earth stations using any portion of the same flexible use service frequency block (refer to figures 1 and 2 in section 3) that is overlapped by the proposed earth station’s operating frequencies. Applicants are expected to use best engineering practices that take into account factors such as the effect of terrain and man-made and natural obstructions, to the extent possible. In addition, the transmit contour shall be modelled:
- for a PFD value of -77.6 dBm/m2 at 10 m above ground level in 1 MHz that is exceeded for no more than 10% of the time
- using the technical parameters (e.g. transmit power, antenna gain) for each co-located earth station in the 1 MHz portion of the flexible use service frequency block that would produce the maximum peak aggregated PFD
Figure B1 gives an example to illustrate the application criteria b), above. In this example, there are four co-located earth stations operating on different portions of the same flexible use service frequency block. Figure B1 depicts the different emissions for each earth station. Each emission could have different technical characteristics and overlap in different portions of the flexible use service frequency block. The maximum peak aggregated PFD is most likely to occur in the 1 MHz frequency block where multiple emissions overlap. In this example, two candidates are highlighted in yellow for illustration: a 10 MHz and 5 MHz frequency segment. Supposing that the maximum peak aggregated PFD would occur in the 5 MHz segment, the applicant would generate the transmit contour using emissions A2, B2 and C1 in that 5 MHz segment.
Figure B1: Example depicting the emissions of four co-located earth stations operating in the same frequency block

Annex C: Required information for describing the list of parameters and assumptions used to generate the contour
Applicants are required to submit information describing the parameters and assumptions used to generate their contours in each frequency block using the appropriate templates in tables C1a-b or C2a-d below. If the values of the parameters are identical to those that appear in the licence application(s), this should be indicated. Whenever possible, the applicant should use the actual parameters that reflect real operation and provide justification.
Transmit power
The transmit power used to generate the contour should align with the value used during actual operation (i.e. clear-sky conditions). If the transmit power differs from the maximum peak envelope power on the licence application for an earth station, a detailed explanation is required.
Terrain/Clutter/Shielding
Terrain data such as SRTM (refer to NASA – Shuttle Radar Topography Mission) or ASTER GDEM (refer to NASA – ASTER Global Digital Elevation Map) are publicly available. Therefore, an applicant is required to take terrain into account when developing the contour. ISED requires the use of terrain data base with a 90 m resolution or less.
Where land use clutter data is available, the applicant should include the clutter data in the simulation. Otherwise, the applicant should use an appropriate clutter model depending on the environment in which the earth station is located and indicate which of the methods were used in the simulation. When using non-statistical clutter models like ITU-R P.452, relevant parameters such as clutter categories should be provided. When using a statistical model like ITU-R P.2108 in an urban and suburban environment, relevant parameters such as the p value should be provided. The applicant should also explain why the chosen model is appropriate and provide justification for the parameters selected.
If shielding is installed around an earth station, applicants are encouraged to model the effects. The applicant should give a detailed explanation of how the shielding was modeled (i.e. type of shielding, type of material, expected attenuation in dB, etc.)
Earth station communicating with non-geostationary satellite orbits space station
The applicant should indicate the number of active antennas that their earth station would use to transmit to its associated space stations. For the purpose of generating a contour, the PFD level at a specific location should include the contribution of emissions from all the earth station’s antennas. The tracking strategies used in generating the contour should be specified.
| Earth station parameter | Value (unit) | Justification/Comments |
|---|---|---|
| Company | ||
| Earth station name/city | ||
| Latitude (deg, min, sec) | ||
| Longitude (deg, min, sec) | ||
| Flexible use frequency block(s) | ||
| Channel bandwidth (MHz) | ||
| Transmit power (dBW) | ||
| Height of the antenna centre above ground level (m) | ||
| Antenna gain (dBi) | ||
| Antenna elevation angle (deg) | ||
| Antenna azimuth (deg) | ||
| Antenna radiation pattern | ||
| Loss in + dB (e.g. waveguide) | ||
| Other parameters (relevant for the simulation/calculation) | ||
| Indicate if the parameters or values of the parameters above are identical to those provided in the licence application(s). If not, provide explanation. | ||
*For technical models, include versions number, where applicable.
| Assumption | Value (unit) | Justification/Comments |
|---|---|---|
| Simulation tool/software | ||
| PFD limit (dBm/m2/MHz) | ||
| Time percentage not to exceed the PFD limit (%) | ||
| Height above ground level for which the PFD was calculated (m) | ||
| Propagation model | ||
| Resolution of terrain and/or surface data (at least 90 m resolution or better) | ||
| Clutter model | ||
| Shielding model | ||
| Resolution between grid points used to model the contour | ||
| Other assumptions (relevant for the simulation/calculation) |
*For technical models, include versions number, where applicable.
| Earth station parameter | Value (unit) | Justification/Comments |
|---|---|---|
| Company | ||
| Earth station name/city | ||
| Latitude (deg, min, sec) | ||
| Longitude (deg, min, sec) | ||
| Flexible use frequency block(s) | ||
| Channel bandwidth (MHz) | ||
| Receiver system noise (dBm) | ||
| Protection criterion (e.g. I/N) (dB) | ||
| Height of the antenna centre above ground level (m) | ||
| Antenna gain (dBi) | ||
| Antenna elevation angle (deg) | ||
| Antenna azimuth (deg) | ||
| Antenna radiation pattern | ||
| Loss in + dB (e.g. waveguide) | ||
| Other parameters (relevant for the simulation/calculation) | ||
| Indicate if the parameters or values of the parameters above are identical to those provided in the licence application(s). If not, provide explanation. | ||
*For technical models include versions number, where applicable.
| Assumption | Value (unit) | Justification/Comments |
|---|---|---|
| Simulation tool/software | ||
| Description of flexible use system deployment (e.g. location, number of stations, type of stations, pointing of stations relative to earth station location) | ||
| Propagation model | ||
| Resolution of terrain and/or surface data (at least 90 m resolution or better) | ||
| Clutter model | ||
| Shielding model | ||
| Resolution between grid points used to model the contour | ||
| TDD activity factor | ||
| Other assumptions (relevant for the simulation/calculation) |
*For technical models include versions number, where applicable.
| Base station parameter | Value (unit) | Justification/Comments |
|---|---|---|
| Height above ground (m) | ||
| Channel bandwidth (MHz) | ||
| EIRP or TRP (dBm) | ||
| Antenna pattern model | ||
| Antenna downtilt (deg) | ||
| Antenna peak gain (dB) | ||
|
Number of antenna elements and horizontal/vertical spacing (if applicable) |
||
| Ohmic losses (dB) | ||
| Any other assumptions (relevant for the simulation/calculation) |
*For technical models include versions number, where applicable.
| User equipment (e.g. portable device or consumer premises equipment) parameter | Value (unit) | Justification/Comments |
|---|---|---|
| Height above ground (m) | ||
| Channel bandwidth (MHz) | ||
| EIRP or TRP (dBm) | ||
| Power control model | ||
| Antenna pattern model | ||
| Antenna pointing (e.g. at serving base station) | ||
| Antenna peak gain (dB) | ||
|
Number of antenna elements and horizontal/vertical spacing (if applicable) |
||
| Ohmic losses (dB) | ||
| Any other assumptions (relevant for the simulation/calculation) |
*For technical models include versions number, where applicable.
Annex D: Description of major infrastructure
For the purposes of applying this guideline, major infrastructure includes, but is not limited to, any of the following that resides inside the boundaries of a census metropolitan area (CMA) (for these purposes, as defined by Statistics Canada):
- major roadways (see table D1)
- stadiums or arenas in which professional sports teams play
- international airports
- urban mass transit routes such as bus rapid or rail transit (e.g. subways, light-rail, Go trains)
- cruise ship ports
The infrastructure listed above is not an exhaustive list. Infrastructure, such as roadways or major event venues, may be added at the discretion of spectrum management officers in district offices who have more detailed knowledge of local infrastructure.
| Province | CMA | List of roadways |
|---|---|---|
| Alberta | Calgary | HWY 1 (TCH), HWY 1A, HWY 2, HWY 2A, HWY 8, HWY 9, HWY 22, HWY 22X, HWY 66, HWY 68, HWY 72 |
| Edmonton | HWY 2, HWY 2A, HWY 14, HWY 15, HWY 16 (TCH), HWY 16A, HWY 19, HWY 21, HWY 22, HWY 28, HWY 31, HWY 37, HWY 38, HWY 39, HWY 43, HWY 44, HWY 60 | |
| Lethbridge | HWY 3, HWY 3A, HWY 4, HWY 5, HWY 23, HWY 25 | |
| British Columbia | Kelowna | HWY 33, HWY 97, HWY 97C, HWY 97c, HWY Coquihalla Connector HWY, Okanagan HWY, Old Okanagan HWY |
| Vancouver | HWY 1 (TCH), HWY 1A, HWY 10, HWY 17, HWY 91, HWY 91A, HWY 91 Conn, HWY 99, Burnet HWY, Dollarton HWY, Fraser HWY, Garibaldi HWY, Grandview HWY, Lougheed HWY, Mountain HWY, Scenic HWY, Steveston HWY, Upper Levels HWY, Westminster HWY | |
| Victoria | HWY 1 (TCH), Island HWY, Old Island HWY, Patricia Bay HWY | |
| Manitoba | Winnipeg | PTH 1(TCH), PTH 2, 3, 4, 6,7, 12, 26, 59, Perimeter 100, 101, Centerport Canada Way, Henderson, Oak Point, Old Henderson, Pembina |
| New Brunswick | Moncton | HWY 2, HWY 11, HWY 15 |
| Saint John | HWY 1, HWY 7 | |
| Nova Scotia | Halifax | HWY 101, HWY 102, HWY 103, HWY 107, HWY 111, HWY 118 |
| Ontario | Barrie | HWY 11, HWY 20, HWY 26, HWY 89, HWY 400 |
| Belleville | HWY 2, HWY 37, HWY 62, HWY 401 | |
| Brantford | HWY 24, HWY 403 | |
| Greater Sudbury | HWY 17 (TCH), HWY 69 (TCH), HWY 144 | |
| Guelph | HWY 6, HWY 7, HWY 401 | |
| Hamilton | HWY 5, HWY 6, HWY 8, HWY 403, HWY 407, Queen Elizabeth Way, Lakeshore Rd | |
| Kingston | HWY 2, HWY 15, HWY 33, HWY 38, HWY 401 | |
| Kitchener-Cambridge-Waterloo | HWY 7, HWY 8, HWY 24, HWY 85, HWY 401 | |
| London | HWY 4, HWY 7, HWY 401, HWY 402 | |
| Oshawa | HWY 7, HWY 12, HWY 35, HWY 115, HWY 401, HWY 407, HWY 412 | |
| Ottawa | HWY 7 (TCH), HWY 174, HWY 416, HWY 417 | |
| Peterborough | HWY 7 (TCH), HWY 7A, HWY 28, HWY 115 | |
| St. Catharines-Niagara | HWY 3, HWY20, HWY 58, HWY 58A, HWY 140, HWY 405, HWY 420, Queen Elizabeth Way | |
| Thunder Bay | HWY 11 (TCH), HWY 17 (TCH), HWY 61, HWY 102, HWY 130 | |
| Toronto |
HWY 2A, HWY 7, HWY 9, HWY 10, HWY 11, HWY 27, HWY 48, HWY 89, HWY 400, HWY 401, HWY 403, HWY 407, HWY 409, HWY 410, HWY 427, Don Valley PWKY, Gardiner Expressway, Allen Rd, Queen Elizabeth Way, Lakeshore Rd |
|
| Windsor | HWY 3, HWY 77, HWY 401, E.C. Row Expressway | |
| Quebec | Gatineau | AUT 5, AUT 50 |
| Montréal |
AUT 10, AUT 13, AUT 15, AUT 19, AUT 20, AUT 25, AUT 30, AUT 31, AUT 35, AUT 40, AUT 50, AUT 440, AUT 520, AUT 540, AUT 640, AUT 720, AUT 730, AUT 930 |
|
| Québec | AUT 20, AUT 40, AUT 73, AUT, 440, AUT 540, AUT 740, AUT 573, AUT 973 | |
| Saguenay | AUT 70 | |
| Sherbrooke | AUT 10, AUT 55, AUT 410, AUT 610 | |
| Trois-Rivières | AUT 30, AUT 40, AUT 55 | |
| Saskatchewan | Saskatoon | Circle Drive, HWY 2, HWY 5, HWY 7, HWY 11, HWY 12, HWY 14, HWY 27, HWY 41, HWY 45, HWY 60, Yellowhead HWY |
| Regina | Ring Rd, Trans-Canada HWY, HWY 6, HWY 10, HWY 11, HWY 20, HWY 33, HWY 39, HWY 46, HWY 48, HWY 49 |
Annex E: Method for determining the incremental population affected by the authorization of a proposed earth station
The population affected by the authorization of a proposed earth station in a particular Tier 4 service area is calculated based on the incremental number of people (population) that could be affected through the licensing of the proposed earth station. The incremental population is assessed by determining the number of individuals that would be covered by the incremental contour resulting from the authorization of the earth station.
For a scenario where the proposed earth station location is not co-located with any existing authorized earth stations, the incremental contour is the same as the transmit/receive contour of the proposed earth station.
For a scenario where the proposed earth station is co-located with existing authorized earth stations, the incremental contour is the portion of the proposed earth station’s transmit/receive contour that is not already covered by the transmit/receive contour of the existing authorized earth stations.
Spectrum grid cells (as defined by ISED) with associated census data will be used to calculate the incremental population contained in the incremental contour. An applicant must use the most recently available version of ISED’s grid cell data when demonstrating compliance with the requirements of this licensing guideline. ISED intends to publish all spectrum grid cell census information on the Spectrum Management and Telecommunications website. Until then, applicants should contact the local district office for a list of spectrum grid cells for area(s) around the proposed earth station in order to carry out the calculation required.
The incremental population affected by the authorization of the proposed earth station is computed assuming that the population is distributed uniformly within a particular grid cell. The incremental population affected by the proposed earth station is calculated by summing the fractional areas of each grid cell that are overlapped by the incremental contour. That is,
$$P_{inc} = \sum_{j = 1}^{N_{GC}}{POP(j)\frac{{AO}_{IC}(j)}{A_{GC}(j)}} $$
where
| j | is the range of grid cells overlapped by the incremental contour |
|---|---|
| Pinc | is the incremental population that is affected by the authorization of the proposed earth station |
| POP(j) | is the population in grid cell j |
| AOIC(j) | is the area defined by the portion of incremental contour that overlaps grid cell j |
| AGC(j) | is the area of grid cell j |
| NGC | is the number of grid cells overlapped by the incremental contour |
Figure E1 below shows an example of a proposed transmitting earth station that is co-located with two existing authorized co-located earth stations. In this figure, the blue contour is the transmit contour for the two existing authorized co-located earth stations. The orange contour is the transmit contour of the two existing authorized earth stations and the proposed earth station.
Figure E1: Proposed earth station transmit contour

Figure E2 below shows the incremental transmit contour, which is created by removing the sections of the orange contour that are overlapped by the blue contour.
Figure E2: Incremental contour of the proposed earth station

Annex F: Tier 4 service area aggregate population limits per flexible use frequency block
| Tier # | Service area name | Tier population (2016) | Aggregate population limit per flexible use frequency block, by number of people | Aggregate population limit per flexible use frequency block, by percent of tier population |
|---|---|---|---|---|
| 4-077 | Toronto | 7,030,750 | 25,000 | 0.36% |
| 4-051 | Montréal | 4,352,037 | 25,000 | 0.57% |
| 4-152 | Vancouver | 2,731,567 | 25,000 | 0.92% |
| 4-055 | Ottawa | 1,452,852 | 25,000 | 1.72% |
| 4-136 | Calgary | 1,416,856 | 25,000 | 1.76% |
| 4-141 | Edmonton | 1,325,857 | 25,000 | 1.89% |
| 4-030 | Québec | 904,330 | 25,000 | 2.76% |
| 4-111 | Winnipeg | 830,151 | 25,000 | 3.01% |
| 4-079 | Guelph/Kitchener | 707,534 | 25,000 | 3.53% |
| 4-086 | London/Woodstock/ St. Thomas |
678,149 | 25,000 | 3.69% |
| 4-154 | Victoria | 458,861 | 22,943 | 5.00% |
| 4-010 | Halifax | 435,820 | 21,791 | 5.00% |
| 4-090 | Windsor/Leamington | 401,719 | 20,086 | 5.00% |
| 4-151 | Kelowna | 362,815 | 18,141 | 5.00% |
| 4-094 | Barrie | 352,290 | 17,615 | 5.00% |
| 4-084 | Niagara-St. Catharines | 349,283 | 17,464 | 5.00% |
| 4-125 | Saskatoon | 306,824 | 15,341 | 5.00% |
| 4-037 | Trois-Rivières | 265,152 | 13,258 | 5.00% |
| 4-124 | Regina | 260,382 | 13,019 | 5.00% |
| 4-001 | St. John's | 255,012 | 12,751 | 5.00% |
| 4-042 | Sherbrooke | 250,227 | 12,511 | 5.00% |
| 4-028 | Chicoutimi-Jonquière | 218,377 | 10,919 | 5.00% |
| 4-137 | Red Deer | 206,387 | 10,319 | 5.00% |
| 4-155 | Nanaimo | 194,922 | 9,746 | 5.00% |
| 4-132 | Lethbridge | 189,709 | 9,485 | 5.00% |
| 4-081 | Kincardine | 185,818 | 9,291 | 5.00% |
| 4-100 | Sudbury | 178,872 | 8,944 | 5.00% |
| 4-018 | Moncton | 178,500 | 8,925 | 5.00% |
| 4-070 | Kingston | 177,314 | 8,866 | 5.00% |
| 4-074 | Peterborough | 165,516 | 8,276 | 5.00% |
| 4-017 | Fredericton | 164,871 | 8,244 | 5.00% |
| 4-050 | Joliette | 161,106 | 8,055 | 5.00% |
| 4-019 | Miramichi/Bathurst | 156,025 | 7,801 | 5.00% |
| 4-072 | Belleville | 154,982 | 7,749 | 5.00% |
| 4-003 | Gander/Grand Falls/ Windsor |
144,229 | 7,211 | 5.00% |
| 4-015 | Saint John | 142,898 | 7,145 | 5.00% |
| 4-009 | Bridgewater/Kentville | 139,289 | 6,964 | 5.00% |
| 4-087 | Brantford | 138,535 | 6,927 | 5.00% |
| 4-014 | Sydney | 131,379 | 6,569 | 5.00% |
| 4-128 | Prince Albert | 130,446 | 6,522 | 5.00% |
| 4-078 | Alliston | 129,279 | 6,464 | 5.00% |
| 4-092 | Sarnia | 123,953 | 6,198 | 5.00% |
| 4-108 | Thunder Bay | 121,061 | 6,053 | 5.00% |
| 4-134 | High River | 120,208 | 6,010 | 5.00% |
| 4-156 | Courtenay | 118,732 | 5,937 | 5.00% |
| 4-044 | Drummondville | 112,390 | 5,620 | 5.00% |
| 4-023 | Matane | 112,039 | 5,602 | 5.00% |
| 4-148 | Grande Prairie | 110,027 | 5,501 | 5.00% |
| 4-131 | Medicine Hat/Brooks | 107,233 | 5,362 | 5.00% |
| 4-160 | Kamloops | 106,972 | 5,349 | 5.00% |
| 4-047 | Granby | 105,440 | 5,272 | 5.00% |
| 4-097 | North Bay | 104,524 | 5,226 | 5.00% |
| 4-114 | Brandon | 103,743 | 5,187 | 5.00% |
| 4-127 | Battleford | 99,433 | 5,000 | 5.03% |
| 4-006 | Charlottetown | 95,350 | 5,000 | 5.24% |
| 4-167 | Prince George | 94,607 | 5,000 | 5.29% |
| 4-048 | St-Hyacinthe | 92,092 | 5,000 | 5.43% |
| 4-082 | Listowel/Goderich | 84,257 | 5,000 | 5.93% |
| 4-143 | Bonnyville | 83,631 | 5,000 | 5.98% |
| 4-026 | Rivière-du-Loup | 82,869 | 5,000 | 6.03% |
| 4-056 | Pembroke | 82,200 | 5,000 | 6.08% |
| 4-106 | Sault Ste. Marie | 80,833 | 5,000 | 6.19% |
| 4-150 | West Kootenay | 78,941 | 5,000 | 6.33% |
| 4-004 | Corner Brook/ Stephenville |
77,974 | 5,000 | 6.41% |
| 4-052 | Sainte-Agathe-des-Monts | 77,087 | 5,000 | 6.49% |
| 4-116 | Dauphin | 75,508 | 5,000 | 6.62% |
| 4-158 | Squamish/Whistler | 74,365 | 5,000 | 6.72% |
| 4-146 | Fort McMurray | 73,953 | 5,000 | 6.76% |
| 4-013 | Antigonish/ New Glasgow |
71,445 | 5,000 | 7.00% |
| 4-032 | Saint-Georges | 71,425 | 5,000 | 7.00% |
| 4-068 | Brockville | 70,563 | 5,000 | 7.09% |
| 4-067 | Cornwall | 69,729 | 5,000 | 7.17% |
| 4-089 | Chatham | 68,885 | 5,000 | 7.26% |
| 4-073 | Cobourg | 65,180 | 5,000 | 7.67% |
| 4-110 | Steinbach | 64,764 | 5,000 | 7.72% |
| 4-053 | Hawkesbury | 64,131 | 5,000 | 7.80% |
| 4-123 | Yorkton | 63,024 | 5,000 | 7.93% |
| 4-096 | Gravenhurst/ Bracebridge |
61,892 | 5,000 | 8.08% |
| 4-149 | East Kootenay | 60,371 | 5,000 | 8.28% |
| 4-049 | Sorel | 58,740 | 5,000 | 8.51% |
| 4-063 | Roberval/ Saint-Félicien |
58,438 | 5,000 | 8.56% |
| 4-029 | Montmagny | 56,808 | 5,000 | 8.80% |
| 4-040 | Victoriaville | 56,684 | 5,000 | 8.82% |
| 4-011 | Truro | 56,649 | 5,000 | 8.83% |
| 4-025 | Rimouski | 56,619 | 5,000 | 8.83% |
| 4-008 | Yarmouth | 55,609 | 5,000 | 8.99% |
| 4-121 | Moose Jaw | 55,141 | 5,000 | 9.07% |
| 4-138 | Wetaskiwin/Ponoka | 54,340 | 5,000 | 9.20% |
| 4-031 | Sainte-Marie | 53,258 | 5,000 | 9.39% |
| 4-113 | Morden/Winkler | 51,609 | 5,000 | 9.69% |
| 4-133 | Camrose | 51,420 | 5,000 | 9.72% |
| 4-088 | Stratford | 51,339 | 5,000 | 9.74% |
| 4-162 | Salmon Arm | 51,024 | 5,000 | 9.80% |
| 4-142 | Edson/Hinton | 49,814 | 5,000 | 10.04% |
| 4-095 | Midland | 49,059 | 5,000 | 10.19% |
| 4-054 | Mont-Laurier/ Maniwaki |
48,488 | 5,000 | 10.31% |
| 4-007 | Summerside | 47,557 | 5,000 | 10.51% |
| 4-065 | Port-Cartier/Sept-Iles | 46,983 | 5,000 | 10.64% |
| 4-093 | Strathroy | 46,727 | 5,000 | 10.70% |
| 4-122 | Swift Current | 46,219 | 5,000 | 10.82% |
| 4-119 | Estevan | 46,006 | 5,000 | 10.87% |
| 4-075 | Lindsay | 45,902 | 5,000 | 10.89% |
| 4-135 | Strathmore | 45,478 | 5,000 | 10.99% |
| 4-064 | Baie-Comeau | 43,675 | 5,000 | 11.45% |
| 4-058 | Rouyn-Noranda | 43,108 | 5,000 | 11.60% |
| 4-071 | Napanee | 42,993 | 5,000 | 11.63% |
| 4-102 | Timmins | 42,086 | 5,000 | 11.88% |
| 4-034 | Thetford Mines | 42,019 | 5,000 | 11.90% |
| 4-139 | Camrose | 40,145 | 5,000 | 12.45% |
| 4-024 | Mont-Joli | 37,788 | 5,000 | 13.23% |
| 4-129 | Lloydminster | 37,539 | 5,000 | 13.32% |
| 4-085 | Haldimand/Dunnville | 37,398 | 5,000 | 13.37% |
| 4-012 | Amherst | 33,373 | 5,000 | 14.98% |
| 4-144 | Whitecourt | 32,669 | 5,000 | 15.31% |
| 4-101 | Kirkland Lake | 32,402 | 5,000 | 15.43% |
| 4-057 | Arnprior/Renfrew | 31,367 | 5,000 | 15.94% |
| 4-083 | Fort Erie | 31,072 | 5,000 | 16.09% |
| 4-091 | Wallaceburg | 30,983 | 5,000 | 16.14% |
| 4-080 | Fergus | 30,010 | 5,000 | 16.66% |
| 4-039 | Asbestos | 29,744 | 5,000 | 16.81% |
| 4-046 | Farnham | 29,593 | 5,000 | 16.90% |
| 4-099 | Elliot Lake | 29,520 | 5,000 | 16.94% |
| 4-045 | Cowansville | 29,083 | 5,000 | 17.19% |
| 4-027 | La Malbaie | 28,193 | 5,000 | 17.73% |
| 4-126 | Watrous | 27,288 | 5,000 | 18.32% |
| 4-022 | Campbellton | 26,776 | 5,000 | 18.67% |
| 4-021 | Edmundston | 26,504 | 5,000 | 18.87% |
| 4-153 | Hope | 26,093 | 5,000 | 19.16% |
| 4-061 | Amos | 25,096 | 5,000 | 19.92% |
| 4-016 | St. Stephen | 25,087 | 5,000 | 19.93% |
| 4-020 | Grand Falls | 24,936 | 5,000 | 20.05% |
| 4-033 | Lac-Mégantic | 24,223 | 5,000 | 20.64% |
| 4-145 | Barrhead | 23,437 | 5,000 | 21.33% |
| 4-120 | Weyburn | 22,877 | 5,000 | 21.86% |
| 4-035 | Plessisville | 22,772 | 5,000 | 21.96% |
| 4-038 | Louiseville | 21,708 | 5,000 | 23.03% |
| 4-098 | Parry Sound | 21,123 | 5,000 | 23.67% |
| 4-076 | Minden | 20,813 | 5,000 | 24.02% |
| 4-060 | La Sarre | 19,349 | 5,000 | 25.84% |
| 4-043 | Windsor | 16,777 | 5,000 | 29.80% |
| 4-036 | La Tuque | 16,219 | 5,000 | 30.83% |
| 4-059 | Notre-Dame-du-Nord | 16,023 | 5,000 | 31.21% |
| 4-159 | Merritt | 15,649 | 5,000 | 31.95% |
| 4-140 | Vegreville | 15,396 | 5,000 | 32.48% |
| 4-002 | Placentia | 15,304 | 5,000 | 32.67% |
| 4-069 | Gananoque | 13,150 | 5,000 | 38.02% |
| 4-041 | Coaticook | 12,981 | 5,000 | 38.52% |
| 4-163 | Golden | 6,854 | 5,000 | 72.95% |
Annex G: Checklist for licensing guideline requirements
The checklists in tables G1 and G2 are intended to help applicants demonstrate compliance with the requirements specified in sections 3.1 and 3.2 of GL-10, issue 3 for each flexible use frequency block overlapped by the operation of the proposed earth station.
| Requirement | Description | Requirement satisfied? |
|---|---|---|
| Transmit/receive contour | The applicant has submitted a transmit/receive contour using the method described in annex B. | Yes/No |
| Maximum radius and area of the transmit/receive contour | The maximum radius and area of the transmit/receive contour are less than the values specified in section 3.2. If not, the applicant has submitted rationale justifying the need for any exceedance. |
Yes/No
|
| Requirement | Description | Requirement satisfied? |
|---|---|---|
| Transmit/receive contour | The applicant has submitted a transmit/receive contour using the method described in annex B. | Yes/No |
| Maximum radius and area of the transmit/receive contour | The maximum radius and area of the transmit/receive contour are less than the values specified in section 3.2. If not, the applicant has submitted rationale justifying the need for any exceedance. | Yes/No |
| Siting restrictions | The proposed earth station is not located within the boundaries of Tier 4 service area 4-051 (Montreal), 4-077 (Toronto) or 4-152 (Vancouver); an LPC; or an MPC. | Yes/No |
| Avoidance of some Tier 4 service areas and LPCs | The proposed earth station’s transmit/receive contour does not overlap Tier 4 service area 4-051 (Montreal), 4-077 (Toronto) or 4-152 (Vancouver), and/or an LPC in another tier. | Yes/No |
| Avoidance of major infrastructure | The applicant has demonstrated that the transmit/receive contour does not overlap any major infrastructure as described in annex D. | Yes/No |
| Incremental population limit | The applicant has demonstrated that the incremental population limit of 2,500 people is not exceeded for the Tier 4 service area in which the proposed earth station is located using ISED-published grid cell data. | Yes/No |
| Aggregate population limit | Licensing the proposed earth station would not result in the aggregate population limit, as specified in table 2 of section 3, being exceeded in all Tier 4 service areas overlapped by the earth station contour. | Yes/No |
The checklist in table G3 is intended to help applicants demonstrate compliance with section 5 of GL-10, issue 3 (applicable to applications for a modification to an earth station licensed in accordance with section 3) for each flexible use frequency block overlapped by the operation of the proposed earth station.
| Requirement | Description | Requirement satisfied? |
|---|---|---|
| Requirement to submit contours | The applicant has already submitted transmit/receive contours, as appropriate, describing the impact of the earth station. | Yes/No |
| Frequency required | The overlapped flexible use frequency block is the same as those in their existing licence for the corresponding earth station. | Yes/No |
| Potential increase in interference | The proposed modification of the earth station does not increase the shape or size of the transmit/receive contour, as appropriate, and as calculated using the method described in annex B. | Yes/No |
Annex H: Examples demonstrating compliance with GL-10, issue 3 requirements
This annex provides two examples that illustrate how compliance with GL-10, issue 3 requirements could be demonstrated in an application for an earth station licence:
- an example where the proposed earth station is not co-located with any existing authorized earth stations
- an example where the proposed earth station is co-located with two existing authorized earth stations
Example A: No existing authorized earth stations co-located with proposed earth station
The applicant submits the contour for a proposed transmitting earth station that operates within a particular flexible use frequency block, as illustrated in figure H1. Figure H1 shows the surrounding major roadways (in black and yellow), as well as the population in each grid cell. For the purpose of discussion, the grid cells have been divided into tiles that are enumerated A through D (vertically) and 1 through 6 (horizontally).
In this example, the proposed earth station:
- has emissions that overlap one flexible use frequency block;
- has a contour that overlaps a single Tier 4 service area that has a population greater than 500,000 people;
- is not located within the boundaries of Tier 4 service area 4-051 (Montreal), 4-077 (Toronto) or 4-152 (Vancouver), an LPC, or an MPC;
- has a contour that does not overlap Tier 4 service area 4-051 (Montreal), 4-077 (Toronto) or 4-152 (Vancouver), and/or an LPC in another tier; and
- the aggregate population counted for all existing authorized in the frequency block in the Tier 4 service area overlapped by the proposed earth station’s contour is 15,000.
Figure H1: Proposed earth station transmit contour for example A

- Transmit contour: The transmit contour is generated using the method described in annex B.
- Maximum radius and area of the transmit contour: The maximum radius of the transmit contour is 3.1 km. The area of the transmit contour is 6.21 km2. Since the maximum radius is less than 10 km and the area is less than 100 km2, the applicant is not required to submit information to justify the size of the contour.
- Siting restrictions: The proposed earth station is not located within the boundaries of Tier 4 service area 4-051 (Montreal), 4-077 (Toronto) or 4-152 (Vancouver); an LPC; or an MPC.
- Avoidance of some Tier 4 service areas and LPCs: The transmit contour does not overlap Tier 4 service area 4-051 (Montreal), 4-077 (Toronto) or 4-152 (Vancouver), and/or an LPC in another tier.
- Avoidance of major infrastructure within the transmit contour: The transmit contour does not overlap any major infrastructure within a CMA as described in annex D. Therefore, the proposed earth station would meet the conditions of this provision.
- Incremental population limit: In this example, the incremental contour is the same as the transmit contour. The incremental population that could be affected by authorization of the proposed earth station is 602.01 people (calculation shown in table H1 below), which is less than the incremental population limit of 2,500 people. Therefore, the proposed earth station would meet the conditions of this provision.
Table H1: Example calculation of population within the incremental contour of the proposed earth station depicted in figure H1 Grid cell tile label Area of grid cell overlapped by contour (km2) Percent of grid cell area* Population of grid cell Population affected in grid cell B2 0.0312 1.52% 200 3.04 B3 1.332 64.85% 500 324.25 B4 0.9485 46.18% 400 184.71 C3 1.738 84.62% 50 42.31 C4 1.171 57.01% 50 28.51 D3 0.664 32.33% 40 12.93 D4 0.3218 15.67% 40 6.27 TOTAL 602.01 *Calculated assuming a grid cell area of 2.054 km2 and rounded to the nearest one hundredth of a percent for the purpose of presentation. The calculation that produces the population affected in a grid cell uses the precise fraction and not the “percent of grid cell area” value presented in the table.
- Aggregate population limit: The population overlapped by the incremental contour represents an increase in the population within the Tier 4 service area of 602.11 people on the particular frequency block. Adding the incremental population to aggregate population impacted by existing earth stations would increase the aggregate population impacted in the Tier 4 service area to 15,602.11 people for this frequency block, which is less than the aggregate limit of 25,000. Therefore, the proposed earth station would meet the conditions of this provision.
In summary, using the checklist provided in table G2 in annex G, the following evaluation (see table H2) is made to demonstrate compliance with the requirements described in this guideline:
| Requirement | Description | Requirement satisfied? |
|---|---|---|
| Transmit/receive contour | The applicant has submitted a transmit/receive contour using the method described in annex B. | Yes |
| Maximum radius and area of the transmit/receive contour | The maximum radius and area of the transmit/receive contour are less than the values specified in section 3.2. If not, the applicant has submitted rationale justifying the need for exceeding limits. | Yes |
| Siting restrictions | The proposed earth station is not located within the boundaries of Tier 4 service area 4-051 (Montreal), 4-077 (Toronto) or 4-152 (Vancouver); an LPC; or an MPC. | Yes |
| Avoidance of some Tier 4 service areas and LPCs | The proposed earth station’s transmit/receive contour does not overlap Tier 4 service area 4-051 (Montreal), 4-077 (Toronto) or 4-152 (Vancouver), and/or an LPC in another tier. | Yes |
| Avoidance of major infrastructure | The applicant has demonstrated that the transmit/receive contour does not overlap any major infrastructure within a CMA as described in annex D. | Yes |
| Incremental population limit | The applicant has demonstrated that the incremental population limit of 2,500 people is not exceeded using ISED-published grid cell data. | Yes |
| Aggregate population limit | Authorizing the proposed earth station would increase the aggregate population impacted in the Tier 4 service area to 15,602.11 people for this frequency block, which is less than the aggregate limit of 25,000 for this Tier 4 service area. | Yes |
In the above example, the applicant has demonstrated that they meet all the requirements specified in this guideline.
Example B: Two existing authorized earth stations co-located with proposed earth station
The applicant submits a transmit contour for a proposed transmitting earth station (drawn as a dark orange icon in figure H2) that operates within one flexible use frequency block. The earth station is co-located with two existing authorized earth stations (drawn as light blue icons in figure H2.) The transmit contour for the proposed earth station, which is drawn in orange in figure H2, takes into account the aggregate emissions of the proposed earth station and the two co-located authorized earth stations. The transmit contour of the two existing authorized earth stations are in light blue in figure H2.
In this example, the applicant’s earth station:
- has emissions that overlap one flexible use frequency block;
- has a contour that overlaps a single Tier 4 service area that has a population greater than 500,000 people;
- is not located within the boundaries of Tier 4 service area 4-051 (Montreal), 4-077 (Toronto) or 4-152 (Vancouver); an LPC; or an MPC;
- has a contour that does not overlap Tier 4 service area 4-051 (Montreal), 4-077 (Toronto) or 4-152 (Vancouver), and/or an LPC in another tier; and
- the aggregate population counted for all existing authorized earth stations in the frequency block in the Tier 4 service area overlapped by the proposed earth station’s contour is 24,500.
Figure H2: Proposed earth station transmit contour for example B
Since the proposed earth station is co-located with existing authorized earth stations, an incremental contour is required for calculating the incremental population affected by the authorization of the proposed earth station. The incremental contour is created by deleting the sections of the authorized earth station’s transmit contour that overlap the proposed earth station’s transmit contour, as illustrated in figure H3. In figure H3, the incremental contour is drawn as a shaded orange contour. Figure H3 also shows the surrounding major roadways (in black and yellow), as well as the population in each grid cell. For the purpose of discussion, the grid cells have been divided into tiles that are enumerated A through D (vertically) and 1 through 6 (horizontally).
Figure H3: Incremental contour of proposed earth station for example B
- Transmit contour: The transmit contour is generated using the method described in annex B, taking into account the aggregate emissions of the two existing authorized earth stations.
- Maximum radius of the transmit contour: The maximum radius of the transmit contour is 3.5 km. The area of the contour is 18.77 km2. Since the radius is less than 10 km and the area is less than 100 km2, the applicant is not required to submit information to justify the size of the contour.
- Siting restrictions: The proposed earth station is not located within the boundaries of Tier 4 service area 4-051 (Montreal), 4-077 (Toronto) or 4-152 (Vancouver); an LPC; or an MPC.
- Avoidance of some Tier 4 service areas and LPCs: The transmit contour does not overlap Tier 4 service area 4-051 (Montreal), 4-077 (Toronto) or 4-152 (Vancouver), and/or an LPC in another tier.
- Avoidance of major infrastructure within the transmit contour: The transmit contour does not overlap any major infrastructure within a CMA as described in annex D. Therefore, the proposed earth station would meet the conditions of this provision.
- Incremental population limit: The incremental population that could be affected by the authorization of the proposed earth station is 900.70 people (calculation shown in table H3, below), which is less than the incremental population limit of 2,500 people. Therefore, the proposed earth station would meet the conditions of this provision.
Table H3: Example calculation of population within the incremental contour of the proposed earth station depicted in figure H3 Grid cell tile label Area of grid cell overlapped by contour (km2) Percent of grid cell area* Population of grid cell Population affected in grid cell A3 0.1993 9.70% 3001 291.19 A4 0.1246 6.07% 2553 154.87 B1 0.0371 1.81% 150 2.71 B2 0.5662 27.57% 200 55.13 B3 0.2245 10.93% 500 54.65 B4 0.3273 15.93% 400 63.74 B5 0.4638 22.58% 700 158.06 C1 0.3522 17.15% 25 4.29 C2 0.2954 14.38% 50 7.19 C3 0.7181 34.96% 50 17.48 C4 0.6419 31.25% 50 15.63 C5 0.226 11.00% 100 11.00 C6 0.2801 13.64% 200 27.27 D2 0.0111 0.54% 40 0.22 D3 1.153 56.13% 40 22.45 D4 0.7612 37.06% 40 14.82 TOTAL 900.70 *Calculated assuming a grid cell area of 2.054 km2 and rounded to the nearest one hundredth of a percent for the purpose of presentation. The calculation that produces the population affected in a grid cell uses the precise fraction and not the “percent of grid cell area” value presented in the table.
- Aggregate population limit: The population overlapped by the incremental contour represents an increase in the population within the Tier 4 service area of 900.70 people on the particular frequency block. Adding the incremental population to aggregate population impacted by existing earth stations would increase the aggregate population impacted in the Tier 4 service area to 25,400.70 people for this frequency block, which is more than the aggregate limit of 25,000. Therefore, the proposed earth station would not meet the conditions of this provision.
In summary, using the checklist provided in table G2 in annex G, the following evaluation (see table H4) is made to demonstrate compliance with the requirements described in this guideline:
| Requirement | Description | Requirement satisfied? |
|---|---|---|
| Transmit/receive contour | The applicant has submitted a transmit/receive contour using the method described in annex B. | Yes |
| Maximum radius and area of the transmit/receive contour | The maximum radius and area of the transmit/receive contour are less than the values specified in section 3.2. If not, the applicant has submitted rationale justifying the need for exceeding limits. | Yes |
| Siting restrictions | The proposed earth station is not located within the boundaries of Tier 4 service area 4-051 (Montreal), 4-077 (Toronto) or 4-152 (Vancouver); an LPC; or an MPC. | Yes |
| Avoidance of some Tier 4 service areas and LPCs | The proposed earth station’s transmit/receive contour does not overlap Tier 4 service area 4-051 (Montreal), 4-077 (Toronto) or 4-152 (Vancouver), and/or an LPC in another tier. | Yes |
| Avoidance of major infrastructure | The applicant has demonstrated that the transmit/receive contour does not overlap any major infrastructure within a CMA as described in annex D. | Yes |
| Incremental population limit | The applicant has demonstrated that the incremental population limit of 2,500 people is not exceeded for the Tier 4 service area in which the proposed earth station is located using ISED-published grid cell data. | Yes |
| Aggregate population limit | Authorizing the proposed earth station would increase the aggregate population impacted in the Tier 4 service area to 25,400.70 people for this frequency block, which is more than the aggregate limit of 25,000 for this Tier 4 service area. | No |
In the above example, not all requirements specified in this guideline have been met. Therefore, the earth station would not be authorized with a standard licence. See section 3.3 of this guideline for further information.