
The 2021 Price Comparison Study of Telecommunications Services in Canada and with Foreign Jurisdictions, prepared by Wall Communications Inc., is the fourteenth (2021) edition of the annual telecommunications services price comparison report. The purpose of this Study is to provide a detailed comparative price analysis of telecommunications services within Canada, as well as an international comparison (G7 + Australia).
As in previous years, the telecommunications services examined in this Study were classified in three categories: mobile wireless telephony, fixed line broadband internet, and mobile wireless internet. Individual service baskets were defined according to increasing levels of service usage and feature availability under each category.
National incumbents, regional service providers, and resellers/mobile virtual network operators were sampled for the Study. Domestically, prices were collected in six cities across Canada (Halifax, Montreal, Toronto, Winnipeg, Regina and Vancouver). Internationally, data was collected in seven countries, including four cities in the United States (Boston, Kansas City, Minneapolis and Seattle), and the largest city in all other countries (Australia, United Kingdom, France, Italy, Germany and Japan).
Prepared for Innovation, Science and Economic Development Canada
Wall Communications Inc.
Note: The views expressed in this document are solely those of Wall Communications Inc. and do not necessarily represent the views of Innovation, Science and Economic Development Canada or any other person or agency.
Executive summary
This is the fourteenth (2021) edition of ISED's annual telecom services price comparison study. The purpose of this Study is to provide a detailed comparative price analysis of telecommunications services in Canada both regionally and relative to the United States and six other countries. The individual service categories and related topics covered by the Study are:
- Mobile wireless;
- Fixed line broadband internet; and
- Mobile wireless internet.
For each individual service category, prices are measured for a series of defined "service baskets" which have been designed to reflect typical Canadian low to high telecom service usage levels and features. There are four to eight service baskets or "levels" defined for each service category. The lowest available advertised regular prices, as offered by the surveyed service providers included in the study, are used to measure the prices of each of the defined service baskets.
For Canada, the surveyed service providers include the incumbent telephone companies (e.g., Bell and TELUS), cable companies (e.g., Rogers, Shaw and Videotron), resellers (e.g., PC Mobile and Petro-Can), wholesale-based competitors (e.g. Distributel and TekSavvy), and regional wireless market providers (e.g., Freedom, SaskTel, Xplore Mobile, Videotron and EastLink). In addition, the largest Flanker brands (offered by the national mobile wireless providers or incumbent fixed broadband providers) are included and used for separate comparisons. Prices are measured in six metropolitan areas: Halifax, Montreal, Toronto, Winnipeg, Regina and Vancouver. Aggregate Canada-wide prices are determined on a weighted average basis.
For international comparison purposes, prices have also been measured using the same methodology for the same set of service baskets for seven other countries: Australia (Sydney), France (Paris), Germany (Berlin), Italy (Rome), Japan (Tokyo), the United Kingdom (London) and the United States (Boston, Kansas City, Minneapolis and Seattle).
Key changes to this year's Study include the addition of a new upper-level basket in Mobile Wireless Internet (data only) and a re-formatting of Level 8 in Mobile Wireless. We have also provided a spotlight section on device prices. Fixed broadband service baskets have also been slightly modified to remove potential ambiguities.
The highlights of this year's price comparison study update follow.
Mobile wireless
The 2021 eight mobile wireless baskets levels are:
- Level 1: 450 voice minutes and 300 SMS (texts);
- Level 2: 1 GB of data usage per month (no talk or text);
- Level 3: unlimited nationwide talk and text along with 2-4 GB of data;
- Level 4: unlimited nationwide talk and text along with 5-6 GB of data;
- Level 5: unlimited nationwide talk and text along with 7-9 GB of data;
- Level 6: unlimited nationwide talk and text along with 10-19 GB of data;
- Level 7: unlimited nationwide talk and text along with 20-49 GB of data; and
- Level 8: unlimited nationwide talk and text along with 50-99 GB of data.
Mobile wireless trends:
-
Domestic trends:
Prices across all baskets fell relative to 2020 – typically by double digit amounts. The average decrease in prices across all baskets was almost 15%. While longer term comprehensive historical perspectives are not possible (due to a major category reformatting in 2020), it appears that Canada is continuing to experience regular price declines every year.
The eight basket levels all displayed a noticeable degree of regional average price uniformity. Where exceptions to price uniformity occurred, they usually took place in either Quebec or Saskatchewan.
We note that in the years prior to 2020 price uniformity was relatively uncommon.
We observe that Level 1 – defined as 450 minutes of talk and 300 text messages – has become a rare service offering. Talk and text packages typically begin with unlimited minutes and texts (sometimes restricted by time of day or day of week, but also sometimes including data). Therefore, we have surveyed service offerings that essentially offer unlimited talk and text in the L1 category.
-
Regional provider prices:Footnote 1
The prices of regional providers (Freedom, SaskTel, Xplore Mobile, Videotron and Eastlink) typically resulted in average Canadian prices well below the average national price of incumbents, varying from 6% to 22% lower. The one exception was in the L4 category where regional prices were 17% higher than incumbent prices. However, we note that an L4 basket was only offered by two regional providers (SaskTel and Xplore Mobile), limiting the comparison.
The greatest price differentials between incumbents and a regional provide occur in Ontario and BC (where Freedom offers mobile wireless service). Prices offered by Freedom were almost 70% lower (in L1) and averaged a more than 35% discount relative to incumbent prices in the five baskets where Freedom and one or more incumbents offered a service.
As was the case last year, regional providers rarely provided a Level 8 (50-99 GB) basket. Thus, the incumbents largely serve that segment of the market.
There was a considerable amount of price variability by the regionals in most baskets (that is, the price offered by a regional provider for a given basket in its serving area could differ noticeably from the same basket price offered by the regional provider in another territory). By contrast, the incumbents displayed greater price uniformity across the country.
-
Incumbent main flanker brand prices:Footnote 2
Incumbent flanker brand prices were largely uniform across the country.
As has been the case previously, flanker prices tend to be lower, in some cases significantly lower, than the Incumbents' prices. In baskets where both a flanker and an incumbent plan is offered, the average national flanker price is between 7% and 36% lower than the average incumbent national price.
Flanker prices do not show any clear trend with respect to regional provider prices – in some regions, and in some baskets, they are lower and at times higher. Where both flankers and regionals offered the same basket, flankers were higher priced 15 times and lower priced 13 times. We do note that regional provider prices were consistently lower than flanker prices in Ontario and BC.
-
Reseller/mobile virtual network operator (MVNO) prices:
Resellers tend to offer relatively few service baskets and their plans are typically at the lower to middle end of the service spectrum. In the four baskets where both resellers and incumbents offer plans (L1, L3, L4 and L5), the reseller average Canadian price is consistently lower.
Reseller prices tend to be uniform across the country.
-
Market observation:
A regional provider – Freedom (L1 and L5) or SaskTel (L2 and L8) - provide the lowest (or equal to the lowest) available price offered across the country in four of eight categories. A reseller offers the lowest (or equal to the lowest) price in 2 categories (L3 and L4). Xplore Mobile offers the highest price in four categories.
In most regions, customers can usually find at least one service offering in a basket that is considerably lower than the national average price.
-
International comparison:
Canada, the US and Japan tend to have the highest prices internationally. Japan has the highest price in all baskets except for L8 where Canada has the highest price. One or more of the European countries (the UK, France, Italy) and Australia tend to have the lowest prices in each basket.
Fixed broadband internet
Seven broadband Internet service baskets are included in the study, which are primarily defined on the basis of download speed:
- Level 1: speeds of 3 to 9 Mbps;
- Level 2: speeds of 10 to 15 Mbps;
- Level 3: speeds of 16 to 40 Mbps;
- Level 4: speeds of 41 to 100 Mbps;
- Level 5: speeds of 101 to 250 Mbps;
- Level 6: speeds of 251 to 500 Mbps; and
- Level 7: speeds greater than 500 Mbps.Footnote 3
Trends in fixed broadband service:
-
Domestic national trends:
Canadian fixed broadband prices in all baskets increased in every basket except for L2 (10-15 Mbps). The highest increase of 13% occurred in L5 (251–500 Mbps).
-
Regional trends:
In a trend that mirrors the mobile wireless segment, average regional prices tended towards uniformity in 2021. That is the spread between the lowest and highest regional average price has shrunk in all baskets.
Montreal displayed the lowest (or equal to the lowest) average regional price in 5 of 7 baskets. Toronto and Halifax each had the highest price in 2 baskets.
-
Wholesale-based competitor (WBC) and flanker brand prices:
In four of the six baskets where incumbents and WBCs both offer a service plan, the WBC has the lower price. WBC prices are between 8% and 18% lower. However, in the highest two baskets (L6 and L7) WBC prices are roughly 15% higher.
Fixed broadband flankers have recently emerged in the Canadian market, currently operating in both Quebec and Ontario. In Quebec Bell has offered a Virgin fixed broadband service since 2016 while Videotron introduced Fizz in 2019. The Virgin and Fizz broadband prices tend to match each other.
Incumbent flanker brand broadband service is only offered in Ontario and Quebec. In all cases where both the incumbent primary and their flanker brands offer a service, the flanker price is lower than the incumbent price. Flanker prices also tend to be lower than the WBC prices, although the number of points of comparison is limited.
-
Other providers:
In recent years the Canadian market has seen the entry of smaller alternative fixed broadband providers. These "other" providers operate with their own facilities, use the facilities of a facilities-based ISP or operate with a combination of the two. In general, other ISPs tend to operate in more densely populated urban areas although smaller providers can and do sometimes offer service in rural and remote areas. Central Canada (i.e. Ontario and Quebec) have the largest number of "other" providers in their major cities (i.e. Toronto and Montreal) with fewer providers operating further west or east.
The "other" ISPs may offer prices equal to or lower than the larger providers. In some cases, a provider (such as FibreStream, a fibre-optic based provider in condo developments in several cities across Canada) offers high to very high speed plans at very low relative prices.
-
International comparison:
The offering of lower level (e.g. L1 and L2) fixed broadband plans appears to be gradually diminishing over time. Only two countries (Canada and Japan) offer services in L1 or L2. Basket levels L3 to L7 are well represented among the surveyed countries. At the high end, almost every country now has at least one provider with a 1 Gbps plan.
There are few if any discernible international trends in fixed broadband pricing. We do note that the US has followed a downward price trend over the last few years. Canada now has higher prices than the US in most baskets. Canada has higher prices in 2021 versus 2020 in every basket except L2. Japan had higher prices in 4 of 7 baskets in 2021 relative to 2020. However, while Japan had higher prices than Canada in L1 to L3, in all other baskets the Canadian prices were higher than Japan.
Mobile internet
Four mobile Internet service baskets are included in the study. Level 1 covers plans providing 2 to 4 GB, Level 2 covers plans providing 5 to 10 GB, Level 3 covers plans providing 11 to 49 GB and the new L4 covers plans with 50 to 99 GB of data usage per month.
-
Domestic trends:
Canadian mobile Internet prices decreased in L1 and L2 but increased in L3. L4 was just introduced this year and therefore has no historical comparison. Mobile Internet (data only) prices, unlike mobile wireless and fixed broadband, have exhibited a great deal of uniformity across regions over the last several years. Prices in Regina have been the exception (for L2 and L3, being significantly lower than other regions (and also for the newly introduced L4 basket).
-
Regionals' pricing:
Prices charged by regional providers are much lower than incumbent average prices. On a national basis, regional provider prices were 25%, 21%, 18% and 37% lower than incumbent prices for L1, L2, L3 and L4 respectively. We note an exception to the general rule in Quebec where the regional provider prices are uniformly higher than the incumbent prices.
-
International comparison:
Canadian and Japanese mobile Internet prices remain high relative to other surveyed countries in all baskets. Canada has the highest prices in L3 and L4 while Japan has the highest prices in L1 and L2.
Summary data tables
The following table provides a summary of the 2020 price comparison results for Canada and the seven surveyed foreign jurisdictions included in the study. All reported prices for the surveyed foreign jurisdictions exclude sales taxes and are expressed in purchasing power parity (PPP) adjusted Canadian dollars.
| - | Canada | U.S.A. | Australia | U.K. | France | Italy | Germany | Japan |
|---|---|---|---|---|---|---|---|---|
| Wireless service | ||||||||
| Level 1 (Talk and text) | $26.70 | $49.19 | n/a | n/a | $6.78 | n/a | n/a | $32.67 |
| Level 2 (1 GB) | $24.92 | n/a | n/a | $21.47 | n/a | n/a | n/a | $34.51 |
| Level 3 (2-4 GB data) | $39.09 | $54.11 | n/a | $27.82 | n/a | n/a | $17.75 | $86.62 |
| Level 4 (5-6 GB data) | $45.47 | $45.79 | n/a | $21.43 | $25.63 | $21.82 | $42.02 | $99.95 |
| Level 5 (7-9 GB data) | $54.13 | $43.15 | n/a | $17.66 | n/a | n/a | n/a | $110.72 |
| Level 6 (10-19 GB data) | $62.77 | $63.52 | $32.30 | $24.24 | $39.45 | n/a | $61.45 | $73.62 |
| Level 7 (20-49 GB data) | $76.23 | n/a | $40.09 | $31.05 | $33.66 | $31.07 | $77.63 | $110.47 |
| Level 8 (50-99 GB data) | $121.06 | n/a | $55.52 | $38.97 | $37.72 | $36.29 | n/a | $118.13 |
| Broadband service | ||||||||
| Level 1 (3-9 Mbps) | $47.60 | n/a | n/a | n/a | n/a | n/a | n/a | $73.10 |
| Level 2 (10-15 Mbps) | $51.54 | n/a | n/a | n/a | n/a | n/a | n/a | $74.28 |
| Level 3 (16-40 Mbps) | $66.31 | $59.11 | $59.61 | $41.82 | $28.25 | $41.27 | $50.52 | $76.04 |
| Level 4 (41-100Mbps) | $77.98 | $78.87 | $81.97 | $49.24 | n/a | n/a | $51.94 | $66.63 |
| Level 5 (100-249 Mbps) | $95.00 | $76.66 | n/a | $73.95 | n/a | n/a | $57.54 | $84.70 |
| Level 6 (250-500 Mbps) | $98.08 | $94.10 | n/a | $82.57 | $36.47 | n/a | n/a | $63.00 |
| Level 7 (500 Mbps+) | $108.71 | $108.40 | n/a | $91.19 | $44.36 | $42.02 | $54.38 | $85.58 |
| Mobile internet | ||||||||
| Level 1 (2-5 GB) | $32.13 | n/a | n/a | $15.43 | n/a | n/a | $21.80 | $59.23 |
| Level 2 (5-10 GB) | $62.18 | $52.27 | $15.86 | $20.59 | $25.26 | n/a | $30.04 | $76.06 |
| Level 3 (11-49 GB) | $96.99 | $71.67 | $23.31 | $28.45 | $34.37 | $26.76 | $38.63 | $73.41 |
| Level 4 (50-99 GB) | $132.30 | $96.59 | $43.05 | $43.11 | $65.97 | $21.34 | n/a | $101.24 |
Wall Communications Inc. 2021
The year over year price changes for each basket are provided below.
| - | 2021 | 2020 | YoY% 2021/20 |
|---|---|---|---|
| Wireless service | |||
| Level 1 (Talk and text) | $26.70 | $30.63 | -12.83% |
| Level 2 (1 GB) | $24.92 | $31.82 | -21.67% |
| Level 3 (2-4 GB data) | $39.09 | $45.30 | -13.71% |
| Level 4 (5-6 GB data) | $45.47 | $51.21 | -11.20% |
| Level 5 (7-9 GB data) | $54.13 | $61.65 | -12.19% |
| Level 6 (10-19 GB data) | $62.77 | $74.57 | -15.83% |
| Level 7 (20-49 GB data) | $76.23 | $91.04 | -16.27% |
| Level 8 (50-99 GB data) | $121.06 | $123.11 | -1.67% |
| Broadband service | |||
| Level 1 (3-9 Mbps) | $47.60 | $44.37 | 7.77% |
| Level 2 (10-15 Mbps) | $51.54 | $54.61 | -5.60% |
| Level 3 (16-40 Mbps) | $66.31 | $61.62 | 6.47% |
| Level 4 (41-100Mbps) | $77.98 | $77.18 | 1.29% |
| Level 5 (100-249 Mbps) | $95.00 | $83.95 | 13.39% |
| Level 6 (250-500 Mbps) | $98.08 | $97.16 | 2.00% |
| Level 7 (500+ Mbps) | $108.71 | $107.55 | 1.37% |
| Mobile internet | |||
| Level 1 (2-4 GB) | $32.13 | $42.63 | -24.63% |
| Level 2 (5-10 GB) | $62.18 | $66.10 | -5.93% |
| Level 3 (10-49 GB) | $96.99 | $84.79 | 14.39% |
| Level 4 (50-99 GB) | $132.30 | - | - |
Wall Communications Inc. 2021
1.0 Introduction
This study provides a 2021 update of the previous annual telecommunications price comparison studies conducted since 2008.Footnote 4
The consumer telecom service categories covered in this study include the following categories:Footnote 5
- Mobile wireless telephony;
- Fixed line broadband Internet; and
- Mobile wireless Internet.
A series of service baskets reflecting different service usage and feature levels was established for each service category in the first Study of 2008. Consistency in category characteristics over time is sought to the extent possible. However, key market changes may lead to some category revisions. Service category revisions and additions have occurred in past years and are noted where relevant. In short, the Studies attempt to balance maintaining consistent categories over time (to allow for inter-temporal comparisons) while recognizing that key technological and market changes should be reflected in the prices being tracked.
The objective of these studies is to capture what a new customer would need to pay for a chosen level – or target level within a basket range – of service. As such, the service range allows us to capture the non-uniform offerings of providers while still spanning the very wide variance in plans offered domestically and internationally. Moreover, this "consumer-centric" approach allows us to collect the lowest regular price available to a consumer for service within a well-defined series of ranges.
In the 2021 Study there have been some changes in the mobile wireless service baskets relative to past years. Level 8 has been re-specified as 50–99GB versus 50+GB in the previous year. A more complete description of basket changes is provided in the Methodology section.
For Canada, the study provides a comparison of prices for each defined basket in each service category for the following cities: Halifax, Montreal, Toronto, Winnipeg, Regina and Vancouver. Service prices for Canada as a whole are derived as the weighted averages (according to provincial market share and population weights) of the prices measured for each of the six surveyed cities. For mobile wireless and mobile Internet, the prices of national service providers (i.e. national MNOs), regional providers, flanker brands and resellers (MVNOs) are reported. For fixed broadband, prices from cable companies, telephone companies, flankers and wholesale-based competitors (WBCs) are reported.
The study also measures prices for the same set of service category baskets for Australia, France, Germany, Italy, Japan, the United Kingdom (U.K.) and the United States (U.S.). As a result, the study covers all G7 countries along with Australia. Major service providers in each country are surveyed. Service basket prices in these seven foreign jurisdictions are compared with those measured for Canada.
There are some notable modifications and additions to this year's StudyFootnote 6:
- As noted, there has been a re-specification of mobile wireless basket L8;
- Fizz Mobile has been added in the Quebec market;
- Roaming services offered in the Canadian and US markets are no longer examined;
- The cost of devices is now examined in a separate Spotlight section;
- As usual, market share data has been updated where available (for all service categories);
- The comparisons between provider category prices have been expanded in fixed broadband; and
- A new service level (L4: 50-99GB) has been added in the Mobile Internet Service (Data-only) category.
As was done in past Studies, MVNO pricing and comparisons to incumbent and flanker pricing in Canada has been included. For fixed broadband, pricing from wholesale-based competitors (WBCs) has been gathered and is compared to incumbent and flanker brand pricing.
We note that the construction of price indices is not an exact science and there are multiple methodologies that can be employed. However, the general data collection and indexing methodology used in all the annual Canadian Telecom Pricing Studies has been adopted by other agencies around the world (including the OECD) and provides a proven and useful snapshot of the listed prices available to consumers for various levels of telecom services.Footnote 7
The basic methodological philosophy adopted in this Study is to identify what a consumer would have to pay for that consumer's chosen level of service. Since the number of service options available to a consumer can be extremely large, we group service levels into ranges (or service baskets) and then identify the lowest cost plan from a given provider within that service level range.
In terms of layout, the next section of this report, Section 2, provides a brief review of the methodology used to measure and compare service basket prices, and describes in more detail all changes made in the 2021 study relative to last year's study. The remaining three sections of the report, Sections 3 through 5, provide Canadian and international price comparison results for mobile wireless, fixed broadband Internet and mobile Internet, respectively. A detailed summary of all service baskets and bundles included in the study is provided in Attachment 1. Historical domestic price levels for various services and baskets are provided in Attachment 2. International historical price series are provided in Attachment 3.
2.0 Methodology
2.1 Service basket design
As in previous studies, this study relies on the service basket-based price comparison methodology described in Wall Communications' 2008 methodology report.Footnote 8 Various modifications to the 2008 methodology have been made in successive studies primarily to reflect changes in service usage patterns or market characteristics over time.
The price comparison methodology used in this study is based on a "service basket" approach where separate telecom service baskets are defined on the basis of increasing "levels" of service usage, features and, where applicable, performance. A service basket typically has a range of plan characteristics or main elements designed to reflect an increasing quality – or value - of the plans within the basket. The number of defined service basket levels for each of the stand-alone telecom services considered in this study varies from four to eight in total:
- Mobile wireless: Basket levels 1 to 8
- Broadband internet access: Basket levels 1 to 7
- Mobile internet access: Basket levels 1 to 4.
Each of the service baskets has been designed to reflect, as applicable, a range of service volumes or levels, that are generally intended to capture a broad range of typical Canadian consumer usage levels, including mid-level or an "average" consumption basket for a typical Canadian consumer.
The specific service elements included in each service basket are described in the following sections and the associated service elements and usage assumptions in each case are also summarized in Attachment 1.
2.2 Canadian price data collection: Detailed methodology
The Canadian price data included in the study has been collected from a variety of telecom service providers (TSPs), including incumbent telephone companies (i.e., Bell Aliant, Bell Canada and TELUS) and incumbent cable companies (i.e., Eastlink, Videotron, Rogers, Access and Shaw). The Flanker brands of the incumbent service providers are examined, as well as "Fizz" (the Flanker brand of Videotron). Service prices from mobile wireless resellers Petro-Can and PC Mobile as well as wholesale-based competitors in fixed broadband (Distributel and Teksavvy) are also collected for the Study. In addition, mobile wireless services offered by regional wireless service providers Freedom, EastLink, Xplore Mobile, Videotron and SaskTel are also taken into account. In terms of geographic coverage, price data is collected for each of the following six Canadian cities: Halifax, Montreal, Toronto, Winnipeg, Regina and Vancouver. Table 1 provides a list of the surveyed Canadian service providers in this year's study broken out by city and by service basket.
| City | Service baskets | Service providers |
|---|---|---|
| Halifax | Fixed Broadband Internet | Bell Aliant, Eastlink, Teksavvy and Distributel/Primus |
| Mobile Wireless | Bell, TELUS, Rogers, Eastlink, PC Mobile, Petro-Can, Incumbent Flanker Brands | |
| Mobile Internet | Bell, TELUS, Rogers, Eastlink, Primus | |
| Montreal | Fixed Broadband Internet | Bell, Videotron, Distributel/Primus, TekSavvy and Fizz |
| Mobile Wireless | Bell, TELUS, Rogers, Primus, Videotron, PC Mobile, Petro-Can, Incumbent Flanker Brands, Fizz | |
| Mobile Internet | Bell, TELUS, Rogers, Videotron, Primus | |
| Toronto | Fixed Broadband Internet | Bell, Rogers, Distributel/Primus, Teksavvy |
| Mobile Wireless | Bell, TELUS, Rogers, Primus, Freedom, Petro-Can, PC Mobile, Incumbent Flanker Brands | |
| Mobile Internet | Bell, TELUS, Rogers, Freedom, Primus | |
| Winnipeg | Fixed Broadband Internet | Bell, Shaw, TekSavvy |
| Mobile Wireless | Bell, TELUS, Rogers, PC Mobile, Petro-Can, Incumbent Flanker Brands, Xplore Mobile | |
| Mobile Internet | Bell, TELUS, Rogers, Xplore Mobile, Primus | |
| Regina | Fixed Broadband Internet | SaskTel, Access Communications, TekSavvy, VMedia |
| Mobile Wireless | SaskTel, Bell, TELUS, Rogers, PC Mobile, Primus, Petro-Can, Incumbent Flanker Brands | |
| Mobile Internet | SaskTel, Bell, TELUS, Rogers, Primus | |
| Vancouver | Fixed Broadband Internet | TELUS, Shaw, Distributel/Primus, TekSavvy |
| Mobile Wireless | Bell, TELUS, Rogers, Primus, Freedom, PC Mobile, Incumbent Flanker Brands | |
| Mobile Internet | Bell, TELUS, Rogers, Freedom, Primus |
Wall Communications Inc. 2021
City-specific prices for each of the stand-alone service baskets offered by the TSPs listed in Table 1 are determined using each service provider's respective estimated subscriber-based market share as weights.Footnote 9 In addition, to determine Canada-wide market prices, city-specific prices are aggregated using corresponding provincial population levels as weights. Weighted average prices for each surveyed city and for Canada are provided in Attachment 2 for each of the service baskets included in this study.
In addition, for the mobile wireless service baskets, services offered by the incumbents' flanker brand services – i.e., Bell Virgin, Rogers Fido and TELUS Koodo – are also taken into account. The incumbents' flanker brand service prices are included in the calculation of the above-noted city-specific and national aggregate prices.Footnote 10 In Section 3.2 below, the incumbents' flanker brand prices are compared with incumbents' and regionals' mobile wireless prices as a separate analysis.
The price data collected for this study is drawn from the surveyed TSPs' websites and, where necessary, supplemented with further clarifications from customer service representatives (CSRs).Footnote 11 The price data reflects currently advertised prices that are generally available to new customers or existing customers changing service plans. The lowest available currently advertised price is used to determine the total price of each service basket. For this purpose, regular or "basic" prices are used – short-term promotional discounts available to new customers are not taken into account.Footnote 12
A Spotlight section examines the retail price of selected handset devices currently on offer from incumbents, regionals, flankers and MVNOs.
2.3 International price data collection: Detailed methodology
Seven foreign jurisdictions are included in the study: Australia, France, Germany, Italy, Japan, the U.K. and the U.S. With the exception of the U.S., in each case, price data was collected for the services available in each country's largest city. For the U.S., four cities of varying size distributed across that country were used – i.e., Boston, Kansas City, Minneapolis and Seattle. The service providers surveyed by country and, as applicable by city, are summarized in Table 2.Footnote 13
| City | Basket | Service providers |
|---|---|---|
| United States | ||
| Boston, MA | Fixed Broadband Internet | Verizon, Comcast/Xfinity |
| Mobile Wireless | AT&T, Verizon, Sprint/T-Mobile | |
| Mobile Internet | AT&T, Verizon, Sprint/T-Mobile | |
| Kansas City, MO | Fixed Broadband Internet | AT&T, Time Warner |
| Mobile Wireless | AT&T, Verizon, Sprint/T-Mobile | |
| Mobile Internet | AT&T, Verizon, Sprint/T-Mobile | |
| Minneapolis, MN | Fixed Broadband Internet | CenturyLink, Comcast/Xfinity |
| Mobile Wireless | AT&T, Verizon, Sprint, T-Mobile | |
| Mobile Internet | AT&T, Verizon, Sprint/T-Mobile | |
| Seattle, WA | Fixed Broadband Internet | CenturyLink, Comcast/Xfinity |
| Mobile Wireless | AT&T, Verizon, Sprint/T-Mobile | |
| Mobile Internet | AT&T, Verizon, Sprint/T-Mobile | |
| United Kingdom | ||
| London | Fixed Broadband Internet | BT, Virgin, EE, Talk Talk |
| Mobile Wireless | EE, Virgin, Vodafone, O2, "3" | |
| Mobile Internet | EE, Virgin, Vodafone, O2, "3" | |
| Australia | ||
| Sydney | Fixed Broadband | Telstra and Optus |
| Mobile Wireless/Internet | Telstra, Optus, Vodafone, Virgin | |
| France | ||
| Paris | Fixed Broadband Internet | Orange (France Telecom), SFR (Neuf Cegetel) |
| Mobile Wireless/Internet | Orange, SFR, Free, Bouygues Telecom | |
| Germany | ||
| Berlin | Fixed Broadband Internet | DT, KD/Vodafone |
| Mobile Wireless/Internet | DT, KD/Vodafone, Telefonica (E-plus, O2) | |
| Italy | ||
| Rome | Fixed Broadband Internet | Telecom Italia, FastWeb |
| Mobile Wireless/Internet | Telecom Italia (TIM), Vodafone, WIND, "3" | |
| Japan | ||
| Tokyo | Fixed Broadband Internet | NTT, J:Com, KDDI, Yahoo! BB |
| Mobile Wireless/Internet | NTT DoCoMo, Softbank, au KDDI, Y!Mobile | |
Wall Communications Inc. 2021
For international price comparison purposes, foreign currency prices have been converted to Canadian dollars using currency market exchange rates adjusted for purchasing power parity (PPP) differences between countries. For this study, the OECD's latest available PPP comparative price level indexes for 2021 were used for this purpose.Footnote 14
Canadian dollar-based price comparisons between Canada and other countries can be affected significantly by year-over-year currency exchange rate fluctuations. PPP-adjusted exchange rates take into account both changes in exchange rates and PPP adjustment factors between countries and, therefore, generally provide a more appropriate economic basis for comparing price levels between countries. For this reason, all of the international price comparison results shown in the main body of this report are based on PPP-adjusted exchange rate Canadian dollars.
It should be noted that fluctuations in both exchange rates and PPP adjustment factors could affect international price comparisons over time. This caveat is particularly relevant to inter-temporal comparisons given the significant changes in both exchange rates and PPP adjustment factors that can occur over time.
As well, it should also be noted that service prices in the U.K., France, Germany, Italy, Australia and Japan are typically quoted inclusive of retail value added taxes (VAT) or goods and services taxes (GST). Where appropriate, we have excluded applicable VAT or GST charges to improve cross-country comparisons of service prices.Footnote 15 On the other hand, where applicable, other industry-specific regulatory fees and surcharges are included for price comparison purposes (e.g., 9-1-1 fees, universal service fees and other regulatory fees).
3.0 Mobile wireless service
3.1 Mobile wireless service baskets
As in previous studies, the following mobile wireless service element charges, where applicable, are considered for price comparison purposes:
- Network access/airtime charges (taking into account defined amounts of daytime, evening and weekend minute volumes as appropriate);
- Service feature charges as appropriate (e.g., voice mail, call display and others);
- All mandatory fixed fees (e.g. system access, E911);
- SIM charges as appropriate;
- Short message service (SMS) or text message charges; and
- Data service charges.
As a general point, we note that several service elements have diminished in importance as service plan differentiators over the past ten years. These include distinctions in time of day or week minutes, optional features and long distance versus local minutes. On the other hand, data allotment has grown in prominence – in some cases being the key service characteristic that is marketed.
There are several notable charges or costs that are excluded from the calculation of mobile service prices in this study, including: certain one-time charges (such as waiveable activation fees) and roaming charges. Device or handset costs are also excluded.
Eight mobile wireless service baskets are included in the study. Each basket consists of the following main elements:
- Level 1: 450 voice minutes and 300 SMS (texts);
- Level 2: 1 GB of data usage per month (no talk or text);
- Level 3: unlimited nationwide talk and text along with 2-4 GB of data;
- Level 4: unlimited nationwide talk and text along with 5-6 GB of data;
- Level 5: unlimited nationwide talk and text along with 7-9 GB of data;
- Level 6: unlimited nationwide talk and text along with 10-19 GB of data;
- Level 7: unlimited nationwide talk and text along with 20-49 GB of data; and
- Level 8: unlimited nationwide talk and text along with 50-99 GB of data.
Attachment 1 provides a more detailed summary of each of the service elements and usage assumptions included in all eight mobile wireless service baskets.
Prices are measured for each of the mobile wireless service baskets based on a TSP's standard mobile service plan rates. Where applicable, both "pre-paid" and "post-paid" service options are considered. The less expensive of the two options is used to determine the service basket price.
3.2 Canadian mobile wireless prices
Figure 1 provides a summary of 2021 Canadian prices for all eight mobile wireless service baskets. Weighted average prices range from $26.70 per month for a Level 1 plan to $121.06 per month for a Level 8 Canada-wide unlimited talk and text plan with 50-99 GB of data. The cost of Level 2 (1GB of data standalone) is $24.92.
Figure 1
2020 Average Canadian Mobile Wireless Prices by Service Basket

The significant revamping of service basket definitions last year makes direct comparisons with most pre-2020 baskets inappropriate. Historical data can be found in the Appendix, with the caveat that basket definitions have changed over time.
- The Level 1 mobile wireless service basket price was $26.70. Average 2021 Level 1 prices varied by city, from a low of $24.19 in Regina to a high of $27.53 in Montreal. As such, average prices were very uniform across the country.
Canadian Wireless Level 1

Wall Communications Inc. 2021 - The Level 2 average Canadian price was $24.92 – as the basket is defined, this is essentially the cost of purchasing 1 GB of stand-alone data on a mobile wireless smartphone plan. While prices in most jurisdictions were generally well above $20 (and as high as almost $30 in one region), the average price was just above $16 in Regina.
Canadian Wireless Level 2

Wall Communications Inc. 2021 - The Level 3 service basket average price was $39.09. Again, prices across the country were very uniform, with a low of $37.77 in Regina to a high of $39.69 in Halifax.
Canadian Wireless Level 3

Wall Communications Inc. 2021 - The Level 4 service basket prices were consistent across the country, except for Regina with a price of $50.23 relative to all other regions where prices varied from a low of $45.08 in Toronto to a high of $45.61 in Montreal. The average price was $45.47.
Canadian Wireless Level 4

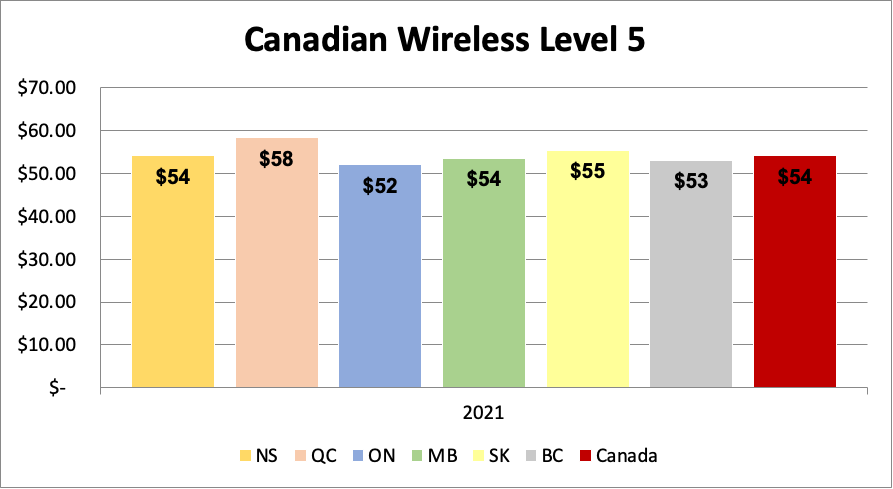
Wall Communications Inc. 2021 - Level 5 prices varied from $52.02 in Toronto to $58.27 in Montreal. The national average price was $54.13, down from $61.65 in 2020.
Canadian Wireless Level 5
Wall Communications Inc. 2021 - Level 6 prices showed greater variability across the country, with the highest price of $68.68 in Regina while the lowest price of $52.70 was found in Montreal. The average national price was $62.77.
Canadian Wireless Level 6

Wall Communications Inc. 2021 - Level 7 prices were lowest in Montreal ($58.67) versus a high of $85.15 in Regina. The average Canadian price was $76.23.
Canadian Wireless Level 7

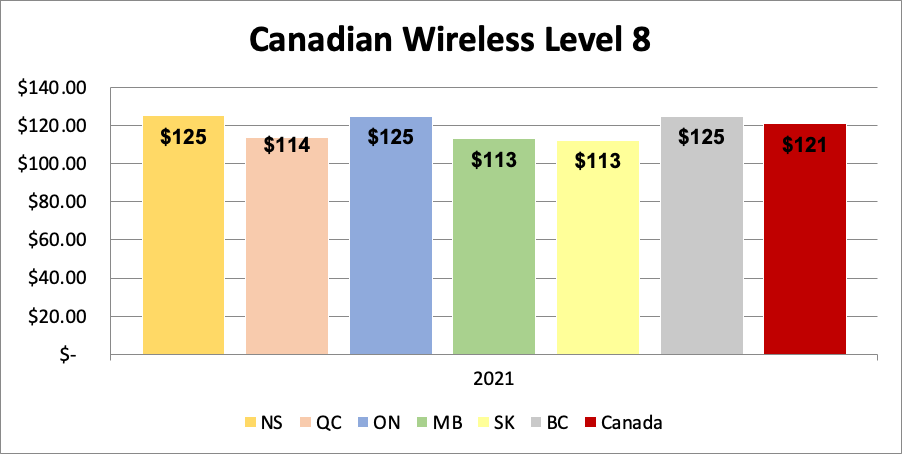
Wall Communications Inc. 2021 - Level 8 prices averaged $121.06, with a low of $112.51 in Regina and a high of $125.43 in Halifax.
Canadian Wireless Level 8
Wall Communications Inc. 2021
The general trend of falling mobile wireless prices continued in 2021 relative to 2020. Prices fell an (unweighted) average of 17.5% this year across all baskets. The lowest average regional mobile wireless prices were found in Montreal for higher-level (L6 – L7) service baskets. For lower-level baskets (L1 – L3), prices were lowest in Regina. There was no region that consistently had higher prices than other regions.
Comparison of incumbent and regional providers prices
A comparison of average mobile wireless rates for the incumbent carriers and the regional carriers is provided in Table 3 below. The comparison is provided for six cities: Vancouver and Toronto (where Freedom operates), Montreal (where Videotron operates), Winnipeg (Xplore Mobile), Regina (SaskTel) and Halifax (where Eastlink operates). For each of the cities, the incumbent carriers include Rogers, Bell and TELUS. Flankers are not included.
| - | NS | QC | ON | MB | SK | BC | Canada |
|---|---|---|---|---|---|---|---|
| Level 1 | |||||||
| Incumbents | $27.21 | $27.24 | $26.78 | $26.78 | $28.66 | $26.78 | $27.24 |
| Regionals | $30.55 | $30.46 | $8.25 | $35.00 | $22.09 | $8.25 | $22.43 |
| Difference | 12.26% | 11.81% | -69.20% | 30.68% | -22.93% | -69.20% | -17.66% |
| Level 2 | |||||||
| Incumbents | N/A | N/A | N/A | N/A | N/A | N/A | N/A |
| Regionals | N/A | N/A | $19.00 | $40.00 | $15.00 | $19.00 | $23.25 |
| Difference | N/A | N/A | N/A | N/A | N/A | N/A | N/A |
| Level 3 | |||||||
| Incumbents | $40.71 | $40.46 | $40.28 | $40.28 | $42.16 | $40.28 | $40.69 |
| Regionals | $35.55 | $40.46 | $34.00 | $45.00 | $35.83 | $34.00 | $37.47 |
| Difference | -12.67% | 0.00% | -15.59% | 11.72% | -15.01% | -15.59% | -7.91% |
| Level 4 | |||||||
| Incumbents | $45.74 | $45.77 | $45.31 | $45.31 | $47.19 | $45.31 | $45.77 |
| Regionals | N/A | N/A | N/A | $55.00 | $52.09 | N/A | $53.55 |
| Difference | N/A | N/A | N/A | 21.38% | 10.38% | N/A | 16.98% |
| Level 5 | |||||||
| Incumbents | $55.81 | $55.84 | $55.38 | $55.38 | $57.26 | $55.38 | $55.84 |
| Regionals | N/A | N/A | $40.00 | $60.00 | N/A | $40.00 | $46.67 |
| Difference | N/A | N/A | -27.77% | 8.34% | N/A | -27.77% | -16.43% |
| Level 6 | |||||||
| Incumbents | $80.43 | $50.46 | $80.00 | $65.00 | $66.88 | $80.00 | $70.46 |
| Regionals | $50.55 | $50.46 | $45.00 | $70.00 | $70.83 | $45.00 | $55.31 |
| Difference | -37.15% | 0.00% | -43.75% | 7.69% | 5.91% | -43.75% | -21.51% |
| Level 7 | |||||||
| Incumbents | $83.76 | $55.46 | $83.33 | $71.67 | $73.55 | $83.33 | $75.18 |
| Regionals | $65.55 | $65.46 | $65.00 | N/A | $90.83 | $65.00 | $70.37 |
| Difference | -21.74% | 18.03% | -22.00% | N/A | 23.50% | -22.00% | -6.41% |
| Level 8 | |||||||
| Incumbents | $125.43 | $113.79 | $125.00 | $113.33 | $115.21 | $125.00 | $119.63 |
| Regionals | N/A | N/A | N/A | N/A | $110.83 | N/A | $110.83 |
| Difference | N/A | N/A | N/A | N/A | -3.80% | N/A | -7.35% |
Unweighted averages used for incumbents and regionals within a region. Unweighted prices can vary significantly from the weighted prices used in calculating national averages but can be suitable for comparing incumbents and regionals within a region. National averages use population weighting.
Wall Communications Inc. 2021
As shown in Table 3, the prices offered by regional carriers are uniformly lower than incumbent prices when averaged across the country (with the exception of L4). Regionals prices were considerably (i.e. almost 17%) higher than incumbents in L4 but we note that only two regional providers provided plans in this basket. Conditions do vary from province to province and from plan to plan. However, we note that regional prices in Ontario and BC are consistently lower than incumbent prices. In those baskets where each offers a plan. The relative price discounts (on average) available from the regionals vary from about 6% less (Level 7) to 21.5% (Level 6). On average, national average regional prices are about 10% lower than incumbent prices (again, with the exception of L4).
Incumbent flanker brand prices
Incumbent flanker brand services Bell Virgin, Rogers Fido, and TELUS Koodo are available across the country.Footnote 16
Table 4 below provides a summary of incumbent primary brand, incumbent flanker brand and regional mobile wireless service prices for 2021 in Halifax, Montreal, Toronto, Winnipeg, Regina and Vancouver for each of the mobile wireless service baskets. It also provides percentage rate differentials between the incumbents' primary and flanker brands as well as the incumbents' flanker brands and the regionals. Flanker prices are consistently lower than incumbent prices, varying from 36% lower in L7 to 7% lower in L4. On average, flanker national average prices are just over 14% lower than incumbent national average prices (in regions where both incumbents and flankers offer a plan). Price differentials are relatively uniform across regions in most levels but vary considerably in L6. For example, incumbent prices are 52% higher than flanker prices in Nova Scotia, Ontario and BC but only 3% higher in Quebec.
Flanker and incumbent price differentials are lower in Quebec, Manitoba and Saskatchewan than in other provinces in L6, similar to our general findings in past years.
| - | NS | QC | ON | MB | SK | BC | Canada |
|---|---|---|---|---|---|---|---|
| Level 1 | |||||||
| Flankers | $25.34 | $25.20 | $25.06 | $25.06 | $26.15 | $25.06 | $25.31 |
| Incumbents | $27.21 | $27.24 | $26.78 | $26.78 | $28.66 | $26.78 | $27.24 |
| Regionals | $30.55 | $30.46 | $8.25 | $35.00 | $22.09 | $8.25 | $22.43 |
| Diff I/F | 7.37% | 8.11% | 6.88% | 6.88% | 9.59% | 6.88% | 7.63% |
| Diff Rg/F | 20.54% | 20.88% | -67.08% | 39.68% | -15.54% | -67.08% | -11.37% |
| Level 2 | |||||||
| Flankers | $28.43 | $28.46 | $28.00 | $28.00 | $29.88 | $28.00 | $28.46 |
| Incumbents | N/A | N/A | N/A | N/A | N/A | N/A | N/A |
| Regionals | N/A | N/A | $19.00 | $40.00 | $15.00 | $19.00 | $23.25 |
| Diff I/F | N/A | N/A | N/A | N/A | N/A | N/A | N/A |
| Diff Rg/F | N/A | N/A | -32.14% | 42.86% | -49.80% | -32.14% | -18.31% |
| Level 3 | |||||||
| Flankers | $36.70 | $36.39 | $36.42 | $36.42 | $37.51 | $36.42 | $36.64 |
| Incumbents | $40.71 | $40.46 | $40.28 | $40.28 | $42.16 | $40.28 | $40.69 |
| Regionals | $35.55 | $40.46 | $34.00 | $45.00 | $35.83 | $34.00 | $37.47 |
| Diff I/F | 10.91% | 11.18% | 10.60% | 10.60% | 12.38% | 10.60% | 11.05% |
| Diff Rg/F | -3.14% | 11.18% | -6.64% | 23.57% | -4.49% | -6.64% | 2.27% |
| Level 4 | |||||||
| Flankers | $42.79 | $42.81 | $42.50 | $42.50 | $43.60 | $42.50 | $42.78 |
| Incumbents | $45.74 | $45.77 | $45.31 | $45.31 | $47.19 | $45.31 | $45.77 |
| Regionals | N/A | N/A | N/A | $55.00 | $52.09 | N/A | $53.55 |
| Diff I/F | 6.91% | 6.93% | 6.62% | 6.62% | 8.25% | 6.62% | 6.99% |
| Diff Rg/F | N/A | N/A | N/A | 29.41% | 19.48% | N/A | 25.16% |
| Level 5 | |||||||
| Flankers | $50.43 | N/A | $50.00 | $50.00 | $51.57 | $50.00 | $50.40 |
| Incumbents | $55.81 | $55.84 | $55.38 | $55.38 | $57.26 | $55.38 | $55.84 |
| Regionals | N/A | N/A | $40.00 | $60.00 | N/A | $40.00 | $46.67 |
| Diff I/F | 10.67% | N/A | 10.76% | 10.76% | 11.04% | 10.76% | 10.80% |
| Diff Rg/F | N/A | N/A | -20.00% | 20.00% | N/A | -20.00% | -7.41% |
| Level 6 | |||||||
| Flankers | $52.79 | $49.14 | $52.50 | $52.50 | $53.60 | $52.50 | $52.17 |
| Incumbents | $80.43 | $50.46 | $80.00 | $65.00 | $66.88 | $80.00 | $70.46 |
| Regionals | $50.55 | $50.46 | $45.00 | $70.00 | $70.83 | $45.00 | $55.31 |
| Diff I/F | 52.37% | 2.69% | 52.38% | 23.81% | 24.78% | 52.38% | 35.06% |
| Diff Rg/F | -4.24% | 2.69% | -14.29% | 33.33% | 32.15% | -14.29% | 6.01% |
| Level 7 | |||||||
| Flankers | N/A | $55.46 | N/A | N/A | N/A | N/A | $55.46 |
| Incumbents | $83.76 | $55.46 | $83.33 | $71.67 | $73.55 | $83.33 | $75.18 |
| Regionals | $65.55 | $65.46 | $65.00 | N/A | $90.83 | $65.00 | $70.37 |
| Diff I/F | N/A | 0.00% | N/A | N/A | N/A | N/A | 35.56% |
| Diff Rg/F | N/A | 18.03% | N/A | N/A | N/A | N/A | 26.88% |
| Level 8 | |||||||
| Flankers | N/A | N/A | N/A | N/A | N/A | $125.00 | N/A |
| Incumbents | $125.43 | $113.79 | $125.00 | $113.33 | $115.21 | $125.00 | $119.63 |
| Regionals | N/A | N/A | N/A | N/A | $110.83 | N/A | $110.83 |
| Diff I/F | N/A | N/A | N/A | N/A | N/A | 0.00% | N/A |
| Diff Rg/F | N/A | N/A | N/A | N/A | N/A | N/A | N/A |
Wall Communications Inc. 2021
Table 4 also includes the regionals' average prices for the same cities and provides percentage-based price differentials between the regionals' and incumbents' flanker brand prices. The regionals' prices are lower than the incumbents' flanker brand prices in some baskets (e.g. L1, L2, L5), but higher in the other baskets. The relationship between flanker prices and regional operator prices varies widely across regions and basket levels with no clear pattern.
Regional prices in Ontario and BC are typically lower than incumbent flanker brand while elsewhere flanker prices are often lower than regional provider prices. In addition, the trend of flanker prices moving towards incumbent primary service prices has also lessened, such that flanker prices for some baskets have moved back closer to regional prices relative to incumbent prices.
Reseller or non-affiliated MVNO prices
Mobile wireless service prices offered by two resellers or non-affiliated mobile virtual network operators (MVNO) – i.e., Primus and PC Mobile – were also collected. Table 5 provides a summary of the national-level price differentials between the incumbents' primary brands and MVNOs for each of the mobile service baskets. Resellers offer lower prices – often substantially lower - than incumbents in every basket where they compete. We note that resellers do not offer higher level baskets (L6 to and L8).
| - | NS | QC | ON | MB | SK | BC | Canada |
|---|---|---|---|---|---|---|---|
| Level 1 | |||||||
| Incumbents | $27.21 | $27.24 | $26.78 | $26.78 | $28.66 | $26.78 | $27.24 |
| Resellers | $24.84 | $24.85 | $24.70 | $24.70 | $25.33 | $24.70 | $24.85 |
| Difference | -8.71% | -8.77% | -7.78% | -7.78% | -11.64% | -7.78% | -8.78% |
| Level 2 | |||||||
| Incumbents | N/A | N/A | N/A | N/A | N/A | N/A | N/A |
| Resellers | $20.00 | $20.00 | $20.00 | $20.00 | $20.00 | $20.00 | $20.00 |
| Difference | N/A | N/A | N/A | N/A | N/A | N/A | N/A |
| Level 3 | |||||||
| Incumbents | $40.71 | $40.46 | $40.28 | $40.28 | $42.16 | $40.28 | $40.69 |
| Resellers | $34.39 | $34.40 | $34.25 | $34.25 | $34.87 | $34.25 | $34.40 |
| Difference | -15.52% | -14.98% | -14.98% | -14.98% | -17.28% | -14.98% | -15.47% |
| Level 4 | |||||||
| Incumbents | $45.74 | $45.77 | $45.31 | $45.31 | $47.19 | $45.31 | $45.77 |
| Resellers | $41.37 | $41.38 | $41.15 | $41.15 | $42.09 | $41.15 | $41.38 |
| Difference | -9.56% | -9.59% | -9.18% | -9.18% | -10.81% | -9.18% | -9.59% |
| Level 5 | |||||||
| Incumbents | $55.81 | $55.84 | $55.38 | $55.38 | $57.26 | $55.38 | $55.84 |
| Resellers | $48.44 | $48.44 | $48.44 | $48.44 | $48.44 | $48.44 | $48.44 |
| Difference | -13.21% | -13.26% | -12.54% | -12.54% | -15.41% | -12.54% | -13.26% |
| Level 6 | |||||||
| Incumbents | $80.43 | $50.46 | $80.00 | $65.00 | $66.88 | $80.00 | $70.46 |
| Resellers | N/A | N/A | N/A | N/A | N/A | N/A | N/A |
| Difference | N/A | N/A | N/A | N/A | N/A | N/A | N/A |
| Level 7 | |||||||
| Incumbents | $83.76 | $55.46 | $83.33 | $71.67 | $73.55 | $83.33 | $75.18 |
| Resellers | N/A | N/A | N/A | N/A | N/A | N/A | N/A |
| Difference | N/A | N/A | N/A | N/A | N/A | N/A | N/A |
| Level 8 | |||||||
| Incumbents | $125.43 | $113.79 | $125.00 | $113.33 | $115.21 | $125.00 | $119.63 |
| Resellers | N/A | N/A | N/A | N/A | N/A | N/A | N/A |
| Difference | N/A | N/A | N/A | N/A | N/A | N/A | N/A |
Wall Communications Inc. 2021
Finally we note that reseller prices tend to be highly uniform across the country, in contrast to incumbent prices.
High and low prices
For Canada, the highest and lowest prices (offered by specific providers) are provided in Table 6 below. We would note that Fizz (2), SaskTel (2) and Freedom Mobile (1) had the lowest (or equal to lowest) price offering in five of the eight baskets. In two instances, reseller prices were the lowest (or equal to the lowest) available.
| Baskets | - | Canada Low | Canada High | Canada Average |
|---|---|---|---|---|
| 1) Talk and text | Price | $8.25 | $35.00 | $26.75 |
| WSP | Freedom (ON, BC) | Xplore Mobile (MB) | - | |
| 2) 1 GB, data only | Price | $15.00 | $40.00 | $27.40 |
| WSP | SaskTel (SK) | Xplore Mobile (MB) | - | |
| 3) 2-4 GB data | Price | $30.00 | $45.00 | $39.16 |
| WSP | PC Mobile | Xplore Mobile (MB) | - | |
| 4) 5-6 GB data | Price | $40.00 | $55.00 | $45.47 |
| WSP | Primus | Xplore Mobile (MB) | - | |
| 5) 7-9 GB data | Price | $35.46 | $60.00 | $53.44 |
| WSP | Fizz (QC) | Xplore Mobile (MB) | - | |
| 6) 10-19 GB data | Price | $41.46 | $80.43 | $62.17 |
| WSP | Fizz (QC) | Rogers (NS, ON, BC) | - | |
| 7) 20-49 GB data | Price | $55.46 | $90.43 | $75.82 |
| WSP | Rogers, TELUS, Virgin (QC) | Rogers (NS, ON, BC), SaskTel (SK) | - | |
| 8) 50-99 GB data | Price | $110.00 | $125.43 | $121.06 |
| WSP | Rogers (QC, MB, SK), SaskTel (SK) | Bell, Rogers, TELUS (NS, ON, BC) | - |
Wall Communications Inc. 2021
We would note that an individual vendor price that is considerably lower than the national average can be found in all baskets and in most regions. While the lowest price in Canada is found in various provinces (with Ontario, BC and Quebec often registering the lowest price), the highest price for low to mid-level baskets (L1 through L5) is found in Manitoba (from Xplore Mobile) while the upper-level basket high price is found most often in Nova Scotia, Ontario and BC.
3.3 International mobile wireless service prices
As noted in previous studies, there are a number of important pricing differences that should be borne in mind when comparing Canadian and foreign mobile wireless prices.Footnote 17
- Price structure: The pricing of mobile wireless service plans in the U.K., Germany, Italy, France, Australia and Japan differs significantly compared to Canada (as well as the U.S.). Mobile wireless prices in Europe, Australia and Japan are set on a "calling party pays" basis, under which mobile customers pay only for outgoing calls. In contrast, Canadian and U.S. pricing plans are based on a "receiving party pays" approach, under which customers pay for incoming and outgoing calls. Unlike Canada and the U.S., some mobile wireless service plans in Europe, Australia and Japan also include per call setup charges and/or different per minute call rates to landline versus mobile customers, as well as potentially different per minute rates for on-net versus off-net mobile calls. However, as in Canada, unlimited national calling plans and service add-ons that cover calls to both fixed and mobile and both on and off-net mobile lines are now commonly available. In addition, several European vendors offer plans that include calling to other European countries at no additional charge.
- Regulatory fees: Regulatory fees of one form or another apply in the cases of Canada, Japan and the U.S. In Canada, there is typically an explicit emergency 9-1-1 fee and, in some cases, universal service fees (as in the case of Japan). In the U.S., there are a variety of regulatory fees, federal and state USF surcharges and other fees.Footnote 18 We have collected these, where applicable, updated USF fees and carrier-specific regulatory cost recovery charges.
The Charts below provide a comparison of current mobile wireless prices for Canada and the surveyed foreign jurisdictions for each of the eight wireless service baskets. All prices are expressed in PPP-adjusted Canadian dollars and exclude retail sales taxes. Attachment 3 provides more detailed international mobile wireless price information for each country and basket. Again, it should be noted that the resizing of baskets in 2020 makes historical comparisons with earlier years inappropriate.
We also note that Level 8 is defined in 2021 as 50-99 GB (vs. 50 GB+ in 2020). There are numerous plans available internationally that offer 100 GB to unlimited data at various prices. These plans are tracked but are not included in the comparisons since they fall outside the specified range. In some cases, an international vendor's price for a 100 GB (or higher) plan is priced comparably (or even lower) than Canadian plans in the 50-99 GB range.
As a few general observations, we note that Australia, France, Italy and Germany offer very few plans lower than L6. Australia in fact doesn't offer any in that range. The growing absence of lower-level plans from international providers is a trend we have noticed over the last few years.
Japan has the highest prices at all levels except for L8 (where Canada takes top spot). Japan, Canada and the US consistently have higher prices than the other surveyed countries.
| - | Canada | U.S.A. | Australia | U.K. | France | Italy | Germany | Japan |
|---|---|---|---|---|---|---|---|---|
| Level 1 | $26.70 | $49.19 | n/a | n/a | $6.78 | n/a | n/a | $32.67 |
| Level 2 | $24.92 | n/a | n/a | $21.47 | n/a | n/a | n/a | $34.51 |
| Level 3 | $39.09 | $54.11 | n/a | $27.82 | n/a | n/a | $17.75 | $86.62 |
| Level 4 | $45.47 | $45.79 | n/a | $21.43 | $25.63 | $21.82 | $42.02 | $99.95 |
| Level 5 | $54.13 | $43.15 | n/a | $17.66 | n/a | n/a | n/a | $110.72 |
| Level 6 | $62.77 | $63.52 | $32.30 | $24.24 | $39.45 | n/a | $61.45 | $73.62 |
| Level 7 | $76.23 | n/a | $40.09 | $31.05 | $33.66 | $31.07 | $77.63 | $110.47 |
| Level 8 | $121.06 | n/a | $55.52 | $38.97 | $37.72 | $36.29 | n/a | $118.13 |
Wall Communications Inc. 2021
Individual basket level results are discussed below.
- In the case of the Level 1 mobile wireless service basket, the Canadian average price of $26.70 is surpassed by the U.S. at $49.19 but remains much higher than the lowest price of $6.78 (France). This basket is somewhat problematic in comparing prices. The defined category is 450 talk minutes and 300 texts; however, no plan anywhere meets this criterion. We note that over time, offerings have tended to migrate to an unlimited number of talk minutes and texts for a flat price as the lowest available talk and text plan. Consequently, that criterion is used for L1 (with one caveat – the French plan has unlimited minutes and text but only between the hours of 9 PM and midnight).
- In our view, this evolution in plans demonstrates the increasing relative importance of data allowances over talking (and texting). In fact, there are relatively few offerings of just talk and text – the vast majority of mobile wireless plans offered today include at least some data.
- The price for the US plan (and all other US plans) includes a relatively steep FCC USF component (set at 29.1% as of Q4, 2021).
International Wireless Level 1

Wall Communications Inc. 2021
- For the Level 2 service basket – simply 1 GB of data - the Canadian average price of $24.92 is higher than the average UK price and considerably lower than the average price in Japan. Again, very few vendors throughout the world offer just a 1 GB plan. Four of five vendors in the UK offer a 1 GB plan where all plans include unlimited talk and text. We note that the US, Australia, France, Italy and Germany do not offer stand-alone 1 GB data plans.
International Wireless Level 2

Wall Communications Inc. 2021
- In 2020, all eight countries surveyed offered an L3 plan; this year (2021), only 5 countries had vendors that offered a plan in this range. For the Level 3 wireless service basket, the average Canadian monthly rate of $39.09 is in the middle of surveyed countries, but is well below the highest price of $86.62 found in Japan and the $54.11 in the US.
International Wireless Level 3

Wall Communications Inc. 2021
- In the case of the Level 4 basket with 5-6 GB of monthly data allowance, the Canadian average price of $45.47 is slightly lower than the US and much lower than the average price in Japan but higher than the UK, France, Italy and Germany.
International Wireless Level 4

Wall Communications Inc. 2021
- The Level 5 price in Canada of $54.13 is higher than either the price in the US or the UK but is well below Japan. The Canadian average price is considerably above the lowest price of $17.66 found in the UK.
International Wireless Level 5

Wall Communications Inc. 2021
- The Level 6 price in Canada or $62.77 is lower than the prices in both the US and Japan ($63.52 and $73.62 respectively) but again much higher than the price in the UK ($24.24) or prices in Australia and France ($32.30 and $39.45 respectively).
International Wireless Level 6

Wall Communications Inc. 2021
- The Level 7 (20 to 49 GB) price in Canada is $76.23, just slightly below the $77.63 price found in Germany and well below Japan ($110.47). The lowest prices are found in Italy ($31.07) and the UK ($31.05).
International Wireless Level 7

Wall Communications Inc. 2021
- The Level 8 (50 to 99 GB) price in Canada is $121.06, just slightly above the next highest price ($118.13 found in Japan). The prices in Australia, the UK, France and Italy are considerably lower.
International Wireless Level 8

It is worth noting that surveyed average prices for the UK, France, Italy and Australia generally fall below the prices in Canada for all defined mobile wireless service baskets.
3.4 Spotlight: Selected handset costs in Canada
As part of the 2021 Telecom Price Comparison report, data on the prices of some popular mobile wireless devices (both high end and lower end devices) have been collected. Two of the most recently introduced high end smartphones have been surveyed (Apple iPhone 13 and the Galaxy Z Fold3) along with a mid-level device (Galaxy A32) and two lower end devices (Galaxy A12 and Moto G Power). As noted below, an additional roster of devices – specifically very low cost devices - was also surveyed.
We have grouped vendors into four key categories: incumbents (Bell, Rogers and TELUS); primary flanker brands (Virgin, FIDO and Koodo for the incumbents and Fizz for Videotron); secondary flanker brands (Lucky, Chatr and Public Mobile); and regional vendors (SaskTel, Eastlink, Freedom, Videotron and Xplore Mobile). In addition, because the secondary flanker brands did not offer many of the devices noted above, we selected an additional roster of devices (Moto E, Alcatel 1B, Alcatel Flip 3 and ZTE Blade A3 L). Where these devices we offered by other vendors, we have included those other vendors' device prices.
In general, the price for the Apple iPhone 13 is fairly uniform as offered by various vendors. The differential between the high and low prices 7.8%. However, it should be noted that 10 of the 11 surveyed vendor offerings were within $37 (or 3.2%) of each other. The highest price (uniform across incumbents and their primary flanker brands) was $1,135 while the lowest price ($1,047) was offered by the regional provider Eastlink.
The other higher-end device (Galaxy Z Fold3) had considerably more price dispersion. Prices varied between $2,256 and $2,803 (or 19.4%). The incumbent providers generally had the highest price for this device while the lowest price was offered by Eastlink and closely followed by all other regional providers who offered the phone for sale.
The mid-level device (Galaxy A32) also exhibited considerable price variability. The lowest price was posted by Eastlink and Xplore Mobile ($360) while Bell and Virgin had the highest price at $440.
Among the lower-level devices, the highest price was again offered by an incumbent and its flankers (Bell, Virgin and Lucky) at $246 for the Galaxy A32. For the Moto G Power, Bell and Virgin advertised the lowest price at $293 while Rogers advertised the highest price at $325.
As noted, the secondary incumbent flanker brands tended to not offer the same devices as the main incumbent company brand or their primary flanker brands. The prices of these four lowest level devices varied from $70 to $170 but with only a $20 difference between the same devices.
Table 8: Prices of select mobile devices
~ High price
* Low price
| - | iPhone 13 128 GB | Galaxy Z Fold3 256 GB | Galaxy A32 64 GB | Galaxy A12 32 GB | Moto G Power 64 GB |
|---|---|---|---|---|---|
| Bell | $1,135 High price~ | $2,800 | $440 High price~ | $246 High price~ | $293 Low price* |
| Rogers | $1,135 High price~ | $2,803 High price~ | $435 | $245 | $325 High price~ |
| TELUS | $1,135 High price~ | $2,695 | $415 | NA | $315 |
| Virgin | $1,135 High price~ | NA | $440 High price~ | $246 High price~ | $293 Low price* |
| FIDO | $1,135 High price~ | $2,803 High price~ | $435 | $245 | $325 High price~ |
| Koodo | $1,135 High price~ | NA | $415 | $235 | $315 |
| Lucky | - | - | - | $246 High price~ | - |
| Chatr | - | - | - | - | - |
| Pub Mobile | - | - | - | - | - |
| SaskTel | $1,130 | $2,270 | $370 | $220 | - |
| Eastlink | $1,047 Low price* | $2,256 Low price* | $360 Low price* | $216 | - |
| Freedom | $1,128 | $2,688 | $408 | $240 | $300 |
| Videotron | $1,098 | $2,268 | $372 | $210 Low price* | $300 |
| Xplore | $1,100 | NA | $360 Low price* | $240 | - |
| Fizz | $1,099 | $2,268 | $370 | $210 Low price* | $300 |
| Highest | $1,135 High price~ | $2,803 High price~ | $440 High price~ | $246 High price~ | $325 High price~ |
| Lowest | $1,047 Low price* | $2,256 Low price* | $360 Low price* | $210 Low price* | $293 Low price* |
| Difference | $88 (7.8%) | $544 (19.4%) | $80 (18.1%) | $36 (14.6%) | $32 (9.8%) |
Wall Communications Inc. 2021
| - | Moto E (32GB) | Alcatel 1B (16GB) | Alcatel Flip 3 (2GB) | ZTE Blade A3 L (8GB) |
|---|---|---|---|---|
| Koodo | - | - | $90 | - |
| Public Mobile | $99* (Pre-owned) | - | - | - |
| Lucky | $170 | $110 | - | $79 |
| Chatr | $150 | $90 | $70 | - |
| Freedom | $150 | $99 | - | $79 |
Wall Communications Inc. 2021
4.0 Fixed broadband internet service
4.1 Broadband internet service baskets
For the 2021 Study, we retain the seven broadband Internet service baskets, which are primarily defined on the basis of download speed:
- Level 1: speeds of 3-9 Mbps;
- Level 2: speeds of 10 to 15 Mbps;
- Level 3: speeds of 16 to 40 Mbps;
- Level 4: speeds of 41 to 100 Mbps;
- Level 5: speeds of 101 to 250 Mbps;
- Level 6: speeds of 251 to 500 Mbps; and
- Level 7: speeds greater than 500 Mbps.Footnote 19
-
Level 1:
-
Speed: Internet service with advertisedFootnote 20 download speed of up to 3 to 9 Mbps.
-
Data usage per month: 10 GB.
-
-
Level 2:
-
Speed: Internet service with advertised download speed of 10 to 15 Mbps.
-
Data usage per month: 50 GB.
-
-
Level 3:
-
Speed: Internet service with advertised download speed of 16 to 40 Mbps.
-
Data usage per month: 100 GB.
-
-
Level 4:
-
Speed: Internet service with advertised download speed of 41 to 100 Mbps.
-
Data usage per month: 150 GB.
-
-
Level 5:
-
Speed: Internet service with advertised download speed of 101 to 250 Mbps.
-
Data usage per month: 500 GB
-
-
Level 6:
-
Speed: Internet service with advertised download speed of 251 to 500 Mbps.
-
Data usage per month: 500 GB or higher (including Unlimited)
-
-
Level 7:
-
Speed: Internet service with advertised download speed of greater than 500 Mbps.
-
Data usage per month: 500 GB or higher (including Unlimited)
-
It should be noted that broadband speeds have increased dramatically over the past decade and the baskets used in the Telecom Pricing Reports have accordingly been adjusted.
| Basket | 2010 | 2011 | 2012 - 2015 | 2016-2017 | 2018-2019 | 2020-2021 |
|---|---|---|---|---|---|---|
| Level 1 | < 1.5 Mbps | < 1.5 Mbps | < 3 Mbps | 3 - 9 Mbps | 3 - 9 Mbps | 3 - 9 Mbps |
| Level 2 | 2 – 9 Mbps | 2 – 9 Mbps | 4 – 15 Mbps | 10 – 15 Mbps | 10 – 15 Mbps | 10 – 15 Mbps |
| Level 3 | 10 – 19 Mbps | 10 – 19 Mbps | 16 – 40 Mbps | 16 – 40 Mbps | 16 – 40 Mbps | 16 – 40 Mbps |
| Level 4 | - | > 20 Mbps | > 40 Mbps | 41– 100 Mbps | 41- 100 Mbps | 41- 100 Mbps |
| Level 5 | - | - | - | > 100 Mbps | 101-250 Mbps | 101-250 Mbps |
| Level 6 | - | - | - | - | 251-500 Mbps | 251-500 Mbps |
| Level 7 | - | - | - | - | - | 500 Mbps> |
Wall Communications Inc. 2021
Modem rental fees are taken into account since they are mandatory in some instances. In other cases, where the modem is not included but must be purchased by the customer, the cost of the required equipment is amortized over 24 months. One-time installation or activation fees are generally not included.
Some Internet service providers (ISPs) apply monthly data usage caps to their broadband service plans. Where they are applied, they are typically set on the basis of a monthly data allowance (GB/month), with overage fees sometimes applied when the data allowance is exceeded. More recently, providers tend to reduce transmission speed once a data threshold has been reached. In virtually all cases, the applicable data caps were high enough that no overage fees are incurred given the data usage assumptions adopted for the defined broadband service baskets.
| - | L1 | L2 | L3 | L4 | L5 | L6 | L7 |
|---|---|---|---|---|---|---|---|
| Halifax | |||||||
| Bell | - | - | - | 100/100 | - | - | 1 G/940 |
| Eastlink | - | - | - | - | - | 350/10 | 1G/940 |
| TekSavvy | 7/.6 | - | - | 100/10 | - | - | - |
| Montreal | |||||||
| Bell | - | 15/10 (100) | - | 50/7 | 150/150 | 500/500 | 1G/750 |
| Videotron | - | - | 30/10 | 60/30 | - | 400/50 | - |
| Distributel | 6/1 | - | - | 60/10 | - | 400/50 | - |
| TekSavvy | 5/1 (200) | 10/10 | 25/10 | 60/30 | - | - | - |
| Fizz | - | 10/1.5 | 30/10 | 60/10 | 120/20 | - | - |
| Virgin | - | 15/10 (200) | 25/10 | 50/10 | - | - | - |
| Toronto | |||||||
| Bell | - | 10/1 (100) | - | 50/10 | 150/150 | 500/500 | 1G/750 |
| Rogers | - | 10/1 (100) | - | 50/10 | 150/15 | 500/20 | 1G/30 |
| Distributel | 6/1 | - | - | 75/10 | - | 500/20 | 1G/30 |
| TekSavvy | 6/1 (200) | - | 30/5 | 75/10 | - | 300/20 | 1G/30 |
| Virgin | 5/1 | 15/10 | 25/10 | 100/10 | - | - | - |
| Fido | - | - | 30/5 | 75/15 | 150/15 | - | - |
| Winnipeg | |||||||
| Bell | - | 10/3 | - | 50/5 | - | 500/500 | 940/940 |
| Shaw | - | 10/? (150) | 25/? (250) | 75/ (500) | 150/ | 300/100 | 1G/100 |
| TekSavvy | 5/.5 (400) | 10/1 | 30/5 | 60/6 | - | 500/100 | 1G/100 |
| VMedia | - | - | 25/2.5 | 75/7.5 | 150/15 | 300/15 | 1G/25 |
| Regina | |||||||
| SaskTel | - | - | - | - | 150/75 | 300/80 | 1G/500 |
| Access | - | 10/2 | 25/3 | 100/7 | 200/ | 300/20 | - |
| TekSavvy | 5/.5 (400) | 10/1 | 30/5 | - | - | 500/100 | 1G/25 |
| VMedia | - | - | 25/2.5 | 75/7.5 | 150/15 | 300/100 | 1G/100 |
| Vancouver | |||||||
| TELUS | - | - | - | 75/75 | - | - | 940/940 |
| Shaw | - | 10 | 25/? (250) | 75/ (500) | 150/ | 300/100 | 1G/100 |
| Distributel | 5/.5 | 15/.5 | 25/2.5 | 75/7.5 | 150/15 | 300/20 | - |
| TekSavvy | 5/.5 (400) | 15/1 | 30/5 | 60/6 | - | 500/100 | 1G/25 |
| Can. Mode | 5/1 | 10/1 | 25/5 | 75/10 | 150/15 | 500/100 | 1G/940 |
| Can. Ave. | 5.5/0.8 | 11.7/4 | 27.2/6.1 | 70.1/17.9 | 151.6/52.2 | 397.4/126.6 | 988.2/372.1 |
Wall Communications Inc. 2021
4.2 Canadian broadband service prices
Figure 2 below provides a summary of Canadian weighted average broadband Internet access service prices for the Levels 1 to 7 service baskets for the period 2019 to 2021. More detailed historical broadband price information by city is provided in Table A2.2 in Attachment 2. Table 19 displays average regional broadband prices.
Figure 2
Average Canadian Broadband Internet Prices by Service Basket (2018-2021)

Wall Communications Inc. 2021
We note that fixed broadband prices have increased in Canada in every basket in every year between 2019 and 2021 (excluding L2 where the average price went down between 2021 and 2020.). The highest increase of 13.4% occurred in L5 (101–250 Mbps) while L2 (10–15 Mbps) had a decrease of 5.6%.
- The Level 1 national average broadband price increased from $44.37 in 2020 to $47.60 in 2021, an increase of 7.3%. Average 2021 Level 1 prices varied from roughly $41 in Winnipeg and Regina to just less than $57 in Halifax. We note that this pattern (Winnipeg lowest price and Halifax highest price) has prevailed over the last three years. Level 1 prices generally increased from 2008 to 2014 but had been falling gradually until 2020. In the two years since 2019 prices have increased by roughly 33% in total. As noted, our criterion for Level 1 has evolved over time such that the "quality" of the basket has also been improving as speeds have been increased.
Canadian Broadband Level 1 (3-9 Mbps)

Wall Communications Inc. 2021
- The 2020 Level 2 basket price decreased from $54.61 to $51.54 in 2021. Average 2021 Level 2 prices varied from a low of slightly more than $50 in Regina, Toronto and Vancouver to $60 in Winnipeg.
Canadian Broadband Level 2 (10-15 Mbps)

Wall Communications Inc. 2021
- The 2020 Level 3 national average price increased from $61.62 to $66.31 in 2021 – a rise of 7.6%. Vancouver had the highest price at $78.68 while the lowest price was found in Montreal at $58.18.
Canadian Broadband Level 3 (16-40 Mbps)

Wall Communications Inc. 2021
- The Level 4 national price rose marginally in 2021 to $77.98 from $77.18 in 2020. Average 2021 Level 4 prices varied from $60.87 in Montreal to $93.99 in Halifax.
Canadian Broadband Level 4 (41-100 Mbps)

Wall Communications Inc. 2021
- The Level 5 national average price increased substantially in 2021, from $83.95 in 2020 to $95.00 this year. Toronto had the highest price ($104.52) while the lowest price was found in Regina ($71.55).
Canadian Broadband Level 5 (101-250 Mbps)

Wall Communications Inc. 2021
- Level 6 prices increased marginally from $97.16 in 2020 to $98.08 in 2021. Prices varied from $71.62 (Montreal) to $112.88 (Toronto).
Canadian Broadband Level 6 (251-500 Mbps)

Wall Communications Inc. 2021
- Level 7 – introduced in 2020 at 500 Mbps or greater – posted an average national price of $108.71, up just slightly from the $107.55 in 2020.
Canadian Broadband Level 7 (500 Mbps+)

Wall Communications Inc. 2021
Montreal had the lowest average prices in 4 of the 7 baskets while Toronto and Halifax each had the highest prices in three and two baskets respectively.
| - | NS | QC | ON | MB | SK | BC | Canada |
|---|---|---|---|---|---|---|---|
| Level 1 | $56.85 | $45.78 | $50.36 | $41.03 | $41.03 | $44.24 | $47.60 |
| Level 2 | n/a | $53.43 | $50.21 | $60.00 | $50.44 | $50.16 | $51.54 |
| Level 3 | n/a | $58.18 | $66.38 | $77.62 | $57.38 | $78.68 | $66.31 |
| Level 4 | $93.99 | $60.87 | $84.69 | $81.88 | $73.11 | $84.31 | $77.98 |
| Level 5 | n/a | $82.46 | $104.50 | $93.97 | $71.55 | $94.38 | $95.00 |
| Level 6 | $92.95 | $71.62 | $112.88 | $100.24 | $94.52 | $101.09 | $98.08 |
| Level 7 | $115.23 | $79.95 | $123.51 | $113.62 | $123.42 | $108.33 | $108.71 |
Wall Communications Inc. 2021
Price variations in the case of broadband services can be affected by differences in service speeds offered by ISPs. For the most part, the plans that are sampled have the same or very similar speeds associated with a given basket level.
Canadian broadband service plans also span a range of data caps. For Level 1, the lowest posted data cap was 200 GB (with a high of unlimited data). For Level 2, data caps ranged from 100 GB to unlimited GB. For Level 3 caps varied from 250 GB to unlimited. For Level 4, the lowest data cap was 500 GB but higher caps and unlimited are prevalent. Levels 5, 6 and 7 data caps are unlimited. Over time, data cap upper limits have been increasing steadily.
We would note that speeds of 100 Mbps or higher are common across the country – in contrast to even three years ago. We would also note that 1 Gbps service is now offered in several regions.
4.3 Fixed broadband - incumbents, WBCs and flankers
While flanker brands have been a fixture in the mobile wireless market for more than a decade, they are relatively new to the fixed broadband market. Currently flankers operate in two provinces, Quebec and Ontario. Wholesale based competitors (WBCs) have been in operation for several years and operate in all regions of the country. One or the other – or both - Distributel and TekSavvy offer services across the country. As Distributel does not offer service (widely or otherwise) in Manitoba and Saskatchewan, we have surveyed the prices of VMedia (which operates in those regions).
| - | NS | QC | ON | MB | SK | BC | Canada |
|---|---|---|---|---|---|---|---|
| Level 1 | |||||||
| Incumbent | n/a | n/a | n/a | n/a | n/a | n/a | n/a |
| WBC | $56.85 | $45.78 | $48.99 | $41.03 | $41.03 | $44.24 | $46.32 |
| Dif WBC/In | n/a | n/a | n/a | n/a | n/a | n/a | n/a |
| Level 2 | |||||||
| Incumbent | n/a | $54.95 | $49.97 | $61.48 | $50.37 | $50.00 | $53.35 |
| WBC | n/a | $39.00 | n/a | $52.03 | $52.02 | $52.23 | $48.82 |
| Dif WBC/In | n/a | -29.03% | n/a | -15.36% | 3.28% | 4.46% | -8.50% |
| Level 3 | |||||||
| Incumbent | N/A | $58.00 | N/A | $80.00 | $59.54 | $80.00 | $69.39 |
| WBC | n/a | $70.45 | $70.03 | $57.03 | $57.03 | $61.24 | $63.81 |
| Dif WBC/In | n/a | -0.47% | n/a | -18.71% | 9.22% | -23.46% | -8.03% |
| Level 4 | |||||||
| Incumbent | $94.95 | $59.98 | $87.47 | $82.50 | $76.20 | $85.00 | $81.02 |
| WBC | $85.86 | $72.93 | $70.09 | $68.03 | $68.03 | $67.70 | $73.16 |
| Dif WBC/In | -9.57% | 8.85% | -19.87% | -9.05% | -1.54% | -20.36% | -9.69% |
| Level 5 | |||||||
| Incumbent | N/A | $64.95 | $104.97 | $95.00 | $80.58 | $95.00 | $93.89 |
| WBC | n/a | $91.45 | N/A | $76.03 | $76.03 | $77.86 | $76.79 |
| Dif WBC/In | n/a | n/a | n/a | n/a | n/a | -18.04% | -18.21% |
| Level 6 | |||||||
| Incumbent | $92.95 | $69.98 | $114.97 | $100.00 | $106.79 | $100.00 | $97.45 |
| WBC | n/a | $99.90 | $100.59 | $104.03 | $104.03 | $115.57 | $112.02 |
| Dif WBC/In | n/a | 42.77% | -12.51% | 22.03% | 14.28% | 15.57% | 14.96% |
| Level 7 | |||||||
| Incumbent | $115.20 | $79.95 | $124.97 | $112.50 | $124.95 | $107.00 | $110.76 |
| WBC | n/a | n/a | $114.97 | $123.49 | $123.49 | $132.03 | $127.76 |
| Dif WBC/In | n/a | n/a | -8.01% | 17.36% | 5.67% | 23.39% | 15.35% |
Wall Communications Inc. 2021
As was the case in past years, WBC prices tend to be lower than incumbent prices – although we note there are several instances where that is not the case this year. In L6 and L7, incumbent average prices are lower than WBC average prices.
| - | QC | ON |
|---|---|---|
| Level 1 | ||
| Incumbent | n/a | n/a |
| Flankers | n/a | n/a |
| Dif FL/In | n/a | n/a |
| Level 2 | ||
| Incumbent | $54.95 | $49.97 |
| Flankers | $39.00 | n/a |
| Dif FL/In | -29.0% | n/a |
| Level 3 | ||
| Incumbent | $58.00 | n/a |
| Flankers | $45.00 | $60.00 |
| Dif FL/In | -24.1% | n/a |
| Level 4 | ||
| Incumbent | $59.98 | $87.47 |
| Flankers | $50.00 | $72.50 |
| Dif FL/In | -16.6% | -17.1% |
| Level 5 | ||
| Incumbent | $64.95 | $104.97 |
| Flankers | n/a | $85.00 |
| Dif FL/In | n/a | -19.2% |
| Level 6 | ||
| Incumbent | $69.98 | $114.97 |
| Flankers | n/a | n/a |
| Dif FL/In | n/a | n/a |
| Level 7 | ||
| Incumbent | $79.95 | $124.97 |
| Flankers | n/a | n/a |
| Dif FL/In | n/a | n/a |
Wall Communications Inc. 2021
As noted, flanker brand broadband service is only offered in Ontario and Quebec. In all cases where both the incumbent primary and secondary brands offer a service, the Flanker price is lower than the incumbent price with discounts ranging from 16% to 29%. Flanker prices also tend to be lower than the WBC prices.
We note that there is one regional provider that also uses a flanker brand: Fizz is the secondary brand of Videotron in Quebec. In every case where Virgin (the Bell flanker) offers a plan (L2 – L4), Fizz offers a similar plan at exactly the same price. In one instance, Fizz offers a plan (L5) where Virgin does not offer a plan.
4.4 Spotlight: Fixed broadband – other providers
The Telecom Pricing Study collects data from domestic providers that have wide-spread availability throughout a given region (generally province-wide or larger). Large facilities-based carriers include the regional cable and telecom companies (Bell, Rogers, Shaw, TELUS, Videotron, Eastlink, SaskTel) as well as national or regional wholesale-based competitors like TekSavvy, Distributel and VMedia. We note, however, that several smaller niche ISPs operate throughout the country, often offering service in limited geographic areas. These "other" providers operate with their own facilities, use the facilities of a facilities-based ISP or a combination of the two. Most often, these providers are wholesale-based competitors (WBCs). The "other" ISPs may offer prices equal to or lower than the larger providers. This Spotlight provides further detail on these ISPs and their pricing.
Providers may be quite small and geographically limited (e.g. condo or other housing developments operating an Internet service to their residents) or more broadly available (e.g. WBCs are typically able to serve the entire wireline territory of the provider whose facilities they use in a given region). In general, other ISPs tend to operate in more densely populated urban areas although smaller providers can and do sometimes offer service in rural and remote areas. For this Spotlight, we will focus attention on four urban cities across Canada: Montreal, Toronto, Vancouver and Winnipeg.
Data for this Spotlight is primarily sourced from Planhub.ca – a website that gathers information on mobile and internet plans across the country. We note that there are limited instances where the site reports differing prices from the same vendor for the same plan. There are many possible explanations for this. For example, an ISP may offer the same speed plan (at different prices), depending on whether cable or DSL/fibre is used for transmission and/or for different geographic areas. Or the vendor may offer different contract term lengths or various upfront charge versus monthly payment plans.
We have used four levels of Internet plans (low, medium, high and very high speed). These categories vary somewhat from city to city, depending on the plan speeds offered by the local vendors. In general, cities in central Canada have the greatest number of "other" providers. High speed plans from other ISPs are prevalent in Toronto and Vancouver, but limited in Montreal and Winnipeg (note: there is only one "other" ISP in Winnipeg).
For comparative purposes, we have included prices from the local cable, telecom, flanker and larger WBC offerings. In general, an "other" ISP will have the lowest (or equal to the lowest) price in any category. It should be noted, however, that availability may be very limited by the coverage area of the ISP (whereas the cable, telecom, flanker and often the larger WBCs have regional wide coverage).
We also note that absolute price is not the only parameter upon which consumer decisions are made: customer service perception may be a key consideration in choosing a niche provider or it may be that the niche provider offers a choice of plans better suited to some consumers. The incumbent cable or telecom companies rarely offer a low level (i.e. around 5 Mbps) plan but in most cases offer the highest speed plan (i.e. 1 Gbps).
In the Tables below, the price corresponds to the category plan speed listed, unless otherwise noted. The upfront charge is noted in brackets.
Montreal
There are about 50 "other" ISPs operating in Montreal. Plans vary from 5 Mbps to 1 Gbps. The lowest priced plan is $23.99 from EGC Telecom (5 Mbps).
| - | 5-6 Mbps | 50 Mbps | 400 Mbps | 1 Gbps |
|---|---|---|---|---|
| CIK | - | $39.99 ($79.90) | $84.99 ($79.90) | - |
| GEMS | $29.99 ($15) | $47.99 ($15) | $94.99 ($134.95) | - |
| Transat | - | $43.95 ($149.90) | $84.99 ($119.90) | - |
| Carry | - | $49.99 ($89) | $89.99 ($109) | - |
| IVC | - | $39.95 ($59.95) | $74.95 ($45) | - |
| EBOX | $46.90 ($15) | $40.95 ($15) | $89 ($134.95) | - |
| Altima | - | $60 ($10) | $125 ($10) | - |
| EGC | $23.99 ($55) | - | $84.99 ($54.99) | - |
| Acanac | - | $58 | $98 | $102.95 |
| Henri | - | $74.95 ($65) – 60 Mbps | $100.95 ($65) | $109.95 ($65) |
| Virgin Plus | $39 – 10 Mbps | $50 | - | - |
| Bell | - | $59.95 | $69.95 – 500 Mbps | $79.95 |
| Videotron | - | $60 – 60 Mbps | $70 | - |
| Fizz | $39 – 10 Mbps | $45 – 30 Mbps $50 – 60 Mbps | $75 – 200 Mbps | - |
| Distributel | - | $49.95 ($109.95) | - | $94.99 ($109.95) |
| VMedia | $34.95 ($14.95) | $54.95 ($14.95) | $84.95 ($139.85) | - |
| TekSavvy | - | $74.61 ($10) | - | - |
Source: PlanHub.ca (data) and Wall Communications Inc. (compilation) 2021
Toronto
There are about 40 "other" ISPs estimated to be operating in Toronto.Footnote 21 The number of plans offered number in the hundreds, varying from 30 Mbps to 1 Gbps download speeds. The lowest priced plan is from Odynet for 6 Mbps at $29.95 per month (with a $35 upfront charge).
| - | 6 Mbps | 50 Mbps | 300 Mbps | 1 Gbps |
|---|---|---|---|---|
| Auracom | $34.95 ($60) | $54.95 ($110) | $93.95 ($50) | $99.95 ($190) – 1G |
| Transat | - | $43.95 ($149.90) | $95 ($80) | - |
| Carry | - | $59.99 ($89) | $89.99 ($69) | $99.99 ($10) – 1G |
| CIK | - | $39.99 ($79.90) | $74.99 ($79.90) | $84.99 ($79.90) – 1G |
| GEMS | $33.99 ($15) | $47.99 ($15) | $79.99 ($15) | $99.99 ($15) – 1G |
| EBOX | $47.95 ($134.95) | $40.95 ($15) | - | $106.95 ($134.95) 1G |
| FibreStream | - | $40 ($10) – 100 Mbps | $50 ($10) – 750 Mbps | $100 ($10) – 5G |
| Altima | - | $60 ($10) | $85 ($10) | - |
| Virgin Plus | - | $70 | $79 | - |
| Bell | $49.95 – 10 Mbps | - | $84.95 | $124.95 – 1G |
| Rogers | - | - | - | $129.99 ($29) – 1G |
| FIDO | - | $60 ($49.99) – 30 Mbps | - | - |
| Distributel | $48.90 ($10) – 15 Mbps | $49.95 ($109.95) | $95.90 ($10) | $108.90 ($10) – 1G |
| VMedia | $34.95 ($14.95) | - | $89.95 ($114.90) | $104.95 ($114.90) – 1G |
| TekSavvy | $46.95 ($149.95) – 10 Mbps | $74.61 ($10) | $97.99 ($149.95) | $117.95 ($149.95) – 1G |
Source: PlanHub.ca (data) and Wall Communications Inc. (compilation) 2021
Vancouver
There are very few "other" ISPs in Vancouver – likely 5 or less. They include GEMS, Focus, FibreStream and Altima. One of the lowest priced plans is available from FibreStream (at $40 for 100 Mbps) putting it in the price range of plans that only provide download speeds of 5 to 25 Mbps.
| - | 5-6 Mbps | 75 Mbps | 300 Mbps | 1 Gbps |
|---|---|---|---|---|
| Altima | - | $65 ($10) | $95 ($10) | $110 ($10) – 750 M |
| GEMS | $49.99 ($64.99) – 15 Mbps | $79.99 ($15) | $99 ($15) | $144.99 ($15) |
| FibreStream | - | $40 ($10) – 100 Mbps | $50 ($10) – 750 Mbps | $100 ($10) – 5 Gbps |
| Focus | $33.95 ($159.90) | $72.95 ($159.90) | - | $122.95 ($159.90) |
| Shaw | - | $85 ($50) | $100 ($50) | $125 ($50) |
| TELUS | - | $85 | $95 | $99 |
| Distributel | $39.95 ($109.95) | $68.90 ($10) | $113.90 ($10) | - |
| VMedia | $38.95 ($164.85) – 15 Mbps | $64.90 ($64.90) | $89.90 ($64.90) | $120.90 ($64.90) |
Source: PlanHub.ca (data) and Wall Communications Inc. (compilation) 2021
Winnipeg
Winnipeg only has one "other" provider, Focus. They offer the lowest priced plan in the city at $33.95 (with a $159.90 upfront charge) at 5 Mbps.
| - | 10 Mbps | 75 Mbps | 300 Mbps | 1 Gbps |
|---|---|---|---|---|
| Focus | $44.95 ($159.90) - 5M | $67.95 ($159.90) – 60 Mbps | $114.95 ($159.90) – 500 Mbps | $122.95 ($159.90) |
| Shaw | $50 ($50) | $85 ($50) | $100 ($50) | $115 ($50) |
| Bell MTS | $72.95 | $90 – 100 Mbps | $100 – 500 Mbps | $110 |
| VMedia | $46.95 ($164.85) – 25 Mbps | $64.90 ($64.90) | $89.90 ($64.90) | $120.90 ($64.90) |
Source: PlanHub.ca (data) and Wall Communications Inc. (compilation) 2021
4.5 International fixed broadband service prices
As with the other service categories, there are a number of notable differences in the way in which broadband services are provisioned in some of the surveyed countries compared to Canada:
- In some of the surveyed European countries, to obtain a DSL broadband Internet service on a stand-alone basis, the customer must in some cases also lease a landline connection (which adds an additional access line charge).
- Fibre and/or DSL-based broadband services offered in the U.K., France, Germany and Italy generally include VoIP and/or IPTV services for a single bundled price. The option of a pure stand-alone broadband Internet service is not available in some cases.
- In Japan, broadband Internet service typically consists of two separate service elements: (i) a network access facility (fibre or ADSL), often obtained from NTT and (ii) an Internet access service provided by a third-party ISP. Therefore, there are two fees involved: the broadband access fee and ISP fee.
- In the US, UK, Australia, France, Italy and Germany lower-level plans (L1, L2) are no longer offered – only Canada and Japan offer these plans.
Table 11 below provides a summary of the unweighted average "advertised" download and upload service speeds of the surveyed broadband services included in each of the seven specified broadband service baskets for Canada and the surveyed foreign jurisdictions.Footnote 22 Data caps are typically no longer listed in most countries (with the exception of Canada and Australia) – either because the vendor has chosen not to state the cap or (more likely) because the plans do not have data caps.
| - | L1 | L2 | L3 | L4 | L5 | L6 | L7 |
|---|---|---|---|---|---|---|---|
| Can. | 5 | 10 | 25 | 75 | 150 | 500 | 1 Gbps |
| US | NA | NA | NA | 100 | 200 | 400 | 1 Gbps |
| UK | NA | NA | 36 | 54 | 213 | 362 | 516 |
| AU | NA | NA | 25 | 100 | NA | NA | NA |
| FR | NA | NA | 25 | NA | NA | 300, 400, 500 | 1 Gbps |
| JA | 8 | 12 | 40 | 100 | 200 | 350 | 1 Gbps |
| IT | NA | NA | 40 | NA | NA | NA | 1 Gbps |
| GM | NA | NA | 16 | 100 | 250 | NA | 1 Gbps |
| Int. Mode | NA | NA | 25 | 100 | 200 | 400/500 | 1 Gbps |
Wall Communications Inc. 2021
| - | L1 | L2 | L3 | L4 | L5 | L6 | L7 |
|---|---|---|---|---|---|---|---|
| Can. | 5.5 | 11.7 | 27.2 | 70.1 | 151.6 | 397.4 | 988.2 |
| US | NA | NA | NA | 93.8 | 210 | 360 | 926.7 |
| UK | NA | NA | 36.7 | 61 | 213 | 362 | 516 |
| AU | NA | NA | 25 | 100 | NA | NA | NA |
| FR | NA | NA | 25 | NA | NA | 400 | 2.3 Gbps |
| JA | 8 | 12 | 40 | 100 | 200 | 350 | 1 Gbps |
| IT | NA | NA | 40 | NA | NA | NA | 1.8 Gbps |
| GM | NA | NA | 16 | 100 | 250 | NA | 1 Gbps |
| Int. Av. (exc. Canada) | 8 | 12 | 30.5 | 91 | 218.3 | 368 | 1,257.2 |
Wall Communications Inc. 2021
While past Studies have identified trends or relatively clear-cut international comparative conclusions, this year is more ambiguous. The offering of lower-level plans (i.e. L1 and L2) appears to be fairly limited. At the higher end, almost every country now offers a 1 Gbps plan. We note that low-level service plans have limited availability in Japan and average prices tend to be higher than their higher-level plans.
Findings for each of the seven broadband service baskets are described below.
- Level 1 broadband services were only available from surveyed ISPs in two of the eight countries included in the study – Canada and Japan. Canada's average monthly price of $47.60 is lower than the measured average prices for Japan ($73.10).
International Broadband Level 1 (3-9 Mbps)
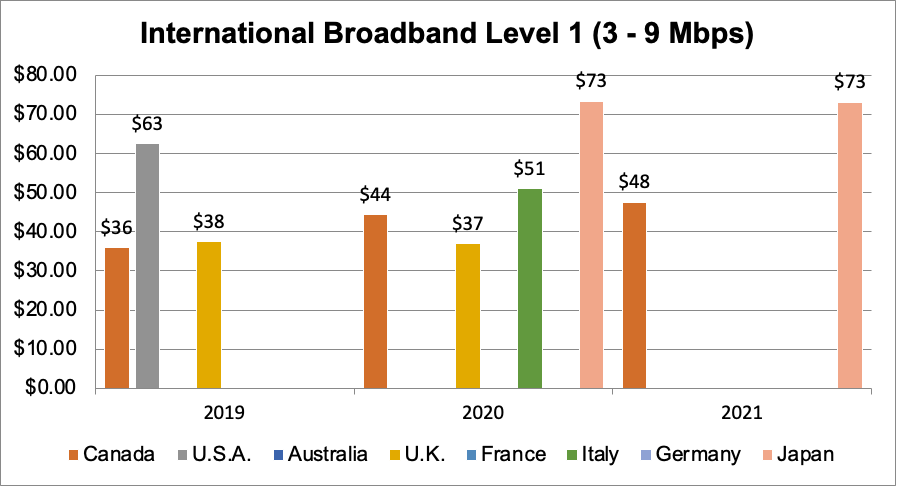
Wall Communications Inc. 2021
- In the case of the Level 2 basket, again only two countries provide this level of service (Canada and Japan). Canada's average monthly price of $51.54 is lower than Japan ($74.28).
International Broadband Level 2 (10-15 Mbps)

Wall Communications Inc. 2021
- For the Level 3 basket, Canada's average monthly price of $66.31 is higher than all other countries except for Japan ($76.04).
International Broadband Level 3 (16-40 Mbps)

Wall Communications Inc. 2021
- For the Level 4 basket, Canada's average monthly price of $77.98 is slightly lower than the US price ($78.87) and Australia ($81.97) but higher than other countries. Prices in the UK and Germany fall near the $50 mark.
International Broadband Level 4 (41-100 Mbps)

Wall Communications Inc. 2021
- The average Canadian price for Level 5 broadband is $95.00, higher than all other countries.
International Broadband Level 5 (101-250 Mbps)

Wall Communications Inc. 2021
- The Canadian Level 6 broadband price of $98.08 is highest among the surveyed countries. The lowest price of $36.47 is found in France.
International Broadband Level 6 (251-500 Mbps)

Wall Communications Inc. 2021
- The average price for Level 7 in Canada is $108.71, higher than all other countries (but essentially equal to the US price of $108.40). Both France and Italy have prices less than $45.
International Broadband Level 7 (500 Mbps+)

Wall Communications Inc. 2021
Canada's broadband service price ranking has remained relatively consistent since the study was first conducted in 2008. The measured prices for the European countries included in the study (U.K., France, Italy and Germany) have consistently been lower than those in Canada – in some cases, by a wide margin.
Relative to last year, all countries (except for Canada and Japan) have lower prices in a majority of baskets. And relative to last year, Canadian prices were higher in every basket with the exception of L2.
In sum, Canadian broadband Internet service prices compare reasonably well with Japan - the only other country to offer L1 and L2 plans. As noted, most countries no longer provide these lower-level service baskets. However, Canadian Level 3 to Level 7 basket prices are generally higher than the prices measured in other surveyed countries, with a few exceptions.
5.0 Mobile internet service
5.1 Mobile internet service baskets
There are four mobile Internet service levels included in the study, categorized by the data allowance of the service. They consist of the following usage-based service elements and characteristics:
- Technology 3rd, 4th generation or more (e.g., 3G, 3G+, 4G, 4G LTE or 5G)
- Service speed: Advertised download speedFootnote 23
- Equipment: USB modem key (included with service on a no-charge, rental or purchase basis)
- Data usage:
- Level 1: 2 to 4 GB per month
- Level 2: 5 to 9 GB per month
- Level 3: 10 to 49 GB per month (modified from previous years); and
- Level 4: 50 to 99 GB per month (new this year).
One-time charges (such as activation fees) are generally excluded.
5.2 Canadian mobile internet service prices
Figure 8 below provides a summary of Canadian Level 1 through 4 mobile Internet service basket prices for the periods 2017 to 2021. More detailed price information by city is provided in Table A2.5 of Attachment 2. As can be seen prices in L1 fell in 2021 after three years of increases. The same pattern is true of L2, where the average price fell after four years of increases. Prices in L3 continued to increase as they generally have since 2017. Average annual Canadian prices for L4 (introduced this year) were $132.
Figure 3
Average Canadian Mobile Internet Prices by Service Basket (2017-2021)
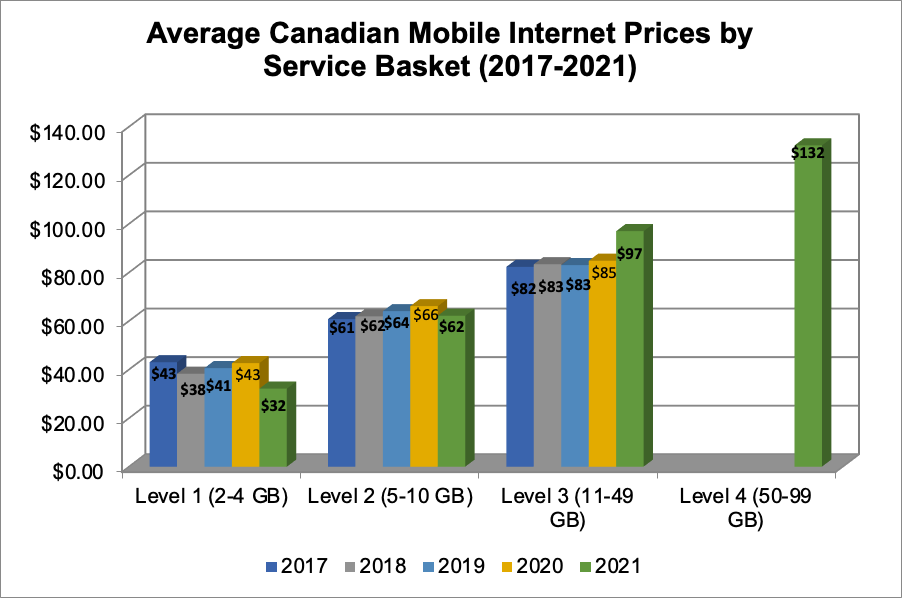
Wall Communications Inc. 2021
In addition to the national Canadian prices featured in Figure 3, prices from various regions for each basket are also provided below.
- Level 1 mobile Internet service price decreased from $42.63 to $32.13 in 2021. Level 1 prices remained fairly uniform across the country, ranging from a low of $29.15 in Ontario to $37.43 in Quebec. Level 1 service plans included 2 to 4 GB of data allowance per month, with Freedom and Primus offering 4 GB. Download speeds were consistent across the country from all providers at 150 Mbps. Prices in every region decreased relative to last year.
Canadian Mobile Internet Level 1 (2-4 GB)
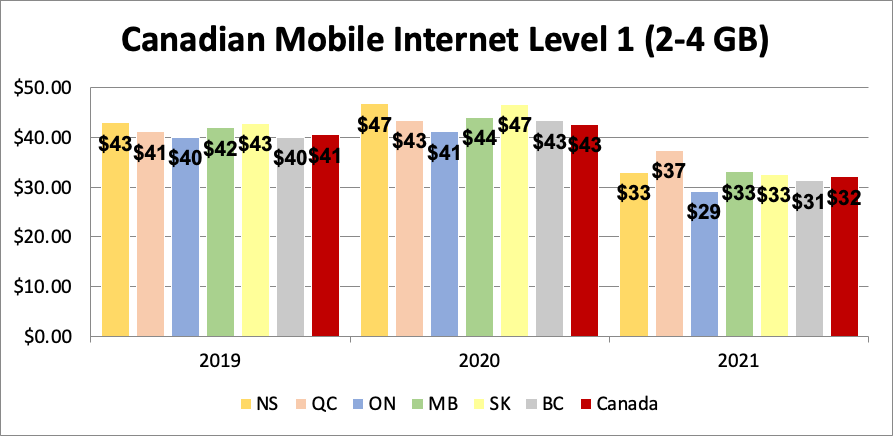
Wall Communications Inc. 2021
- The Level 2 price decreased from $66.10 to $62.18 this year. There is very little variation from province to province with the exception of Saskatchewan, with an average price of $42.72 (in contrast to all other plans offered in the $60 range). The Level 2 plans mostly included data allowances of 5 to 6 GB per month and were typically offered with a speed of 150 Mbps.
Canadian Mobile Internet Level 2 (5-10 GB)

Wall Communications Inc. 2021
- The Level 3 national price also increased from $84.79 to $96.99 in 2021. Once again, Saskatchewan was significantly lower than other provinces with a price of $60.86 (versus prices in other regions in the $95 to $100 range). Data caps ranged from 15 to 20 GB.
Canadian Mobile Internet Level 3 (11-49 GB)

Wall Communications Inc. 2021
- The newly introduce L4 basket (50 to 99 GB) came in at an average price of about $132. Prices again were highly uniform across the country, with the exception of Saskatchewan. The average price in Regina was $94.58 versus prices ranging from $132 to $138 elsewhere. Data allowances were uniformly 50 GB in all offerings.
Canadian Mobile Internet Level 4 (50-99 GB)
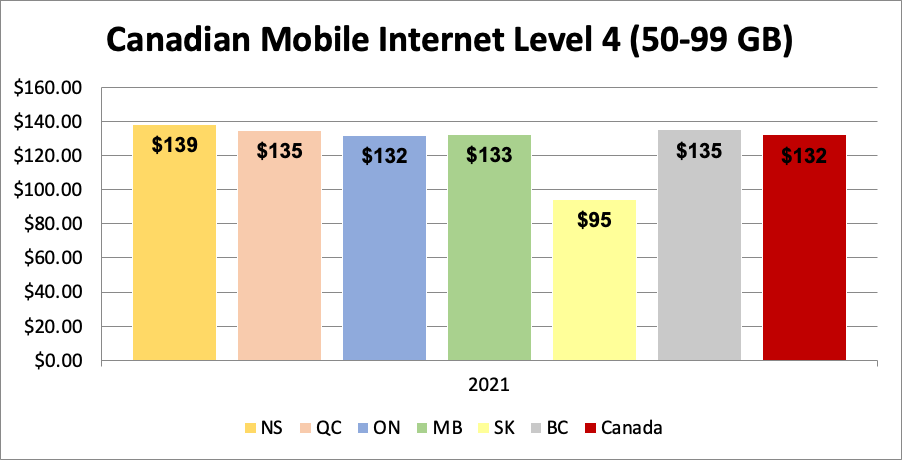
Wall Communications Inc. 2021
The advertised download speed of the mobile Internet services included in this year's study is typically 150 Mbps.
A comparison of the mobile Internet service rates offered by the incumbents (Rogers, Bell and TELUS) and Regionals (SaskTel, Xplore Mobile, Freedom, Videotron and Eastlink), as applicable, in the cities of Vancouver, Toronto, Montreal, Winnipeg, Regina and Halifax is provided in Table 12. The Incumbents offer the same price in each province/city and therefore the average price is consistent across the country.
For all Levels of mobile Internet service baskets, the regionals' average national price is significantly lower than the incumbents' average national price. For the L1 to L4, the differentials are 25%, 21%, 18% and 37% respectively. However, in Montreal the regional provider's prices are uniformly higher than the incumbent's prices.
| - | NS | QC | ON | MB | SK | BC | Canada |
|---|---|---|---|---|---|---|---|
| Level 1 | |||||||
| Incumbents | $33.39 | $33.39 | $33.39 | $33.39 | $33.39 | $33.39 | $33.39 |
| Regionals | n/a | $45.00 | $15.00 | n/a | n/a | $15.00 | $25.00 |
| Resellers | $20.00 | $20.00 | $20.00 | $20.00 | $20.00 | $20.00 | $20.00 |
| I/R Diff | n/a | 34.77% | -55.08% | n/a | n/a | -55.08% | -25.13% |
| Level 2 | |||||||
| Incumbents | $63.06 | $63.06 | $63.06 | $63.06 | $63.06 | $63.06 | $63.06 |
| Regionals | n/a | $65.00 | n/a | n/a | $35.00 | n/a | $50.00 |
| Resellers | $30.00 | $30.00 | $30.00 | $30.00 | $30.00 | $30.00 | $30.00 |
| I/R Diff | n/a | 3.07% | n/a | n/a | -44.50% | n/a | -20.71% |
| Level 3 | |||||||
| Incumbents | $97.50 | $97.50 | $97.50 | $97.50 | $97.50 | $97.50 | $97.50 |
| Regionals | n/a | $105.00 | n/a | n/a | $55.00 | n/a | $80.00 |
| Resellers | n/a | n/a | n/a | n/a | n/a | n/a | n/a |
| I/R Diff | n/a | 7.69% | n/a | n/a | -43.59% | n/a | -17.95% |
| Level 4 | |||||||
| Incumbents | $135.00 | $135.00 | $135.00 | $135.00 | $135.00 | $135.00 | $135.00 |
| Regionals | n/a | n/a | n/a | n/a | $85.00 | n/a | $85.00 |
| Resellers | n/a | n/a | n/a | n/a | n/a | n/a | n/a |
| I/R Diff | n/a | n/a | n/a | n/a | -37.04% | n/a | -37.04% |
Unweighted averages
Wall Communications Inc. 2021
Offerings by Primus (in L1 and L2) were uniformly lower than incumbent prices and generally compared favourably to regional prices (where a service was offered).
Mobile Internet (data only) prices have remained relatively steady for the last several years. Regionals continue to generally offer lower prices than the incumbents. Depending on the region the price difference between regional providers and incumbents can be significant.
5.3 International mobile internet service prices
Table 13 provides a summary of the average Level 1 to Level 3 advertised download speeds and data caps for Canada and each of the seven surveyed foreign jurisdictions. Upload speeds are often not advertised by wireless service providers and, therefore, are not included in the table.
| - | L1 | L2 | L3 | L4 |
|---|---|---|---|---|
| Canada | 150 mbps | 150 mbps | 150 mbps | 150 mbps |
| US | 150 mbps | 150 mbps | 150mbps | 150 mbps |
| UK | 30 mbps | 30 mbps | 30 mbps | 30 mbps |
| AUS | 150 mbps | 150 mbps | 150 mbps | 150mbps |
| FR | NA | 100/150 mbps | 100/150 mbps | 100/150 mbps |
| JP | 220 mbps | 220 mbps | 220 mbps | 220 mbps |
| IT | NA | 150 mbps | 150 mbps | 150 mbps |
| GR | 21.6/500 mbps | 21.6/500 mbps | 21.6/500 mbps | 21.6/500 mbps |
Wall Communications Inc. 2020
Canada is similar to the US, Australia and Italy in average download speed in each basket and offering the same speed in every basket. Canada generally compares favorably against most other countries (with the exception of Japan).
Figure 4 below provides a comparison of Level 1 to Level 4 mobile Internet service basket prices for Canada and the surveyed foreign jurisdictions. Table A3.4 in Attachment 3 provides detailed historical mobile Internet price results.
Figure 4
2021 International Mobile Internet Price Comparison (PPP-adjusted CDN$)

Wall Communications Inc. 2021
We note that L1 service baskets are not offered in the US, Australia, France or Italy. In L2, Italy does not offer any service plans. All countries offer plans in L3 and all offer plans in L4 (with the exception of Germany).
Examining each basket over the last three years, Canada has remained at the higher end of the international ranking
- In the case of the Level 1 mobile Internet service basket, the average Canadian price of $32.13 is substantially lower than the Japanese price of $59.23, but higher than the UK and Germany prices of $15.43 and $21.80 respectively. We also note that the US, Australia, France and Italy do not offer these lower data allotment mobile Internet services. The Canadian price experienced a significant decrease in 2021 relative to 2020.
International Mobile Internet Level 1 (2-4 GB)
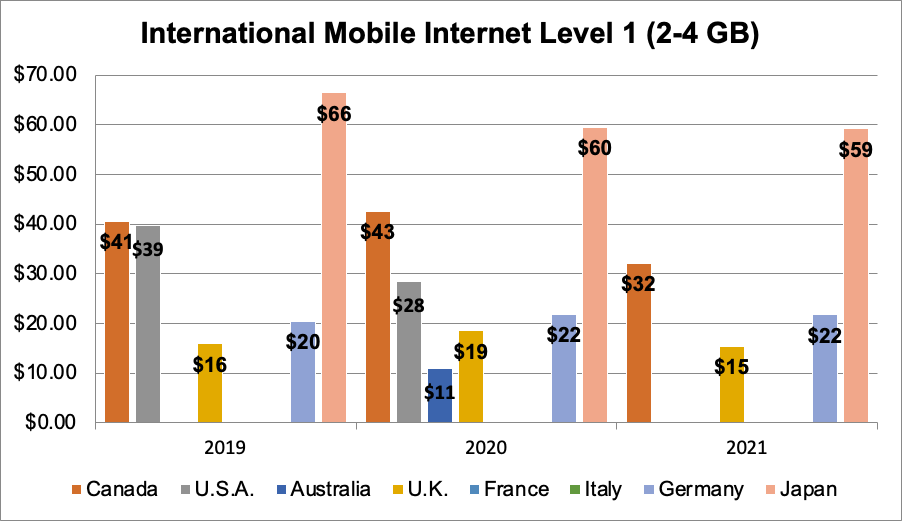
Wall Communications Inc. 2021
- For the Level 2 service basket, the average Canadian mobile Internet price of $62.18 is higher than the US price of $52.27 and lower than the Japanese price of $76.06. Prices in the European countries are generally much lower, ranging from roughly $16 to $30.
International Mobile Internet Level 2 (5-10 GB)

Wall Communications Inc. 2021
- In Level 3, the narrative is similar, with Canada being on the high price end ($96.99) – higher than all other countries. The US and Japan are about 25% lower (at $72 and $73 respectively) while the European countries and Australia are substantially lower (between 60% and 75% lower).
International Mobile Internet Level 3 (11-49 GB)

Wall Communications Inc. 2021
- For the Level 4 service basket, the average Canadian mobile Internet price of $132.30 is markedly higher than the prices in other surveyed countries. Prices in the European countries are generally much lower, ranging from roughly $21 to $66.
International Mobile Internet Level 4 (50-99 GB)

Wall Communications Inc. 2021
The average prices in Canada and Japan are generally at the high end of the price range for every basket, with Canada being the highest in L3 and L4.
As a point of interest, the major US mobile wireless providers offer widely available "hotspot" service across their wireless networks. The "hotspot" services are essentially a substitute for a mobile wireless Internet service for laptops and related devices. These added services are typically free when a customer purchases an "unlimited data" plan from the operator. Separate mobile data services in some cases may be available for lower-level plans.
| - | Canada | U.S.A. | Australia | U.K. | France | Italy | Germany | Japan |
|---|---|---|---|---|---|---|---|---|
| Level 1 (2-4 G) | $32.13 | n/a | n/a | $15.43 | n/a | n/a | $21.80 | $59.23 |
| Level 2 (5-10 G) | $62.18 | $52.27 | $15.86 | $20.59 | $25.26 | n/a | $30.04 | $76.06 |
| Level 3 (11-49G) | $96.99 | $71.67 | $23.31 | $28.45 | $34.37 | $26.76 | $38.63 | $73.41 |
| Level 4 (50-99G) | $132.30 | $96.59 | $43.05 | $43.11 | $65.97 | $21.34 | n/a | $101.24 |
Wall Communications Inc. 2021
In sum, Canada's average mobile Internet service prices fall on the high side of the group of surveyed countries.
Attachment 1 – Service baskets 2021
Table A1.1
Mobile wireless service baskets
- Level 1: 450 voice minutes and 300 SMS (texts);
- Level 2: 1 GB of data usage per month (no talk or text);
- Level 3: unlimited nationwide talk and text along with 2-4 GB of data;
- Level 4: unlimited nationwide talk and text along with 5-6 GB of data;
- Level 5: unlimited nationwide talk and text along with 7-9 GB of data;
- Level 6: unlimited nationwide talk and text along with 10-19 GB of data;
- Level 7: unlimited nationwide talk and text along with 20-49 GB of data; and
- Level 8: unlimited nationwide talk and text along with 50-99 GB of data.
Table A1.2
Broadband internet service baskets
- Level 1: speeds of 3-9 Mbps;
- Level 2: speeds of 10 to 15 Mbps;
- Level 3: speeds of 16 to 40 Mbps;
- Level 4: speeds of 41 to 100 Mbps;
- Level 5: speeds of 101 to 250 Mbps;
- Level 6: speeds of 251 to 500 Mbps; and
- Level 7: speeds greater than 500 Mbps
Table A1.3
Mobile internet service baskets
- Level 1: 2 to 4 GB per month
- Level 2: 5 to 10 GB per month
- Level 3: 11-49 GB per month
- Level 4: 50-99 GB per month
Attachment 2 – Canadian price comparisons 2021
Table A2.1 – Canadian historical mobile wireless prices
Note: Due to Basket redefinitions in 2020, historical comparisons prior to that date are not exact in some categories
| - | NS | QC | ON | MB | SK | BC | Canada | YoY% |
|---|---|---|---|---|---|---|---|---|
| 2017 | $41.03 | $38.62 | $41.85 | $36.40 | $35.91 | $44.40 | $40.95 | -16.00% |
| 2018 | $42.39 | $36.69 | $40.42 | $39.25 | $36.71 | $41.28 | $39.43 | -3.72% |
| 2019 | $39.77 | $37.23 | $37.79 | $38.90 | $27.72 | $39.28 | $37.62 | -4.59% |
| 2020 | $29.59 | $30.86 | $30.88 | $30.96 | $30.49 | $29.71 | $30.63 | -18.57% |
| 2021 | $26.36 | $27.53 | $26.41 | $27.12 | $24.19 | $26.68 | $26.70 | -12.83% |
| CAGR | -10.47% | -8.05% | -10.87% | -7.10% | -9.41% | -11.96% | -10.12% |
| - | NS | QC | ON | MB | SK | BC | Canada | YoY% |
|---|---|---|---|---|---|---|---|---|
| 2020 | $33.37 | $32.46 | $32.24 | $32.57 | $20.21 | $31.71 | $31.82 | |
| 2021 | $28.37 | $25.70 | $24.23 | $29.70 | $16.18 | $25.67 | $24.92 | -21.67% |
| CAGR | n/a | n/a | n/a | n/a | n/a | n/a | n/a |
| - | NS | QC | ON | MB | SK | BC | Canada | YoY% |
|---|---|---|---|---|---|---|---|---|
| 2017 | $93.98 | $68.26 | $87.45 | $67.04 | $56.43 | $93.74 | $81.61 | 0.70% |
| 2018 | $86.48 | $57.95 | $85.23 | $52.77 | $78.48 | $85.09 | $75.44 | -7.56% |
| 2019 | $83.94 | $53.92 | $84.71 | $57.63 | $56.72 | $85.83 | $74.42 | -1.36% |
| 2020 | $46.23 | $42.74 | $46.14 | $46.17 | $46.85 | $46.43 | $45.30 | -39.12% |
| 2021 | $39.69 | $39.67 | $38.72 | $39.44 | $37.77 | $39.30 | $39.09 | -13.71% |
| CAGR | -19.39% | -12.56% | -18.43% | -12.42% | -9.55% | -19.53% | -16.77% |
| - | NS | QC | ON | MB | SK | BC | Canada | YoY% |
|---|---|---|---|---|---|---|---|---|
| 2017 | $105.89 | $87.09 | $113.95 | $74.71 | $74.06 | $121.49 | $104.49 | 8.20% |
| 2018 | $101.67 | $65.27 | $99.69 | $61.56 | $66.68 | $100.76 | $87.32 | -16.43% |
| 2019 | $98.62 | $64.28 | $100.21 | $65.35 | $56.66 | $101.13 | $87.57 | 0.29% |
| 2020 | $53.16 | $46.92 | $51.96 | $52.90 | $59.83 | $53.38 | $51.21 | -41.52% |
| 2021 | $45.59 | $45.61 | $45.08 | $45.39 | $50.23 | $45.25 | $45.47 | -11.20% |
| CAGR | -19.00% | -14.93% | -20.69% | -11.71% | -9.25% | -21.88% | -18.78% |
| - | NS | QC | ON | MB | SK | BC | Canada | YoY% |
|---|---|---|---|---|---|---|---|---|
| 2020 | $64.53 | $58.07 | $62.50 | $63.89 | $65.20 | $63.20 | $61.65 | |
| 2021 | $54.14 | $58.27 | $52.02 | $53.52 | $55.45 | $53.12 | $54.13 | -12.19% |
| CAGR | n/a | n/a | n/a | n/a | n/a | n/a | n/a |
| - | NS | QC | ON | MB | SK | BC | Canada | YoY% |
|---|---|---|---|---|---|---|---|---|
| 2020 | $80.12 | $69.15 | $76.76 | $69.21 | $71.27 | $78.47 | $74.57 | |
| 2021 | $60.49 | $52.70 | $67.07 | $60.61 | $68.68 | $66.88 | $62.77 | -15.83% |
| CAGR | n/a | n/a | n/a | n/a | n/a | n/a | n/a |
| - | NS | QC | ON | MB | SK | BC | Canada | YoY% |
|---|---|---|---|---|---|---|---|---|
| 2020 | $98.56 | $86.43 | $92.30 | $89.09 | $91.29 | $94.16 | $91.04 | |
| 2021 | $80.74 | $58.67 | $83.36 | $71.93 | $85.15 | $83.28 | $76.23 | -16.72% |
| CAGR | n/a | n/a | n/a | n/a | n/a | n/a | n/a |
| - | NS | QC | ON | MB | SK | BC | Canada | YoY% |
|---|---|---|---|---|---|---|---|---|
| 2018 | $415.43 | n/a | $415.00 | $75.00 | $210.94 | $415.00 | $383.49 | |
| 2019 | $411.76 | n/a | $413.44 | n/a | $170.94 | $412.38 | $400.09 | 4.33% |
| 2020 | $128.09 | $117.22 | $126.54 | $117.06 | $113.29 | $126.05 | $123.11 | -69.23% |
| 2021 | $125.43 | $113.87 | $125.00 | $113.07 | $112.51 | $125.00 | $121.06 | -1.67% |
| CAGR | -32.91% | n/a | -32.97% | 14.67% | -18.90% | -32.97% | -31.91% |
Wall Communications Inc. 2021
Table A2.2 - Canadian historical fixed broadband internet prices
Note: Due to Basket redefinitions, historical comparisons are not exact in some categories
| - | NS | QC | ON | MB | SK | BC | Canada | YoY |
|---|---|---|---|---|---|---|---|---|
| 2008 | $34.95 | $32.45 | $38.95 | $29.95 | $30.45 | $23.45 | $32.88 | - |
| 2009 | $35.95 | $28.43 | $35.45 | $30.95 | $30.45 | $24.95 | $30.98 | -5.79% |
| 2010 | $36.95 | $29.43 | $33.45 | n/a | $30.95 | $29.00 | $31.44 | 1.49% |
| 2011 | $36.15 | $36.90 | $34.15 | n/a | $32.52 | $33.00 | $34.85 | 10.86% |
| 2012 | $39.15 | $33.35 | $45.37 | n/a | $31.95 | $35.40 | $39.37 | 12.98% |
| 2013 | $42.15 | n/a | n/a | n/a | $31.95 | $39.00 | $38.91 | -1.19% |
| 2014 | $40.15 | n/a | $50.95 | n/a | $42.95 | n/a | $50.00 | 28.50% |
| 2015 | $55.13 | n/a | n/a | n/a | $34.10 | n/a | $47.51 | -4.96% |
| 2016 | $88.73 | $41.07 | $33.63 | $55.80 | $46.95 | $51.00 | $41.94 | -11.74% |
| 2017 | $50.27 | $41.47 | $32.52 | $59.00 | $49.75 | $57.58 | $41.83 | -0.25% |
| 2018 | $39.40 | $45.19 | $39.11 | $30.61 | $46.17 | $40.01 | $40.67 | -2.78% |
| 2019 | $57.95 | $37.64 | $35.09 | $28.61 | n/a | $33.51 | $35.98 | -11.54% |
| 2020 | $54.86 | $43.86 | $44.90 | $42.28 | n/a | $42.22 | $44.37 | 23.30% |
| 2021 | $56.85 | $45.78 | $50.36 | $41.03 | $41.03 | $44.24 | $47.60 | 7.77% |
| CAGR | 3.81% | 2.68% | 2.00% | 2.45% | n/a | 5.00% | 2.89% | - |
| - | NS | QC | ON | MB | SK | BC | Canada | YoY |
|---|---|---|---|---|---|---|---|---|
| 2008 | $47.45 | $48.95 | $48.95 | $41.95 | $45.45 | $40.95 | $46.58 | - |
| 2009 | $48.45 | $50.43 | $50.95 | $42.95 | $45.45 | $38.45 | $47.26 | 1.47% |
| 2010 | $49.45 | $51.43 | $47.95 | n/a | $45.95 | $40.00 | $47.60 | 0.71% |
| 2011 | $50.75 | $52.83 | $49.33 | n/a | $48.52 | $45.65 | $49.79 | 4.61% |
| 2012 | $57.75 | $60.92 | $52.79 | n/a | $54.95 | $46.40 | $54.31 | 9.07% |
| 2013 | $51.15 | $55.60 | $47.18 | n/a | $54.95 | $53.51 | $51.20 | -5.72% |
| 2014 | $54.95 | $53.91 | $55.25 | n/a | $54.95 | $56.68 | $55.10 | 7.61% |
| 2015 | $74.45 | $54.83 | $55.17 | $59.17 | $52.88 | $59.90 | $56.66 | 2.84% |
| 2016 | n/a | $51.75 | $61.92 | $62.60 | $56.95 | $62.00 | $58.88 | 3.91% |
| 2017 | n/a | $53.26 | $72.14 | $66.70 | $59.75 | $69.29 | $65.54 | 11.31% |
| 2018 | n/a | $56.61 | $48.33 | $76.52 | $55.34 | $74.77 | $57.36 | -12.48% |
| 2019 | n/a | $55.38 | $50.95 | $68.58 | $49.95 | $52.61 | $53.20 | -7.26% |
| 2020 | n/a | $58.54 | $52.45 | $67.48 | $50.37 | $51.80 | $54.61 | 2.67% |
| 2021 | n/a | $53.43 | $50.21 | $60.00 | $50.44 | $50.16 | $51.54 | -5.64% |
| CAGR | n/a | 0.68% | 0.20% | 2.79% | 0.80% | 1.57% | 0.78% | - |
| - | NS | QC | ON | MB | SK | BC | Canada | YoY |
|---|---|---|---|---|---|---|---|---|
| 2008 | $57.45 | $83.45 | $73.95 | $52.95 | $55.95 | $50.95 | $68.74 | - |
| 2009 | $58.45 | $64.40 | $62.45 | $52.95 | $55.95 | $53.45 | $60.08 | -12.60% |
| 2010 | $59.45 | $65.40 | $62.45 | n/a | $56.45 | $55.48 | $61.88 | 3.00% |
| 2011 | $60.75 | $66.33 | $65.35 | n/a | $56.75 | $55.00 | $63.44 | 2.52% |
| 2012 | $88.95 | $66.95 | $72.17 | n/a | $79.95 | $54.60 | $67.94 | 7.09% |
| 2013 | $77.95 | $67.05 | $64.35 | n/a | $79.95 | $60.69 | $65.18 | -4.07% |
| 2014 | $87.95 | $67.15 | $70.87 | n/a | $70.95 | $62.00 | $68.60 | 5.25% |
| 2015 | $92.95 | $59.93 | $71.39 | $67.93 | $62.88 | $68.17 | $67.81 | -1.15% |
| 2016 | n/a | $56.09 | $65.20 | $70.60 | $62.95 | $69.06 | $63.48 | -6.39% |
| 2017 | n/a | $50.80 | $70.89 | $73.35 | $73.95 | $73.09 | $65.59 | 3.32% |
| 2018 | $82.50 | $55.62 | $79.15 | $76.82 | $66.19 | $71.16 | $70.70 | 7.78% |
| 2019 | n/a | $65.24 | $51.54 | $77.90 | $66.19 | $40.39 | $55.20 | -21.91% |
| 2020 | n/a | $59.37 | $59.91 | $54.78 | $62.26 | $71.94 | $61.62 | 11.63% |
| 2021 | $92.95 | $58.18 | $66.38 | $77.62 | $57.38 | $78.68 | $66.31 | 7.61% |
| CAGR | n/a | -2.74% | -0.83% | 2.99% | 0.19% | 3.40% | -0.28% | - |
| - | NS | QC | ON | MB | SK | BC | Canada | YoY |
|---|---|---|---|---|---|---|---|---|
| 2011 | $84.75 | $73.30 | $73.75 | n/a | $99.95 | $91.40 | $77.71 | - |
| 2012 | $138.95 | $82.95 | $106.98 | n/a | n/a | $74.90 | $94.39 | 21.47% |
| 2013 | $102.75 | $82.95 | $80.57 | n/a | $99.95 | $85.00 | $82.88 | -12.19% |
| 2014 | $99.55 | $84.75 | $86.87 | n/a | $105.95 | $86.00 | $86.46 | 4.31% |
| 2015 | $99.26 | $74.51 | $79.68 | $87.10 | $105.80 | $89.79 | $80.63 | -6.74% |
| 2016 | $84.17 | $72.21 | $76.80 | $89.80 | $85.95 | $89.16 | $78.77 | -2.30% |
| 2017 | $87.22 | $78.06 | $85.51 | $90.00 | $83.95 | $79.18 | $82.54 | 4.79% |
| 2018 | $95.69 | $71.14 | $95.84 | $94.14 | $96.65 | $86.67 | $87.00 | 5.41% |
| 2019 | $86.27 | $73.63 | $70.42 | $83.71 | $96.65 | $62.34 | $72.01 | -17.23% |
| 2020 | $76.41 | $67.08 | $83.33 | $77.66 | $71.14 | $77.82 | $77.18 | 7.18% |
| 2021 | $93.99 | $60.87 | $84.69 | $81.88 | $73.11 | $84.31 | $77.98 | 1.04% |
| CAGR | 1.04% | -1.84% | 1.39% | -1.02% | -3.08% | -0.80% | 0.04% | - |
| - | NS | QC | ON | MB | SK | BC | Canada | YoY |
|---|---|---|---|---|---|---|---|---|
| 2016 | $133.10 | $138.80 | $92.91 | $123.00 | n/a | $123.00 | $114.65 | - |
| 2017 | $113.55 | $79.15 | $100.08 | $122.01 | $139.95 | $92.50 | $95.10 | -17.06% |
| 2018 | $108.62 | $87.22 | $108.90 | $116.44 | $104.95 | $107.61 | $102.76 | 8.06% |
| 2019 | $103.95 | $87.00 | $87.11 | $74.53 | $104.95 | $59.31 | $83.25 | -18.99% |
| 2020 | $84.95 | $60.00 | $95.44 | $78.91 | $96.20 | $89.32 | $83.95 | 0.85% |
| 2021 | n/a | $82.46 | $104.50 | $93.97 | $71.55 | $94.38 | $95.00 | 13.16% |
| CAGR | n/a | -9.89% | 2.38% | -5.24% | -15.44% | -5.16% | -3.69% | - |
| - | NS | QC | ON | MB | SK | BC | Canada | YoY |
|---|---|---|---|---|---|---|---|---|
| 2018 | $125.69 | $105.45 | $135.23 | n/a | $144.95 | n/a | $123.87 | - |
| 2019 | $112.13 | $78.30 | $96.74 | $98.19 | $144.95 | $89.94 | $93.03 | -24.90% |
| 2020 | $98.31 | $76.27 | $107.38 | $100.00 | $106.72 | $99.56 | $97.16 | 4.44% |
| 2021 | $92.95 | $71.62 | $112.88 | $100.24 | $94.52 | $101.09 | $98.08 | 0.95% |
| CAGR | -9.57% | -12.10% | -5.84% | 1.04% | -13.28% | 6.02% | -7.49% | - |
| - | NS | QC | ON | MB | SK | BC | Canada | YoY |
|---|---|---|---|---|---|---|---|---|
| 2020 | $112.12 | $87.45 | $117.90 | $113.59 | n/a | $108.94 | $107.55 | - |
| 2021 | $115.23 | $79.95 | $123.51 | $113.62 | $123.42 | $108.33 | $108.71 | 1.08% |
| CAGR | 2.77% | -8.58% | 4.76% | 0.02% | n/a | -0.56% | 1.08% | - |
Wall Communications Inc. 2021
Table A2.3 - Canadian historical mobile internet prices
Note: Due to Basket redefinitions in 2020, historical comparisons prior to that date are not exact in some categories
| - | NS | QC | ON | MB | SK | BC | Canada | YoY% |
|---|---|---|---|---|---|---|---|---|
| 2010 | $54.15 | $54.15 | $54.15 | n/a | $56.23 | $54.16 | $54.19 | - |
| 2011 | $52.32 | $52.76 | $52.17 | n/a | $53.98 | $52.22 | $52.41 | -3.29% |
| 2012 | $53.05 | $52.56 | $52.51 | n/a | $53.05 | $52.51 | $52.55 | 0.27% |
| 2013 | $45.12 | $44.52 | $44.37 | n/a | $48.99 | $44.52 | $44.55 | -15.22% |
| 2014 | $43.75 | $43.22 | $43.19 | n/a | $47.08 | $43.30 | $43.30 | -2.80% |
| 2015 | $43.06 | $43.63 | $43.19 | $44.88 | $50.38 | $43.30 | $43.55 | 0.56% |
| 2016 | $46.07 | $45.72 | $46.53 | $48.00 | $52.56 | $46.53 | $46.47 | 6.71% |
| 2017 | $42.93 | $42.32 | $43.92 | $44.65 | $27.68 | $42.86 | $43.01 | -7.44% |
| 2018 | $41.96 | $39.43 | $37.38 | $39.10 | $41.77 | $37.36 | $38.28 | -11.01% |
| 2019 | $42.99 | $41.10 | $40.06 | $41.95 | $42.85 | $40.01 | $40.60 | 6.08% |
| 2020 | $46.73 | $43.44 | $41.19 | $44.09 | $46.64 | $43.32 | $42.63 | 5.00% |
| 2021 | $33.02 | $37.43 | $29.15 | $33.06 | $32.59 | $31.31 | $32.13 | -24.63% |
| CAGR | -4.40% | -3.30% | -5.47% | -4.96% | -4.84% | -4.86% | -4.64% | - |
| - | NS | QC | ON | MB | SK | BC | Canada | YoY% |
|---|---|---|---|---|---|---|---|---|
| 2012 | $66.38 | $60.94 | $65.59 | n/a | $69.55 | $70.22 | $65.11 | - |
| 2013 | $66.79 | $59.22 | $65.21 | n/a | $70.11 | $71.28 | $64.67 | -0.67% |
| 2014 | $67.08 | $59.49 | $65.60 | n/a | $68.75 | $65.90 | $63.90 | -1.19% |
| 2015 | $65.73 | $60.57 | $65.60 | $68.63 | $71.88 | $65.90 | $64.48 | 0.91% |
| 2016 | $62.47 | $62.62 | $63.19 | $66.00 | $71.31 | $63.19 | $63.30 | -1.82% |
| 2017 | $61.01 | $60.71 | $61.08 | $62.78 | $33.99 | $62.14 | $60.79 | -3.98% |
| 2018 | $62.39 | $61.98 | $62.38 | $62.80 | $37.63 | $62.52 | $61.90 | 1.83% |
| 2019 | $63.41 | $63.65 | $65.21 | $63.35 | $47.75 | $65.37 | $64.04 | 3.45% |
| 2020 | $67.03 | $65.98 | $66.68 | $66.76 | $47.26 | $68.59 | $66.10 | 3.22% |
| 2021 | $59.65 | $62.65 | $62.79 | $61.68 | $42.72 | $64.72 | $62.18 | -5.93% |
| CAGR | -1.18% | 0.31% | -0.48% | -1.76% | -5.27% | -0.90% | -0.51% | - |
| - | NS | QC | ON | MB | SK | BC | Canada | YoY% |
|---|---|---|---|---|---|---|---|---|
| 2021 | $138.50 | $135.06 | $132.19 | $132.68 | $94.58 | $135.38 | $132.30 | - |
| CAGR | n/a | n/a | n/a | n/a | n/a | n/a | n/a | - |
| - | NS | QC | ON | MB | SK | BC | Canada | YoY% |
|---|---|---|---|---|---|---|---|---|
| 2016 | $78.89 | $81.07 | $80.70 | $84.50 | $81.41 | $80.70 | $80.98 | - |
| 2017 | $83.85 | $80.86 | $85.00 | $81.36 | $47.83 | $81.25 | $82.28 | 1.60% |
| 2018 | $85.02 | $83.77 | $83.94 | $83.25 | $51.98 | $83.94 | $83.35 | 1.30% |
| 2019 | $80.78 | $82.42 | $84.85 | $80.60 | $60.40 | $84.85 | $82.99 | -0.43% |
| 2020 | $84.37 | $84.85 | $85.77 | $84.65 | $60.10 | $87.66 | $84.79 | 2.17% |
| 2021 | $97.50 | $100.64 | $97.50 | $97.50 | $60.86 | $97.50 | $96.99 | 14.39% |
| CAGR | 4.33% | 4.42% | 3.85% | 2.90% | -5.65% | 3.85% | 3.67% | - |
Wall Communications Inc. 2021
Attachment 3 – International price comparisons 2021
Table A3.1 – International historical mobile wireless prices
Note: Due to Basket redefinitions, historical comparisons are not exact in some categories.
| - | Canada | U.S.A. | Australia | U.K. | France | Italy | Germany | Japan |
|---|---|---|---|---|---|---|---|---|
| 2016 | $48.77 | $51.64 | n/a | $25.79 | $24.17 | $24.41 | $28.28 | $48.78 |
| 2017 | $40.95 | $49.48 | $27.36 | $22.58 | $23.88 | n/a | n/a | $45.38 |
| 2018 | $39.43 | $44.29 | n/a | $16.68 | n/a | $11.86 | $15.06 | n/a |
| 2019 | $37.62 | $42.89 | n/a | $16.32 | $10.76 | $12.25 | $14.92 | $35.31 |
| 2020 | $30.63 | $48.65 | n/a | $23.74 | $12.63 | n/a | n/a | $30.70 |
| 2021 | $26.70 | $49.19 | n/a | n/a | $6.78 | n/a | n/a | $32.67 |
| CAGR | -11.35% | -0.97% | n/a | n/a | -22.45% | n/a | n/a | -7.71% |
| - | Canada | U.S.A. | Australia | U.K. | France | Italy | Germany | Japan |
|---|---|---|---|---|---|---|---|---|
| 2020 | $31.82 | $26.95 | n/a | n/a | n/a | n/a | n/a | $35.06 |
| 2021 | $24.92 | n/a | n/a | $21.47 | n/a | n/a | n/a | $34.51 |
| CAGR | -21.67% | n/a | n/a | n/a | n/a | n/a | n/a | -1.58% |
| - | Canada | U.S.A. | Australia | U.K. | France | Italy | Germany | Japan |
|---|---|---|---|---|---|---|---|---|
| 2016 | $81.05 | $89.50 | $44.78 | $35.55 | $61.60 | $49.42 | $68.12 | n/a |
| 2017 | $81.61 | $67.20 | $54.29 | $34.26 | $31.86 | $41.22 | $72.41 | $60.11 |
| 2018 | $75.44 | $61.26 | $24.70 | $26.56 | $30.91 | $21.11 | $45.80 | $81.52 |
| 2019 | $74.42 | $59.50 | $22.35 | $24.72 | $33.09 | $26.80 | $41.08 | $78.42 |
| 2020 | $45.30 | $39.08 | $24.88 | $23.27 | $33.31 | $28.38 | $43.61 | $73.60 |
| 2021 | $39.09 | $54.11 | n/a | $27.82 | n/a | n/a | $17.75 | $86.62 |
| CAGR | -13.57% | -9.57% | n/a | -4.79% | n/a | n/a | -23.59% | 9.56% |
| - | Canada | U.S.A. | Australia | U.K. | France | Italy | Germany | Japan |
|---|---|---|---|---|---|---|---|---|
| 2016 | $96.55 | $117.33 | $66.67 | $42.22 | $70.12 | $61.02 | $88.23 | n/a |
| 2017 | $104.49 | $75.06 | $67.04 | $39.20 | $46.45 | $53.22 | $82.21 | $74.12 |
| 2018 | $87.32 | $97.88 | $27.27 | $31.26 | $34.31 | $29.55 | $64.89 | $103.07 |
| 2019 | $87.57 | $63.04 | n/a | $28.48 | $27.28 | n/a | $54.67 | $95.63 |
| 2020 | $51.21 | $43.52 | n/a | $25.73 | $28.41 | n/a | $54.43 | $88.46 |
| 2021 | $45.47 | $45.79 | n/a | $21.43 | $25.63 | $21.82 | $42.02 | $99.95 |
| CAGR | -13.98% | -17.15% | n/a | -12.68% | -18.23% | -18.59% | -13.79% | 7.76% |
| - | Canada | U.S.A. | Australia | U.K. | France | Italy | Germany | Japan |
|---|---|---|---|---|---|---|---|---|
| 2020 | $61.65 | $64.47 | $24.88 | $17.56 | n/a | n/a | $67.49 | $100.96 |
| 2021 | $54.13 | $43.15 | n/a | $17.66 | n/a | n/a | n/a | $110.72 |
| CAGR | -12.19% | -33.07% | n/a | 0.58% | n/a | n/a | n/a | 9.67% |
| - | Canada | U.S.A. | Australia | U.K. | France | Italy | Germany | Japan |
|---|---|---|---|---|---|---|---|---|
| 2020 | $74.57 | $61.56 | $32.93 | $22.15 | $44.71 | n/a | $82.66 | $78.89 |
| 2021 | $62.77 | $63.52 | $32.30 | $24.24 | $39.45 | n/a | $61.45 | $73.62 |
| CAGR | -15.83% | 3.19% | -1.94% | 9.46% | -11.77% | n/a | -25.65% | -6.68% |
| - | Canada | U.S.A. | Australia | U.K. | France | Italy | Germany | Japan |
|---|---|---|---|---|---|---|---|---|
| 2020 | $91.04 | n/a | $41.60 | $35.66 | $33.29 | $34.21 | $86.02 | $108.94 |
| 2021 | $76.23 | n/a | $40.09 | $31.05 | $33.66 | $31.07 | $77.63 | $110.47 |
| CAGR | -16.27% | n/a | -3.63% | -12.93% | 1.10% | -9.19% | -9.75% | 1.40% |
| - | Canada | U.S.A. | Australia | U.K. | France | Italy | Germany | Japan |
|---|---|---|---|---|---|---|---|---|
| 2018 | $383.49 | $109.35 | $82.99 | $44.04 | $66.43 | $62.57 | $101.27 | $208.91 |
| 2019 | $400.09 | $91.18 | $58.90 | $41.39 | $31.52 | $36.66 | $78.24 | $101.76 |
| 2020 | $123.11 | $82.94 | $97.12 | $55.87 | $57.27 | $66.85 | $102.08 | n/a |
| 2021 | $121.06 | n/a | $55.52 | $38.97 | $37.72 | $36.29 | n/a | $118.13 |
| CAGR | -31.91% | n/a | -12.54% | -4.00% | -17.20% | -16.61% | n/a | -17.31% |
Wall Communications Inc. 2021
Table A3.2 - International historical fixed broadband internet prices
Note: Due to Basket redefinitions, historical comparisons are not exact in some categories.
| - | Canada | U.S.A. | Australia | U.K. | France | Italy | Germany | Japan |
|---|---|---|---|---|---|---|---|---|
| 2008 | $32.88 | $33.77 | $42.79 | $29.93 | $42.23 | n/a | n/a | n/a |
| 2009 | $30.98 | $40.19 | $41.31 | n/a | $44.87 | n/a | n/a | n/a |
| 2010 | $31.44 | $39.61 | $34.91 | n/a | n/a | n/a | n/a | $39.73 |
| 2011 | $34.85 | $51.06 | $29.84 | n/a | $28.33 | n/a | n/a | $43.13 |
| 2012 | $39.37 | $57.24 | n/a | n/a | n/a | n/a | n/a | $50.48 |
| 2013 | $38.91 | $52.38 | n/a | n/a | n/a | n/a | n/a | $45.55 |
| 2014 | $50.00 | $62.53 | n/a | n/a | n/a | n/a | n/a | $56.55 |
| 2015 | $47.51 | $54.54 | n/a | n/a | n/a | n/a | n/a | $57.83 |
| 2016 | $41.94 | $79.64 | $58.38 | n/a | n/a | n/a | $28.28 | n/a |
| 2017 | $41.83 | $63.92 | $54.72 | n/a | n/a | $41.18 | n/a | $59.49 |
| 2018 | $40.67 | $63.32 | n/a | n/a | n/a | $60.53 | n/a | $40.56 |
| 2019 | $35.98 | $62.50 | n/a | $37.52 | n/a | n/a | n/a | n/a |
| 2020 | $44.37 | n/a | n/a | $37.01 | n/a | $50.98 | n/a | $73.33 |
| 2021 | $47.81 | n/a | n/a | n/a | n/a | n/a | n/a | $73.10 |
| CAGR | 2.92% | n/a | n/a | n/a | n/a | n/a | n/a | 5.70% |
| - | Canada | U.S.A. | Australia | U.K. | France | Italy | Germany | Japan |
|---|---|---|---|---|---|---|---|---|
| 2008 | $46.58 | $55.97 | $62.56 | $44.05 | $45.82 | n/a | n/a | n/a |
| 2009 | $47.26 | $57.92 | $63.76 | $30.22 | $48.69 | n/a | n/a | n/a |
| 2010 | $47.60 | $58.97 | $52.01 | $40.57 | $44.03 | n/a | n/a | $49.55 |
| 2011 | $49.79 | $65.14 | $56.74 | $40.72 | $47.41 | n/a | n/a | $53.79 |
| 2012 | $54.31 | $78.84 | $59.81 | $30.50 | $46.97 | n/a | n/a | $55.70 |
| 2013 | $51.20 | $81.42 | $58.15 | $32.85 | n/a | n/a | n/a | $52.53 |
| 2014 | $55.10 | $72.91 | $50.67 | $30.22 | n/a | $52.26 | $26.09 | $60.65 |
| 2015 | $56.66 | $67.66 | $53.75 | n/a | $67.78 | $54.31 | $29.08 | $61.03 |
| 2016 | $58.88 | $83.85 | $54.49 | n/a | $73.83 | $64.29 | n/a | $51.75 |
| 2017 | $65.54 | $82.43 | $46.90 | n/a | $39.81 | n/a | $27.77 | $54.39 |
| 2018 | $57.36 | $75.56 | n/a | $54.13 | $48.83 | n/a | n/a | $61.14 |
| 2019 | $53.20 | $69.35 | n/a | $40.36 | n/a | n/a | n/a | $47.76 |
| 2020 | $54.61 | n/a | n/a | $38.84 | n/a | $50.98 | n/a | $69.10 |
| 2021 | $51.55 | n/a | n/a | n/a | n/a | n/a | n/a | $74.28 |
| CAGR | 0.78% | n/a | n/a | n/a | n/a | n/a | n/a | 3.75% |
| - | Canada | U.S.A. | Australia | U.K. | France | Italy | Germany | Japan |
|---|---|---|---|---|---|---|---|---|
| 2008 | $68.74 | $67.40 | $76.47 | $52.72 | $49.41 | n/a | n/a | n/a |
| 2009 | $60.08 | $70.41 | $77.98 | $35.93 | $47.73 | n/a | n/a | n/a |
| 2010 | $61.88 | $75.26 | $74.32 | $46.24 | $57.45 | n/a | n/a | $72.15 |
| 2011 | $63.44 | $79.60 | $59.72 | $40.09 | $66.37 | n/a | n/a | $54.52 |
| 2012 | $67.94 | $97.00 | $61.69 | $40.88 | $46.07 | n/a | n/a | $59.37 |
| 2013 | $65.18 | $99.10 | $57.10 | $43.01 | $49.34 | n/a | n/a | $61.52 |
| 2014 | $68.60 | $79.76 | $67.44 | $46.89 | $51.15 | $52.92 | $38.30 | $63.88 |
| 2015 | $67.81 | $91.55 | $69.64 | $41.25 | $51.68 | $52.28 | $47.08 | $64.50 |
| 2016 | $63.48 | $97.53 | $57.41 | $40.43 | n/a | $41.77 | $49.75 | $71.52 |
| 2017 | $65.59 | $99.64 | $70.35 | $55.67 | $50.43 | n/a | $46.80 | $68.32 |
| 2018 | $70.70 | $84.33 | $66.74 | $49.42 | $38.15 | $45.45 | $50.18 | $71.77 |
| 2019 | $55.20 | $69.02 | $62.36 | $46.11 | n/a | $49.26 | $49.15 | n/a |
| 2020 | $61.62 | $65.10 | $56.53 | $40.39 | $36.33 | $50.98 | $43.65 | $72.51 |
| 2021 | $65.61 | $59.11 | $59.61 | $41.82 | $28.25 | $41.27 | $50.52 | $76.04 |
| CAGR | -0.36% | -1.00% | -1.90% | -1.77% | -4.21% | -3.49% | 4.03% | 0.48% |
| - | Canada | U.S.A. | Australia | U.K. | France | Italy | Germany | Japan |
|---|---|---|---|---|---|---|---|---|
| 2011 | $77.71 | $95.07 | $67.19 | $50.07 | $49.79 | n/a | n/a | $59.76 |
| 2012 | $94.39 | $160.97 | $82.25 | $58.66 | $62.36 | n/a | n/a | $62.65 |
| 2013 | $82.88 | $123.27 | $72.69 | $53.31 | $54.58 | n/a | n/a | $64.89 |
| 2014 | $86.46 | $103.17 | $70.33 | $47.76 | $55.98 | $61.79 | $58.52 | $67.73 |
| 2015 | $80.63 | $105.90 | $72.66 | $50.75 | $57.95 | $60.45 | $59.32 | $65.32 |
| 2016 | $78.77 | $112.30 | $71.03 | $54.20 | $63.80 | $53.02 | $61.78 | $49.78 |
| 2017 | $82.54 | $114.81 | $89.98 | $59.38 | $42.47 | n/a | $54.45 | $69.58 |
| 2018 | $87.00 | $105.34 | $88.74 | $67.69 | $53.14 | $65.20 | $64.84 | $84.43 |
| 2019 | $72.01 | $75.48 | $75.06 | $55.20 | n/a | $42.27 | $53.80 | $63.69 |
| 2020 | $77.18 | $72.80 | $78.28 | $49.23 | n/a | $50.98 | $53.01 | $66.83 |
| 2021 | $78.18 | $78.87 | $81.97 | $49.24 | n/a | n/a | $51.94 | $66.63 |
| CAGR | 0.06% | -1.85% | 2.01% | -0.17% | n/a | n/a | -1.69% | 1.09% |
| - | Canada | U.S.A. | Australia | U.K. | France | Italy | Germany | Japan |
|---|---|---|---|---|---|---|---|---|
| 2016 | $114.65 | $127.69 | n/a | $57.56 | $70.54 | n/a | $56.57 | $71.36 |
| 2017 | $95.10 | $145.15 | n/a | $70.67 | $50.19 | $60.39 | $58.33 | $65.64 |
| 2018 | $102.76 | $131.06 | n/a | $64.86 | $60.86 | n/a | $72.45 | $79.90 |
| 2019 | $83.25 | $93.01 | n/a | $75.87 | $33.79 | $49.26 | $65.87 | $77.69 |
| 2020 | $83.95 | $86.98 | n/a | $75.30 | n/a | $50.98 | $64.85 | $82.70 |
| 2021 | $95.19 | $76.66 | n/a | $73.95 | n/a | n/a | $57.54 | $84.70 |
| CAGR | -3.65% | -9.70% | n/a | 5.14% | n/a | n/a | 0.34% | 3.49% |
| - | Canada | U.S.A. | Australia | U.K. | France | Italy | Germany | Japan |
|---|---|---|---|---|---|---|---|---|
| 2018 | $123.87 | $160.08 | n/a | $78.96 | $70.18 | $46.33 | $94.33 | $72.23 |
| 2019 | $93.03 | $120.62 | n/a | $78.62 | $41.20 | $42.27 | $47.64 | $76.31 |
| 2020 | $97.16 | $97.63 | n/a | $84.08 | $39.51 | $50.98 | n/a | $77.13 |
| 2021 | $99.11 | $94.10 | n/a | $82.57 | $36.47 | n/a | n/a | $63.00 |
| CAGR | -7.16% | -16.23% | n/a | 1.50% | -19.60% | n/a | n/a | -4.46% |
| - | Canada | U.S.A. | Australia | U.K. | France | Italy | Germany | Japan |
|---|---|---|---|---|---|---|---|---|
| 2020 | $107.55 | $113.37 | n/a | $92.86 | $49.69 | $50.98 | $58.42 | $79.46 |
| 2021 | $109.02 | $108.40 | n/a | $91.19 | $44.36 | $42.02 | $54.38 | $85.58 |
| CAGR | 1.37% | -4.39% | n/a | -1.79% | -10.73% | -17.57% | -6.92% | 7.69% |
Wall Communications Inc. 2021
Table A3.3 – International historical mobile internet prices
Note: Due to Basket redefinitions, historical comparisons are not exact in some categories.
| - | Canada | U.S.A. | Australia | U.K. | France | Italy | Germany | Japan |
|---|---|---|---|---|---|---|---|---|
| 2010 | $54.19 | $73.26 | $33.89 | $24.86 | $46.29 | n/a | n/a | $76.00 |
| 2011 | $52.41 | $71.50 | $27.18 | $23.51 | $43.30 | n/a | n/a | $69.38 |
| 2012 | $52.55 | $52.29 | $31.38 | $27.42 | $39.36 | n/a | n/a | $54.89 |
| 2013 | $44.55 | $54.61 | $28.80 | $23.71 | $34.98 | n/a | n/a | $57.54 |
| 2014 | $43.30 | $63.74 | $25.67 | $21.90 | $18.47 | $17.56 | $34.37 | $50.05 |
| 2015 | $43.55 | $63.02 | $28.15 | $21.44 | $17.60 | $15.87 | $25.96 | $55.49 |
| 2016 | $46.47 | $50.68 | $15.57 | $17.61 | $14.98 | $14.35 | $23.56 | $51.81 |
| 2017 | $43.01 | $38.73 | $11.73 | $15.33 | $12.11 | $14.81 | $20.40 | $37.22 |
| 2018 | $38.28 | $43.49 | $15.56 | $15.45 | $15.74 | $12.71 | $22.52 | $70.31 |
| 2019 | $40.60 | $39.72 | n/a | $15.88 | n/a | n/a | $20.45 | $66.43 |
| 2020 | $42.63 | $28.48 | $10.96 | $18.56 | n/a | n/a | $21.83 | $59.57 |
| 2021 | $32.13 | n/a | n/a | $15.43 | n/a | n/a | $21.80 | $59.23 |
| CAGR | -4.64% | n/a | n/a | -4.24% | n/a | n/a | -6.30% | -2.24% |
| - | Canada | U.S.A. | Australia | U.K. | France | Italy | Germany | Japan |
|---|---|---|---|---|---|---|---|---|
| 2012 | $65.11 | $69.51 | $44.85 | $39.11 | $100.15 | n/a | n/a | $56.77 |
| 2013 | $64.67 | $59.82 | $35.13 | $62.01 | $44.65 | n/a | n/a | $58.24 |
| 2014 | $63.90 | $69.05 | $36.80 | $45.93 | $43.04 | $25.86 | $49.70 | $62.04 |
| 2015 | $64.48 | $77.72 | $41.69 | $30.60 | $29.18 | $27.05 | $37.17 | $63.82 |
| 2016 | $63.30 | $76.93 | $29.67 | $21.07 | $28.11 | $21.71 | $37.31 | $73.74 |
| 2017 | $60.79 | $72.44 | $30.84 | $20.54 | $18.59 | $20.87 | $29.67 | $54.81 |
| 2018 | $61.90 | $64.59 | $26.24 | $19.78 | n/a | $17.22 | $35.56 | $75.49 |
| 2019 | $64.04 | $62.05 | $15.03 | $22.18 | $20.73 | $10.56 | $32.81 | $69.41 |
| 2020 | $66.10 | $52.90 | $16.10 | $21.97 | $24.98 | n/a | $30.08 | $69.54 |
| 2021 | $62.18 | $52.27 | $15.86 | $20.59 | $25.26 | n/a | $30.04 | $76.06 |
| CAGR | -0.51% | -3.12% | -10.91% | -6.88% | -14.19% | n/a | -6.94% | 3.30% |
| - | Canada | U.S.A. | Australia | U.K. | France | Italy | Germany | Japan |
|---|---|---|---|---|---|---|---|---|
| 2016 | $80.98 | $110.38 | $48.17 | $24.47 | $63.45 | $31.58 | n/a | $87.09 |
| 2017 | $82.28 | $92.46 | $36.62 | $28.48 | $39.09 | $28.80 | $35.98 | $64.28 |
| 2018 | $83.35 | $87.30 | $39.35 | $28.19 | $33.53 | $38.73 | $38.38 | $105.94 |
| 2019 | $82.99 | $85.97 | $23.66 | $27.85 | $30.05 | $15.06 | $40.50 | $98.68 |
| 2020 | $84.79 | $61.05 | $22.94 | $27.99 | $32.90 | $17.09 | $38.68 | $95.18 |
| 2021 | $96.99 | $71.67 | $23.31 | $28.45 | $34.37 | $26.76 | $38.63 | $73.41 |
| CAGR | 3.67% | -8.27% | -13.51% | 3.06% | -11.54% | -3.26% | 1.80% | -3.36% |
| - | Canada | U.S.A. | Australia | U.K. | France | Italy | Germany | Japan |
|---|---|---|---|---|---|---|---|---|
| 2021 | $132.30 | $96.59 | $43.05 | $43.11 | $65.97 | $21.34 | n/a | $101.24 |
| CAGR | n/a | n/a | n/a | n/a | n/a | n/a | n/a | n/a |
Wall Communications Inc. 2021