
The 2022 Price Comparison Study of Telecommunications Services in Canada and with Foreign Jurisdictions, prepared by Wall Communications Inc., is the fifteenth (2022) edition of the annual telecommunications services price comparison report. The purpose of this Study is to provide a detailed comparative price analysis of telecommunications services within Canada, as well as an international comparison (G7 + Australia).
As in previous years, the telecommunications services examined in this Study were classified in two categories: mobile wireless telephony and fixed line broadband internet. Individual service baskets were defined according to increasing levels of service usage and feature availability under each category.
National incumbents, regional service providers, and resellers/mobile virtual network operators were sampled for the Study. Domestically, prices were collected in six cities across Canada (Halifax, Montreal, Toronto, Winnipeg, Regina and Vancouver). Internationally, data was collected in seven countries, including four cities in the United States (Boston, Kansas City, Minneapolis and Seattle), and the largest city in all other countries (Australia, United Kingdom, France, Italy, Germany and Japan).
Prepared for Innovation, Science and Economic Development Canada
Wall Communications Inc.
Note: The views expressed in this document are solely those of Wall Communications Inc. and do not necessarily represent the views of Innovation, Science and Economic Development Canada or any other person or agency.
Table of contents
- Executive summary
- 1.0 Introduction
- 2.0 Methodology
- 3.0 Mobile wireless service
- 4.0 Fixed broadband internet service
- 5.0 Spotlight section on prices in the Canadian Far North
- Attachment 1 – Service baskets 2022
- Attachment 2 – Canadian price comparisons 2022
- Attachment 3 – International price comparisons 2022
- Attachment 4 – Far North basket descriptions 2022
Executive summary
This is the fifteenth (2022) edition of ISED's annual telecom services price comparison study. The purpose of this Study is to provide a detailed comparative price analysis of telecommunications services in Canada both regionally and relative to the United States and six other countries. The individual service categories and related topics covered by the Study are:
- Mobile Wireless; and
- Fixed Line Broadband Internet.
For each individual service category, prices are measured for a series of defined "service baskets" which have been designed to reflect typical Canadian low to high telecom service usage levels and features. There are eight service baskets or "levels" defined for mobile wireless and seven baskets for fixed broadband. The lowest available advertised regular prices, as offered by the surveyed service providers included in the study, are used to measure the prices of each of the defined service baskets.
For Canada, the surveyed service providers include the incumbent telephone companies (e.g., Bell and TELUS), cable companies (e.g., Rogers, Shaw and Videotron), mobile virtual network operators (MVNOs) (e.g., PC Mobile and Petro-Can), wholesale-based competitors (e.g. Distributel and TekSavvy), and regional wireless market providers (e.g., Freedom, SaskTel, Videotron and Eastlink).Footnote 1 In addition, the largest Flanker brands (offered by the national mobile wireless providers or incumbent fixed broadband providers) are included and used for separate comparisons. Prices are measured in six metropolitan areas: Halifax, Montreal, Toronto, Winnipeg, Regina and Vancouver. Aggregate Canada-wide prices are determined on a subscriber market share weighted average basis.
For international comparison purposes, prices have also been measured using the same methodology for the same set of service baskets for seven other countries: Australia (Sydney), France (Paris), Germany (Berlin), Italy (Rome), Japan (Tokyo), the United Kingdom (London) and the United States (Boston, Kansas City, Minneapolis and Seattle).
The key change to this year's Study is the removal of Mobile Wireless Internet (data only) as a surveyed service category. We have also provided a Spotlight section on mobile wireless and fixed broadband prices in the Canadian far north.
The highlights of this year's price comparison study update follow.
Mobile Wireless
The 2022 eight mobile wireless baskets levels are:
- Level 1: 450 voice minutes and 300 SMS (texts);
- Level 2: 1 GB of data usage per month (no talk or text);
- Level 3: unlimited nationwide talk and text along with 2-4 GB of data;
- Level 4: unlimited nationwide talk and text along with 5-6 GB of data;
- Level 5: unlimited nationwide talk and text along with 7-9 GB of data;
- Level 6: unlimited nationwide talk and text along with 10-19 GB of data;
- Level 7: unlimited nationwide talk and text along with 20-49 GB of data; and
- Level 8: unlimited nationwide talk and text along with 50-99 GB of data.
Mobile wireless trends:
-
Domestic trends:
Prices in lower tier baskets (L1, L3 and L4) stayed much the same or were somewhat higher than in 2021 while higher tier baskets (L5 to L8) saw price declines. Overall, prices generally continue to decline over time with an unweighted average decrease of 2.6% relative to 2021 across all baskets.
Price uniformity across regions continues to characterize the industry, with the province of Saskatchewan appearing as an outlier in L1, L2, L4 and L6. Price uniformity became a more pronounced characteristic beginning in 2020.
As noted last year, L1 – defined as 450 minutes of talk and 300 text messages – has become a rare service offering. Talk and text packages typically begin with unlimited minutes and texts (sometimes restricted by time of day or day of week, but also sometimes including data). Therefore, we have surveyed service offerings that essentially offer unlimited talk and text in the L1 category.
The offering of a standalone 1 GB (data only) plan is also rarely seen. Only two providers (one a regional player and one an MVNO) offer a 1 GB plan.
-
Regional provider prices:Footnote 2
Last year (2021), the prices of regional providers (Freedom, SaskTel, Videotron and Eastlink) typically resulted in average Canadian prices well below the average national price of incumbents, varying from 6% to 22% lower. This year (2022) the results are mixed. Average Canadian prices were lower from the regionals in three baskets (L3, L7 and L8) while average prices were higher in two baskets (L1 and L4).
Freedom offered substantially lower prices than incumbents in L3 and L7 (almost 21% and 39% respectively) and more modestly lower prices in L8 (almost 5%). Eastlink offered substantially lower prices than the incumbents in L7 and L8. Videotron (in Quebec) tended to offer similar prices to the incumbents, although the Fizz (Flanker brand of Videotron) price was often considerably lower than the incumbent average price. SaskTel tended to offer higher prices than incumbent prices (the exception being L3).
Unlike the case in previous years, regional providers now typically provide a Level 8 (50-99 GB) basket. Incumbent average prices in L8 are generally higher than regional prices (with the exception of Saskatchewan).
There was a considerable amount of price variability by the regionals in every basket (that is, the price offered by a regional provider for a given basket in its serving area could differ noticeably from the same basket price offered by the regional provider in another territory). By contrast, the incumbents displayed greater price uniformity across the country.
-
Incumbent main flanker brand prices:Footnote 3
Incumbent Flanker brand prices were largely uniform across the country with the exception of Flanker brand prices in Quebec in L4, L5 and L6 – where Flanker prices were considerably lower than in other regions.
As has been the case previously, Flanker prices tend to be lower, in some cases significantly lower, than the Incumbents' prices. In baskets where both a Flanker and an incumbent plan is offered, the average national Flanker price is between about 8% and 23% lower than the average incumbent national price (excluding L1 where prices are similar). Flankers do not offer an L8 service, as has been the case in previous years.
Flanker prices are generally lower than Canada-wide average regional prices in 2022, in contrast to last year (where both Flankers and regionals offered the same basket in 2021, Flankers were higher priced 15 times and lower priced 13 times). Flanker prices in Ontario and BC were generally much higher (i.e. 11% to 26%) than the regional price in L3, L6 and L7.
-
Mobile virtual network operator (MVNO) prices:
MVNOs only offer service baskets up to the L6 level. In the four baskets where both MVNOs and incumbents offer plans (L1, L3, L4 and L5), the MVNO average Canadian price is consistently lower than the average incumbent price.
MVNO prices remain highly uniform across the country.
-
Market observations:
The lowest priced plans within any given region are most often offered by MVNOs, Flankers or regional providers. Average prices in Quebec in the mid to higher level baskets are generally the lowest in the country.
-
International comparison:
Canada, the U.S. and Japan tend to have the highest prices internationally. Amongst those three countries Canada generally performs favorably in comparison to both the U.S. and Japan. Japan has the highest (PPP adjusted) price in all baskets.
A European country (the U.K., France, Germany or Italy) has the lowest prices in each basket (with the exception of L2 where only Canada and Japan offer a plan). The lowest price found internationally (with the exception of L2) is much lower than the Canadian price – often less than half the Canadian price.
Fixed broadband internet
Seven broadband Internet service baskets are included in the study, which are primarily defined on the basis of download speed:
- Level 1: speeds of 3 to 9 Mbps;
- Level 2: speeds of 10 to 15 Mbps;
- Level 3: speeds of 16 to 40 Mbps;
- Level 4: speeds of 41 to 100 Mbps;
- Level 5: speeds of 101 to 250 Mbps;
- Level 6: speeds of 251 to 500 Mbps; and
- Level 7: speeds greater than 500 Mbps.Footnote 4
Trends in fixed broadband service:
-
Domestic national trends:
In contrast to 2021, Canadian fixed broadband prices decreased or stayed relatively constant in all baskets in 2022. The largest decrease of 11.01% occurred in L3 (16–40 Mbps) while other decreases were typically in the order of 2-4%.
-
Regional trends:
Average prices in Quebec tend to be among the lowest in the country. Prices in Nova Scotia remain generally higher than other regions. Unlike mobile wireless prices (which have gravitated towards uniformity over the past few years) average broadband prices can vary considerably by region. For example, the L6 price varies between $79.65 in Quebec to $113.86 in Nova Scotia. Price variance between regions can be as much as 50% (e.g. in L5).
-
Wholesale-based competitor (WBC) and flanker brand prices:
WBC providers are active in all baskets and typically offer lower prices than the incumbents except in the highest baskets (L6 and L7). In L2 to L5 baskets WBC prices are between 7% and 13% lower than incumbent prices.
WBC plans can have considerable price variability across regions (due at least in part to the variability of wholesale prices in different regions).
Broadband incumbent Flanker brands have very limited availability in Canada, offered only in Ontario and Quebec. Bell's "Virgin" is provided in both Ontario and Quebec while Rogers' "Fido" is offered in Ontario. The regional provider Videotron offers a broadband Flanker service in Quebec with "Fizz".
Incumbent Flanker brand fixed broadband services are only offered in a handful of cases where the incumbent also offers a service. In those cases (L3 and L4 in Quebec and L4 and L5 in Ontario) the Flanker prices are considerably lower in three of four instances. Fizz prices are always much lower than incumbent prices (i.e. 34% to 38% lower) in the three baskets where both Fizz and the incumbents offer a service.
-
International comparison:
Lower level baskets (i.e. L1 and L2) have become rare on the international stage. Only Canada and Japan continue to offer those baskets. Prices in Canada for those two baskets are lower than those of Japan.
L3 has also seen a decline in the number of international offerings, going from all eight surveyed countries in 2021 to just six countries in 2022. Canadian prices are lower than both Australia and Japan but higher than the U.K., France and Germany.
In L4, L6 and L7 Canada has the highest prices of the surveyed countries. European and U.S. prices are generally considerably lower than Canadian prices. While Canada's prices in most baskets have fallen relative to 2021, Canada's broadband service relative price ranking has remained fairly consistent since the study was first conducted in 2008.
Summary data tables
The following table provides a summary of the 2022 price comparison results for Canada and the seven surveyed foreign jurisdictions included in the study. All reported prices for the surveyed foreign jurisdictions exclude sales taxes and are expressed in purchasing power parity (PPP) adjusted Canadian dollars.
| - | Canada | U.S.A. | Australia | U.K. | France | Italy | Germany | Japan |
|---|---|---|---|---|---|---|---|---|
| Wireless Service | ||||||||
| Level 1 (Talk and Text) | $26.19 | $52.00 | n/a | n/a | $6.40 | $15.31 | $9.13 | $35.65 |
| Level 2 (1 GB) | $28.14 | n/a | n/a | n/a | n/a | n/a | n/a | $41.69 |
| Level 3 (2-4 GB data) | $39.15 | $60.51 | n/a | $21.01 | n/a | n/a | $18.35 | $89.23 |
| Level 4 (5-6 GB data) | $45.47 | $48.94 | n/a | $23.63 | $25.45 | n/a | $27.51 | $110.27 |
| Level 5 (7-9 GB data) | $54.01 | $57.67 | n/a | $21.78 | n/a | n/a | $45.83 | $117.77 |
| Level 6 (10-19 GB data) | $55.42 | $66.63 | $28.24 | $23.72 | $43.05 | n/a | $47.53 | $78.32 |
| Level 7 (20-49 GB data) | $72.81 | n/a | $44.91 | $29.94 | n/a | n/a | $76.43 | $98.04 |
| Level 8 (50-99 GB data) | $101.74 | n/a | $38.99 | $32.55 | $40.39 | $29.32 | $70.44 | $111.88 |
| Broadband Service | ||||||||
| Level 1 (3-9 Mbps) | $47.87 | n/a | n/a | n/a | n/a | n/a | n/a | $77.76 |
| Level 2 (10-15 Mbps) | $50.41 | n/a | n/a | n/a | n/a | n/a | n/a | $79.01 |
| Level 3 (16-40 Mbps) | $56.86 | n/a | $63.02 | $42.48 | $30.07 | n/a | $48.47 | $80.89 |
| Level 4 (41-100Mbps) | $75.39 | $59.40 | $70.85 | $43.27 | n/a | n/a | $45.75 | $70.88 |
| Level 5 (100-249 Mbps) | $91.50 | $68.64 | $104.38 | $63.10 | n/a | n/a | $60.95 | $90.10 |
| Level 6 (250-500 Mbps) | $96.86 | $68.12 | n/a | $73.60 | $40.76 | n/a | $55.03 | $91.69 |
| Level 7 (500 Mbps+) | $104.64 | $84.76 | n/a | $85.30 | $50.78 | $40.47 | $56.82 | $98.21 |
Wall Communications Inc. 2022
The year over year price changes for each basket are provided below.
| - | 2022 | 2021 | YoY% 2022/21 |
|---|---|---|---|
| Wireless Service | |||
| Level 1 (Talk and Text) | $26.19 | $26.70 | -1.90% |
| Level 2 (1 GB) | $28.14 | $24.92 | 12.93% |
| Level 3 (2-4 GB data) | $39.15 | $39.09 | 0.15% |
| Level 4 (5-6 GB data) | $45.47 | $45.47 | 0.00% |
| Level 5 (7-9 GB data) | $54.01 | $54.13 | -0.22% |
| Level 6 (10-19 GB data) | $55.42 | $62.77 | -11.70% |
| Level 7 (20-49 GB data) | $72.81 | $76.23 | -4.49% |
| Level 8 (50-99 GB data) | $101.74 | $121.06 | -15.96% |
| Broadband Service | |||
| Level 1 (3-9 Mbps) | $47.61 | $47.60 | 0.02% |
| Level 2 (10-15 Mbps) | $50.42 | $51.54 | -1.90% |
| Level 3 (16-40 Mbps) | $59.01 | $66.31 | -11.01% |
| Level 4 (41-100Mbps) | $75.38 | $77.98 | -3.37% |
| Level 5 (100-249 Mbps) | $91.50 | $95.00 | -3.68% |
| Level 6 (250-500 Mbps) | $96.97 | $98.08 | -1.14% |
| Level 7 (500+ Mbps) | $104.75 | $108.71 | -3.64% |
Wall Communications Inc. 2022
1.0 Introduction
This study provides a 2022 (data year collection) update of the previous annual telecommunications price comparison studies conducted since 2008.Footnote 5
The consumer telecom service categories covered in this study include the following categories:Footnote 6
- Mobile wireless telephony; and
- Fixed line broadband Internet.
A series of service baskets reflecting different service usage and feature levels was established for each service category in the first Study of 2008. Consistency in category characteristics over time is sought to the extent possible. However, key market changes may lead to some category revisions. Service category revisions and additions have occurred in past years and are noted where relevant. In short, these Studies attempt to balance maintaining consistent categories over time (to allow for inter-temporal comparisons) while recognizing that key technological and market changes should be reflected in the plan prices being tracked.
The objective of these studies is to capture what a new customer would need to pay for a chosen level – or target level within a basket range – of service. As such, the service range allows us to capture the non-uniform offerings of providers while still spanning the very wide variance in plans offered domestically and internationally. Moreover, this "consumer-centric" approach allows us to collect the lowest regular price available to a consumer for service within a well-defined series of ranges.
For Canada, the study provides a comparison of prices for each defined basket in each service category for the following cities: Halifax, Montreal, Toronto, Winnipeg, Regina and Vancouver. Service prices for Canada as a whole are derived as the weighted averages (according to provincial subscriber market share and population weights) of the prices measured for each of the six surveyed cities. For mobile wireless, the prices of national service providers (i.e. national MNOs), regional providers, Flanker brands and MVNOs are reported. For fixed broadband, prices from cable companies, telephone companies, Flankers and wholesale-based competitors (WBCs) are reported.
The study also measures prices for the same set of service category baskets for Australia, France, Germany, Italy, Japan, the United Kingdom (U.K.) and the United States (U.S.). As a result, the study covers all G7 countries along with Australia. Major service providers in each country are surveyed. Service basket prices in these seven foreign jurisdictions are compared with those measured for Canada.
There is only one addition to this year's Study, that being the addition of a Spotlight section on prices in the Canadian far northFootnote 7.
As was done in past Studies, MVNO pricing and comparisons to incumbent and Flanker pricing in Canada has been included. For fixed broadband, pricing from WBCs has been gathered and is compared to incumbent and Flanker brand pricing.
We note that the construction of price indices is not an exact science and there are multiple methodologies that can be employed. However, the general data collection and indexing methodology used in all the annual Canadian Telecom Pricing Studies has been adopted by other agencies around the world (including the OECD) and provides a proven and useful snapshot of the listed prices available to consumers for various levels of telecom services.Footnote 8
The basic methodological philosophy adopted in this Study is to identify what a consumer would have to pay for that consumer's chosen level of service. Since the number of service options available to a consumer can be extremely large, we group service levels (or service baskets) into ranges and then identify the lowest cost plan from a given provider within that service level range.
In terms of layout, the next section of this report, Section 2, provides a brief review of the methodology used to measure and compare service basket prices. The remaining two sections of the report, Sections 3 through 4, provide Canadian and international price comparison results for mobile wireless and fixed broadband Internet. A detailed summary of all service baskets and bundles included in the study is provided in Attachment 1. Historical domestic price levels for various services and baskets are provided in Attachment 2. International historical price series are provided in Attachment 3. A description of Far North baskets (examined in the Spotlight section) is provided in Attachment 4.
2.0 Metholodogy
2.1 Service basket design
As in previous studies, this study relies on the service basket-based price comparison methodology described in Wall Communications' 2008 methodology report.Footnote 9 Various modifications to the 2008 methodology have been made in successive studies primarily to reflect changes in service usage patterns or market characteristics over time.
The price comparison methodology used in this study is based on a "service basket" approach where separate telecom service baskets are defined on the basis of increasing "levels" of service usage, features and, where applicable, performance. A service basket typically has a range of plan characteristics or main elements designed to reflect an increasing quality (or value) of the plans within the basket. The number of defined service basket levels for each of the stand-alone telecom services considered in this study varies from seven to eight in total:
- Mobile Wireless: Basket Levels 1 to 8
- Broadband Internet Access: Basket Levels 1 to 7
Each of the service baskets has been designed to reflect, as applicable, a range of service volumes or levels, that are generally intended to capture a broad range of typical Canadian consumer usage levels, including mid-level or an "average" consumption basket for a typical Canadian consumer.
The specific service elements included in each service basket are described in the following sections and the associated service elements and usage assumptions in each case are also summarized in Attachment 1.
2.2 Canadian price data collection: Detailed methodology
The Canadian price data included in the study has been collected from a variety of telecom service providers (TSPs), including incumbent telephone companies (i.e., Bell Aliant, Bell Canada and TELUS) and incumbent cable companies (i.e., Eastlink, Videotron, Rogers, Access and Shaw). The primary Flanker brands of the incumbent service providers are examined, as well as "Fizz" (the Flanker brand of Videotron). Service prices from mobile wireless resellers Petro-Can and PC Mobile as well as wholesale-based competitors in fixed broadband (Distributel and Teksavvy) are also collected for the Study. In addition, mobile wireless services offered by regional wireless service providers Freedom, Eastlink, Videotron and SaskTel are also taken into account. In terms of geographic coverage, price data is collected for each of the following six Canadian cities: Halifax, Montreal, Toronto, Winnipeg, Regina and Vancouver. Table 1 provides a list of the surveyed Canadian service providers in this year's study broken out by city and by service basket.Footnote 10
| City | Service Baskets | Service Providers |
|---|---|---|
| Halifax | Fixed Broadband Internet | Bell Aliant, Eastlink, Teksavvy and Distributel/Primus |
| Mobile Wireless | Bell, TELUS, Rogers, Eastlink, Primus, PC Mobile, Petro-Can, Incumbent Flanker Brands | |
| Montreal | Fixed Broadband Internet | Bell, Videotron, Distributel/Primus, TekSavvy and Fizz |
| Mobile Wireless | Bell, TELUS, Rogers, Videotron, Primus, PC Mobile, Petro-Can, Incumbent Flanker Brands, Fizz | |
| Toronto | Fixed Broadband Internet | Bell, Rogers, Distributel/Primus, Teksavvy |
| Mobile Wireless | Bell, TELUS, Rogers, Primus, Freedom, Petro-Can, PC Mobile, Incumbent Flanker Brands | |
| Winnipeg | Fixed Broadband Internet | Bell, Shaw, TekSavvy |
| Mobile Wireless | Bell, TELUS, Rogers, Primus, PC Mobile, Petro-Can, Incumbent Flanker Brands | |
| Regina | Fixed Broadband Internet | SaskTel, Access Communications, TekSavvy, VMedia |
| Mobile Wireless | SaskTel, Bell, TELUS, Rogers, PC Mobile, Primus, Petro-Can, Incumbent Flanker Brands | |
| Vancouver | Fixed Broadband Internet | TELUS, Shaw, Distributel/Primus, TekSavvy |
| Mobile Wireless | Bell, TELUS, Rogers, Primus, Freedom, PC Mobile, Incumbent Flanker Brands |
Wall Communications Inc. 2022
City-specific prices for each of the stand-alone service baskets offered by the TSPs listed in Table 1 are determined using each service provider's respective estimated subscriber-based market share as weights.Footnote 11 In addition, to determine Canada-wide market prices, city-specific prices are aggregated using corresponding relative provincial population levels as weights. Weighted average prices for each surveyed city and for Canada are provided in Attachment 2 for each of the service baskets included in this study.
In addition, for the mobile wireless service baskets, services offered by the incumbents' Flanker brand services – i.e., Bell Virgin, Rogers Fido and TELUS Koodo – are also taken into account. The incumbents' Flanker brand service prices are included in the calculation of the above-noted city-specific and national aggregate prices.Footnote 12 In Section 3.2 below, the incumbents' Flanker brand prices are compared with incumbents' and regionals' mobile wireless prices as a separate analysis.
The price data collected for this study is drawn from the surveyed TSPs' websites and, where necessary, supplemented with further clarifications from customer service representatives (CSRs).Footnote 13 The price data reflects currently advertised prices that are generally available to new customers or existing customers changing service plans. The lowest available currently advertised price is used to determine the total price of each service basket. For this purpose, regular or "basic" prices are used – short-term promotional discounts available to new customers are not taken into account.Footnote 14
2.3 International price data collection: Detailed methodology
Seven foreign jurisdictions are included in the study: Australia, France, Germany, Italy, Japan, the U.K. and the U.S. With the exception of the U.S., in each case, price data was collected for the services available in each country's largest city. For the U.S., four cities of varying size distributed across that country were used – i.e., Boston, Kansas City, Minneapolis and Seattle. The service providers surveyed by country and, as applicable by city, are summarized in Table 2.Footnote 15
| City | Basket | Service Providers |
|---|---|---|
| United States | ||
| Boston, MA | Fixed Broadband Internet | Verizon, Comcast/Xfinity |
| Mobile Wireless | AT&T, Verizon, T-Mobile | |
| Kansas City, MO | Fixed Broadband Internet | AT&T, Time Warner |
| Mobile Wireless | AT&T, Verizon, T-Mobile | |
| Minneapolis, MN | Fixed Broadband Internet | CenturyLink, Comcast/Xfinity |
| Mobile Wireless | AT&T, Verizon, T-Mobile | |
| Seattle, WA | Fixed Broadband Internet | CenturyLink, Comcast/Xfinity |
| Mobile Wireless | AT&T, Verizon, T-Mobile | |
| United Kingdom | ||
| London | Fixed Broadband Internet | BT, Virgin, EE, Talk Talk |
| Mobile Wireless | EE, Virgin, Vodafone, O2, "3" | |
| Australia | ||
| Sydney | Fixed Broadband | Telstra and Optus |
| Mobile Wireless | Telstra, Optus, Vodafone | |
| France | ||
| Paris | Fixed Broadband Internet | Orange (France Telecom), SFR (Neuf Cegetel) |
| Mobile Wireless | Orange, SFR, Free, Bouygues Telecom | |
| Germany | ||
| Berlin | Fixed Broadband Internet | DT, KD/Vodafone |
| Mobile Wireless | DT, KD/Vodafone, Telefonica (E-plus, O2) | |
| Italy | ||
| Rome | Fixed Broadband Internet | Telecom Italia, FastWeb |
| Mobile Wireless | Telecom Italia (TIM), Vodafone, WIND, "3" | |
| Japan | ||
| Tokyo | Fixed Broadband Internet | NTT, J:Com, KDDI, Yahoo! BB |
| Mobile Wireless | NTT DoCoMo, Softbank, au KDDI, Y!Mobile | |
Wall Communications Inc. 2022
For international price comparison purposes, foreign currency prices have been converted to Canadian dollars using currency market exchange rates adjusted for purchasing power parity (PPP) differences between countries. For this study, the OECD's latest available PPP comparative price level indexes for 2022 were used for this purpose.Footnote 16
Canadian dollar-based price comparisons between Canada and other countries can be affected significantly by year-over-year currency exchange rate fluctuations. PPP-adjusted exchange rates take into account both changes in exchange rates and PPP adjustment factors between countries and, therefore, generally provide a more appropriate economic basis for comparing price levels between countries. For this reason, all of the international price comparison results shown in the main body of this report are based on PPP-adjusted exchange rate Canadian dollars.
It should be noted that fluctuations in both exchange rates and PPP adjustment factors could affect international price comparisons over time. This caveat is particularly relevant to inter-temporal comparisons given the significant changes in both exchange rates and PPP adjustment factors that can occur over time.
As well, it should also be noted that service prices in the U.K., France, Germany, Italy, Australia and Japan are typically quoted inclusive of retail value added taxes (VAT) or goods and services taxes (GST). Where appropriate, we have excluded applicable VAT or GST charges to improve cross-country comparisons of service prices.Footnote 17 On the other hand, where applicable, other industry-specific regulatory fees and surcharges are included for price comparison purposes (e.g., 9-1-1 fees, universal service fees and other regulatory fees).
Small rounding errors may occur on occasion in the Report but do not affect key Report findings. Reported percentages are accurate relative to the worksheet data.
3.0 Mobile wireless service
3.1 Mobile wireless service baskets
As in previous studies, the following mobile wireless service element charges, where applicable, are considered for price comparison purposes:
- Network access/airtime charges (taking into account defined amounts of daytime, evening and weekend minute volumes as appropriate);
- Service feature charges as appropriate (e.g., voice mail, call display and others);
- All mandatory fixed fees (e.g. system access, E911);
- SIM charges as appropriate;
- Short message service (SMS) or text message charges; and
- Data service charges.
As a general point, we note that several service elements have diminished in importance as service plan differentiators over the past ten years. These include distinctions in time of day or week minutes, optional features and long distance versus local minutes. On the other hand, data allotment has grown in prominence – in some cases being the key service characteristic that is marketed.
There are several notable charges or costs that are excluded from the calculation of mobile service prices in this study, including: certain one-time charges (such as waiveable activation fees) and roaming charges. Device or handset costs are also excluded.
Eight mobile wireless service baskets are included in the study. Each basket consists of the following main elements:
- Level 1: 450 voice minutes and 300 SMS (texts) at a minimum but typically lowest T&T plans are unlimited and those are included;
- Level 2: 1 GB of data usage per month (no talk or text);
- Level 3: unlimited nationwide talk and text along with 2-4 GB of data;
- Level 4: unlimited nationwide talk and text along with 5-6 GB of data;
- Level 5: unlimited nationwide talk and text along with 7-9 GB of data;
- Level 6: unlimited nationwide talk and text along with 10-19 GB of data;
- Level 7: unlimited nationwide talk and text along with 20-49 GB of data; and
- Level 8: unlimited nationwide talk and text along with 50-99 GB of data.
Attachment 1 provides a more detailed summary of each of the service elements and usage assumptions included in all eight mobile wireless service baskets.
Prices are measured for each of the mobile wireless service baskets based on a TSP's standard mobile service plan rates. Where applicable, both "pre-paid" and "post-paid" service options are considered. The less expensive of the two options is used to determine the service basket price.
3.2 Canadian mobile wireless prices
Figure 1 provides a summary of 2022 Canadian prices for all eight mobile wireless service baskets. Weighted average prices range from $26.19 per month for a Level 1 plan to $101.74 per month for a Level 8 Canada-wide unlimited talk and text plan with 50-99 GB of data. Level 2 (1GB of data standalone) is offered by very few providers (i.e. nationally by one provider and in one province by a regional provider), unlike the situation a few years ago. Therefore, the average price of $28.14 should be viewed with that in mind.
Figure 1: 2022 Average Canadian Mobile Wireless Prices by Service Basket

Wall Communications Inc. 2022
Relative to 2021, the average unweighted decrease in prices across all baskets was 2.6%. The revamping of service basket definitions in 2020 makes direct comparisons with most pre-2020 baskets inappropriate. Historical data can be found in the Attachments, with the caveat that basket definitions have changed over time.
Chart prices are rounded to the nearest dollar.
-
The Level 1 mobile wireless service basket price was $26.19. Average 2022 Level 1 prices varied by city, from a low of $25.42 in Vancouver to a high of $31.54 in Regina. As such, average prices were very uniform across the country, with the exception of Saskatchewan.
Canadian Wireless Level 1

Wall Communications Inc. 2022
-
The Level 2 average Canadian price was $28.14 – as the basket is defined, this is essentially the cost of purchasing 1 GB of stand-alone data on a mobile wireless smartphone plan. Unlike a few years ago, very few providers currently have a stand-alone 1 GB plan. Only Virgin offers this service across the country and only one regional provider (SaskTel) offers this type of plan.
Canadian Wireless Level 2

Wall Communications Inc. 2022
-
The Level 3 service basket average price was $39.15. Again, prices across the country were very uniform, with a low of $38.90 in Toronto to a high of $39.87 and $39.89 in Halifax and Regina respectively.
Canadian Wireless Level 3

Wall Communications Inc. 2022
-
The Level 4 service basket prices were consistent across the country, except for Regina with a price of $58.10 relative to all other regions where prices varied from a low of $43.56 in Montreal to a high of $46.25 in Halifax. The average price was $45.47, the same as last year's average price.
Canadian Wireless Level 4

Wall Communications Inc. 2022
-
Level 5 prices varied from $51.43 in Montreal to $56.76 in Regina. The national average price was $54.01, similar to the $54.13 of 2021.
Canadian Wireless Level 5

Wall Communications Inc. 2022
-
Level 6 prices were again fairly consistent across the country (with the exception of Saskatchewan), with the highest price of $70.99 in Regina while the lowest price of $49.48 was found in Montreal. The average national price was down from $62.77 in 2021 to $55.42 in 2022.
Canadian Wireless Level 6

Wall Communications Inc. 2022
-
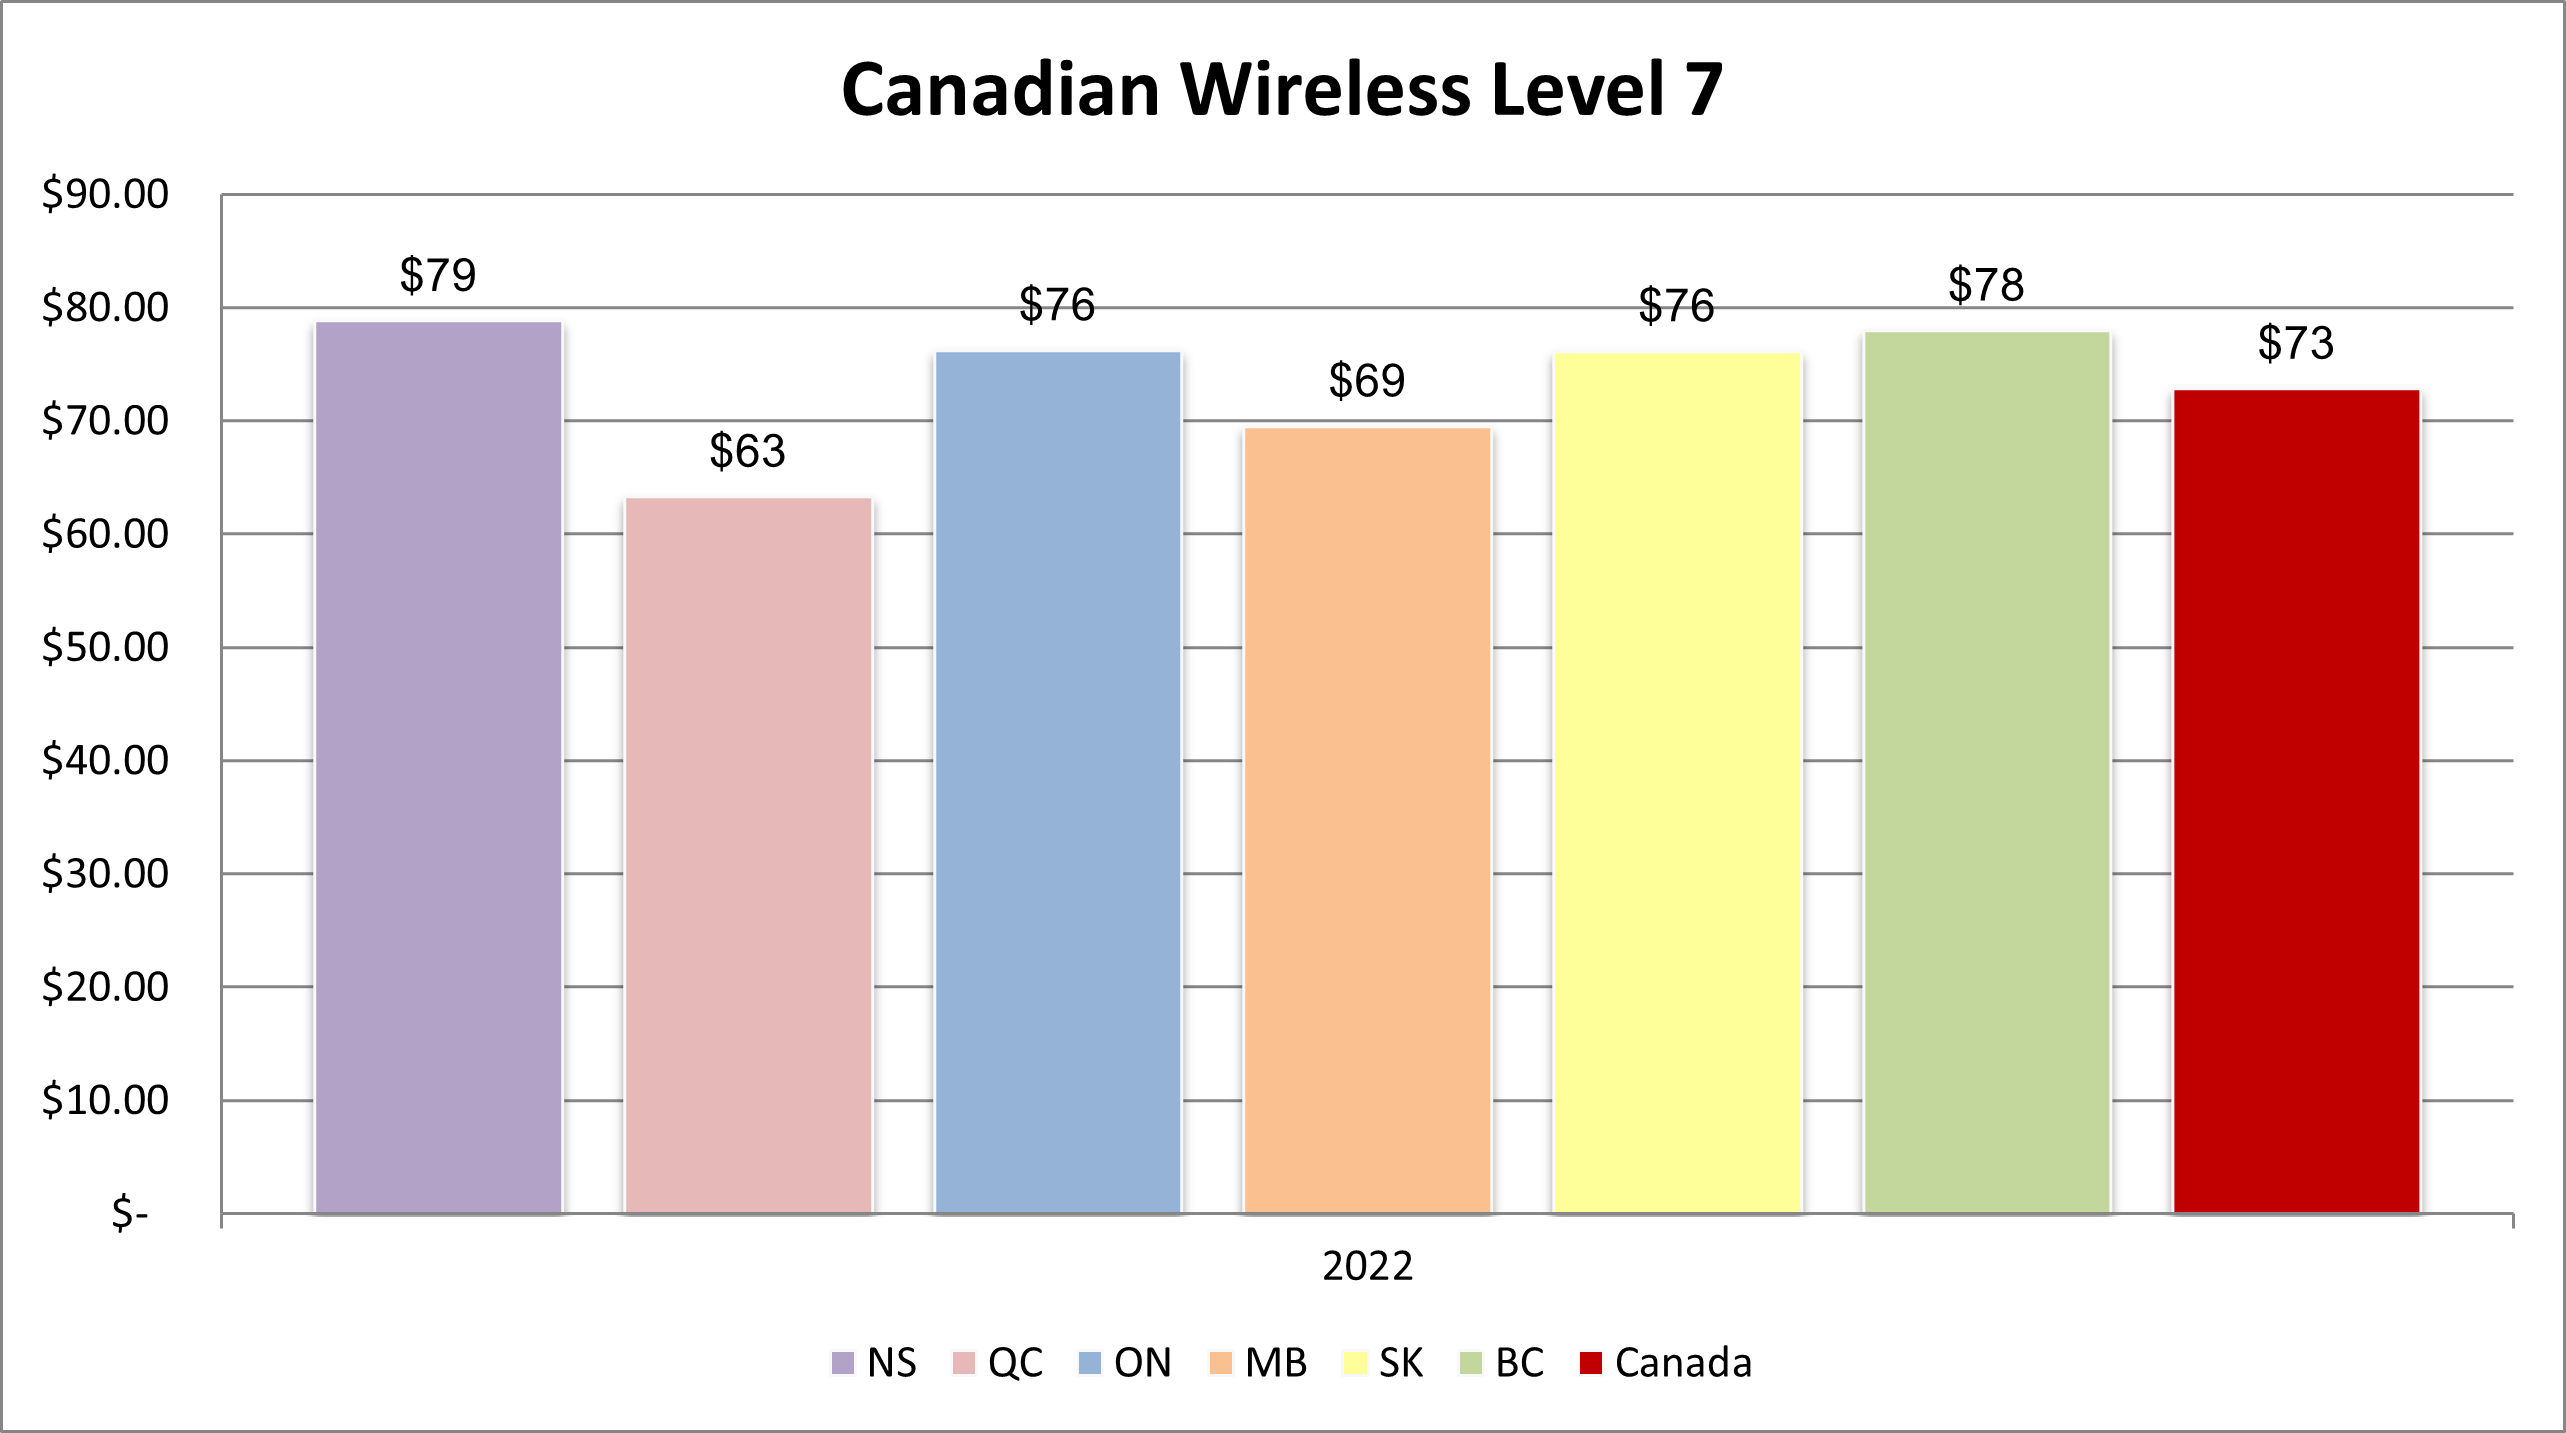
Level 7 prices were lowest in Montreal ($63.27) versus a high of $78.79 in Halifax. The average Canadian price was $72.81.
Canadian Wireless Level 7
Wall Communications Inc. 2022
-
Level 8 prices averaged $101.74 considerably lower than the 2021 average price of $121.06, with a low of $93.23 in Winnipeg and a high of $112.98 in Vancouver.
Canadian Wireless Level 8

Wall Communications Inc. 2022
The general trend of falling mobile wireless prices continued in 2022 for mid to higher level baskets. Prices fell an (unweighted) average of 2.6% this year across all baskets. By comparison, average (unweighted) prices across all baskets fell just over 17% last year. The lowest (or near lowest) average regional mobile wireless prices were found in Quebec for the five mid to higher-level (L4 – L8) service baskets. For lower-level baskets (L1 – L3), no one region consistently exhibited the lowest price. There was no region that consistently had higher prices than other regions, although Saskatchewan appeared in the upper bracket most often.
Comparison of incumbent and regional providers prices
A comparison of average mobile wireless rates for the incumbent carriers and the regional carriers is provided in Table 3 below. The comparison is provided for five cities: Vancouver and Toronto (where Freedom operates), Montreal (where Videotron operates), Regina (SaskTel) and Halifax (where Eastlink operates). For each of the cities, the incumbent carriers include Rogers, Bell and TELUS. Incumbent Flankers are not included.
| - | NS | QC | ON | MB | SK | BC | Canada |
|---|---|---|---|---|---|---|---|
| Level 1 | |||||||
| Incumbents | $25.71 | $25.74 | $25.28 | $25.28 | $27.23 | $25.14 | $25.73 |
| Regionals | $32.51 | $30.22 | $26.88 | N/A | $34.03 | $26.88 | $30.10 |
| Difference R/I | 26.45% | 17.40% | 6.33% | N/A | 24.97% | 6.92% | 17.00% |
| Level 2 | |||||||
| Incumbents | N/A | N/A | N/A | N/A | N/A | N/A | N/A |
| Regionals | N/A | N/A | N/A | N/A | $19.03 | N/A | $19.03 |
| Difference R/I | N/A | N/A | N/A | N/A | N/A | N/A | N/A |
| Level 3 | |||||||
| Incumbents | $40.57 | $40.74 | $40.28 | $40.28 | $42.23 | $40.28 | $40.73 |
| Regionals | $42.51 | $32.09 | $31.88 | N/A | $39.03 | $31.88 | $35.48 |
| Difference R/I | 4.79% | -21.23% | -20.85% | N/A | -7.58% | -20.85% | -12.89% |
| Level 4 | |||||||
| Incumbents | $45.95 | $45.74 | $45.42 | $45.42 | $47.37 | $45.42 | $45.89 |
| Regionals | $47.51 | $41.72 | N/A | N/A | $64.03 | N/A | $51.09 |
| Difference R/I | 3.39% | -8.80% | N/A | N/A | 35.17% | N/A | 11.33% |
| Level 5 | |||||||
| Incumbents | $55.71 | $55.74 | $55.28 | $55.28 | $57.23 | $55.28 | $55.75 |
| Regionals | N/A | N/A | N/A | N/A | N/A | N/A | N/A |
| Difference R/I | N/A | N/A | N/A | N/A | N/A | N/A | N/A |
| Level 6 | |||||||
| Incumbents | N/A | N/A | N/A | N/A | N/A | N/A | N/A |
| Regionals | $57.51 | $49.22 | $41.88 | N/A | $74.03 | $41.88 | $52.90 |
| Difference R/I | N/A | N/A | N/A | N/A | N/A | N/A | N/A |
| Level 7 | |||||||
| Incumbents | $85.71 | $65.74 | $85.28 | $73.61 | $77.23 | $83.47 | $78.51 |
| Regionals | $67.51 | $56.72 | $51.88 | N/A | $79.03 | $51.88 | $61.40 |
| Difference R/I | -21.23% | -13.73% | -39.17% | N/A | 2.33% | -37.85% | -21.79% |
| Level 8 | |||||||
| Incumbents | $102.24 | $97.27 | $101.81 | $91.95 | $93.90 | $111.81 | $99.83 |
| Regionals | $77.51 | $71.72 | $96.88 | N/A | $112.91 | $96.88 | $91.18 |
| Difference R/I | -24.19% | -26.27% | -4.84% | N/A | 20.25% | -13.35% | -8.66% |
Unweighted averages used for incumbents and regionals within a region. Unweighted prices can vary significantly from the weighted prices used in calculating national averages but can be suitable for comparing incumbents and regionals within a region. National averages use population weighting.
Wall Communications Inc. 2022
We note that providers do not always offer a plan within a given basket range and, as such, the comparisons between provider categories should be interpreted with that in mind. For example, no incumbent offers a plan in the L6 basket and no regional provider offers a plan in the L5 range.
No incumbent offers an L2 (i.e. 1 GB of data with no calling or text) nor does any regional provider except for SaskTel. Regarding SaskTel, in 2022 they charge higher rates in five of six baskets where they offer a service comparable to an incumbent offering.
As shown in Table 3, the prices offered by regional carriers are lower than incumbent prices when averaged across the country (with the exception of L1 and L4). Regionals prices were considerably higher (i.e. about 11%) than incumbents in L4 in large part due to the influence of the SaskTel price in this basket. Conditions do vary from province to province and from plan to plan. However, we note that regional prices in Ontario and BC are consistently lower than incumbent prices (with the exception of L1). We also note that regionals do not offer an L5 basket (while incumbents do) but regional providers offer an L6 basket (while incumbents do not) – yet the average regional price for an L6 basket is lower than the incumbent L5 average price.
Incumbent flanker brand prices
Incumbent Flanker brand services Bell Virgin, Rogers Fido, and TELUS Koodo are available across the country.Footnote 18
Table 4 below provides a summary of incumbent primary brand, incumbent Flanker brand and regional mobile wireless service prices for 2022 in Halifax, Montreal, Toronto, Winnipeg, Regina and Vancouver for each of the mobile wireless service baskets. It also provides percentage rate differentials between the incumbents' primary and Flanker brands as well as the incumbents' Flanker brands and the regionals.
In 2021, incumbent Flanker prices were uniformly lower than incumbent prices, varying from about 35% lower in L7 and L8 to 7% lower in L4. In 2022, Flankers are again uniformly lower than incumbent prices. On average, Flanker national average prices are 9.5% lower than incumbent national average prices (in regions where both incumbents and Flankers offer a plan). Price differentials are relatively uniform across regions with the exception of L4 to L7, particularly in Quebec. Quebec Flanker prices are considerably lower than incumbent prices in L4 to L6 (e.g. 43% lower in L5) in contrast to other regions. In L7 the incumbent prices are much closer to Flanker prices in Quebec than in any other region.
| - | NS | QC | ON | MB | SK | BC | Canada |
|---|---|---|---|---|---|---|---|
| Level 1 | |||||||
| Flankers | $26.70 | $26.22 | $25.08 | $25.08 | $26.37 | $24.77 | $25.70 |
| Incumbents | $25.71 | $25.74 | $25.28 | $25.28 | $27.23 | $25.14 | $25.73 |
| Regionals | $32.51 | $30.22 | $26.88 | N/A | $34.03 | $26.88 | $30.10 |
| Diff I/F | -3.70% | -1.82% | 0.80% | 0.80% | 3.27% | 1.50% | 0.11% |
| Diff Rg/F | 21.77% | 15.26% | 7.18% | N/A | 29.06% | 8.53% | 17.13% |
| Level 2 | |||||||
| Flankers | $28.85 | $28.88 | $28.42 | $28.42 | $30.37 | $28.42 | $28.89 |
| Incumbents | N/A | N/A | N/A | N/A | N/A | N/A | N/A |
| Regionals | N/A | N/A | N/A | N/A | $19.03 | N/A | $19.03 |
| Diff I/F | N/A | N/A | N/A | N/A | N/A | N/A | N/A |
| Diff Rg/F | N/A | N/A | N/A | N/A | -37.34% | N/A | -34.14% |
| Level 3 | |||||||
| Flankers | $36.30 | $35.79 | $36.01 | $36.01 | $37.30 | $36.47 | $36.31 |
| Incumbents | $40.57 | $40.74 | $40.28 | $40.28 | $42.23 | $40.28 | $40.73 |
| Regionals | $42.51 | $32.09 | $31.88 | N/A | $39.03 | $31.88 | $35.48 |
| Diff I/F | 11.77% | 13.84% | 11.86% | 11.86% | 13.23% | 10.44% | 12.17% |
| Diff Rg/F | 17.12% | -10.33% | -11.46% | N/A | 4.65% | -12.59% | -2.29% |
| Level 4 | |||||||
| Flankers | $43.38 | $37.90 | $43.09 | $43.09 | $44.38 | $43.06 | $42.48 |
| Incumbents | $45.95 | $45.74 | $45.42 | $45.42 | $47.37 | $45.42 | $45.89 |
| Regionals | $47.51 | $41.72 | N/A | N/A | $64.03 | N/A | $51.09 |
| Diff I/F | 5.93% | 20.68% | 5.40% | 5.40% | 6.74% | 5.49% | 8.01% |
| Diff Rg/F | 9.52% | 10.06% | N/A | N/A | 44.28% | N/A | 20.25% |
| Level 5 | |||||||
| Flankers | $55.85 | $38.97 | $52.50 | $55.42 | $54.77 | $52.71 | $51.70 |
| Incumbents | $55.71 | $55.74 | $55.28 | $55.28 | $57.23 | $55.28 | $55.75 |
| Regionals | N/A | N/A | N/A | N/A | N/A | N/A | N/A |
| Diff I/F | -0.25% | 43.05% | 5.30% | -0.25% | 4.50% | 4.88% | 7.84% |
| Diff Rg/F | N/A | N/A | N/A | N/A | N/A | N/A | N/A |
| Level 6 | |||||||
| Flankers | $53.38 | $46.40 | $56.43 | $53.09 | $52.71 | $51.39 | $52.23 |
| Incumbents | N/A | N/A | N/A | N/A | N/A | N/A | N/A |
| Regionals | $57.51 | $49.22 | $41.88 | N/A | $74.03 | $41.88 | $52.90 |
| Diff I/F | N/A | N/A | N/A | N/A | N/A | N/A | N/A |
| Diff Rg/F | 7.74% | 6.07% | -25.78% | N/A | 40.44% | -18.51% | 1.28% |
| Level 7 | |||||||
| Flankers | $64.80 | $63.40 | $63.25 | $63.17 | $63.82 | $64.67 | $63.85 |
| Incumbents | $85.71 | $65.74 | $85.28 | $73.61 | $77.23 | $83.47 | $78.51 |
| Regionals | $67.51 | $56.72 | $51.88 | N/A | $79.03 | $51.88 | $61.40 |
| Diff I/F | 32.27% | 3.69% | 34.84% | 16.54% | 21.02% | 29.08% | 22.96% |
| Diff Rg/F | 4.19% | -10.54% | -17.97% | N/A | 23.84% | -19.77% | -3.83% |
| Level 8 | |||||||
| Flankers | N/A | N/A | N/A | N/A | N/A | $111.81 | N/A |
| Incumbents | $102.24 | $97.27 | $101.81 | $91.95 | $93.90 | $111.81 | $99.83 |
| Regionals | $77.51 | $71.72 | $96.88 | N/A | $112.91 | $96.88 | $91.18 |
| Diff I/F | N/A | N/A | N/A | N/A | N/A | 0.00% | N/A |
| Diff Rg/F | N/A | N/A | N/A | N/A | N/A | -13.35% | N/A |
Table 4 also includes the regionals' average prices for the same cities and provides percentage-based price differentials between the regionals' and incumbents' Flanker brand prices. The regionals' prices are generally lower than the incumbents' Flanker brand prices in Ontario and BC but higher in the other region (with Quebec showing mixed results). The relationship between Flanker prices and regional operator prices varies widely across regions and basket levels with no clear pattern, other than as mentioned above.
Non-affiliated MVNO prices
Mobile wireless service prices offered by three non-affiliated mobile virtual network operators (MVNOs) – i.e., Primus, PC Mobile and Petro-Can – were also collected. Table 5 provides a summary of the national-level price differentials between the incumbents' primary brands and MVNOs for each of the mobile service baskets. MVNOs offer lower prices (often substantially lower) than incumbents in every basket where they compete. We note that MVNOs do not offer higher level baskets (L7 and L8) although this year an L6 plan was offered.
| - | NS | QC | ON | MB | SK | BC | Canada |
|---|---|---|---|---|---|---|---|
| Level 1 | |||||||
| Incumbents | $25.71 | $25.74 | $25.28 | $25.28 | $27.23 | $25.14 | $25.73 |
| MVNOs | $23.89 | $23.90 | $23.75 | $23.75 | $24.40 | $23.75 | $23.91 |
| Difference | -7.07% | -7.14% | -6.05% | -6.05% | -10.39% | -5.53% | -7.08% |
| Level 2 | |||||||
| Incumbents | N/A | N/A | N/A | N/A | N/A | N/A | N/A |
| MVNOs | $26.25 | $26.25 | $26.25 | $26.25 | $26.25 | $26.25 | $26.25 |
| Difference | N/A | N/A | N/A | N/A | N/A | N/A | N/A |
| Level 3 | |||||||
| Incumbents | $40.57 | $40.74 | $40.28 | $40.28 | $42.23 | $40.28 | $40.73 |
| MVNOs | $35.56 | $35.57 | $35.42 | $35.42 | $36.07 | $35.42 | $35.57 |
| Difference | -12.34% | -12.69% | -12.07% | -12.07% | -14.59% | -12.07% | -12.66% |
| Level 4 | |||||||
| Incumbents | $45.95 | $45.74 | $45.42 | $45.42 | $47.37 | $45.42 | $45.89 |
| MVNOs | $42.23 | $42.24 | $42.08 | $42.08 | $42.73 | $42.08 | $42.24 |
| Difference | -8.11% | -7.66% | -7.35% | -7.35% | -9.79% | -7.35% | -7.95% |
| Level 5 | |||||||
| Incumbents | $55.71 | $55.74 | $55.28 | $55.28 | $57.23 | $55.28 | $55.75 |
| MVNOs | $48.34 | $48.36 | $48.13 | $48.13 | $49.10 | $48.13 | $48.36 |
| Difference | -13.23% | -13.25% | -12.94% | -12.94% | -14.21% | -12.94% | -13.26% |
| Level 6 | |||||||
| Incumbents | N/A | N/A | N/A | N/A | N/A | N/A | N/A |
| MVNOs | $50.00 | $50.00 | $50.00 | $50.00 | $50.00 | $50.00 | $50.00 |
| Difference | N/A | N/A | N/A | N/A | N/A | N/A | N/A |
| Level 7 | |||||||
| Incumbents | $85.71 | $65.74 | $85.28 | $73.61 | $77.23 | $83.47 | $78.51 |
| MVNOs | N/A | N/A | N/A | N/A | N/A | N/A | N/A |
| Difference | N/A | N/A | N/A | N/A | N/A | N/A | N/A |
| Level 8 | |||||||
| Incumbents | $102.24 | $97.27 | $101.81 | $91.95 | $93.90 | $111.81 | $99.83 |
| MVNOs | N/A | N/A | N/A | N/A | N/A | N/A | N/A |
| Difference | N/A | N/A | N/A | N/A | N/A | N/A | N/A |
Wall Communications Inc. 2022
Finally, we note that MVNO prices tend to be highly uniform across the country, more so than incumbent prices.
High and low prices
For Canada, the highest and lowest prices (offered by specific providers) are provided in Table 6 below. We would note that PC Mobile (2), Lucky (2) and Fizz Mobile (2) had the lowest (or equal to lowest) price offering in six of the eight baskets. These three providers are an MVNO, a Flanker and a regional Flanker. An incumbent (or incumbents) had the highest price in three of the four highest levels (i.e. L5 to L8).
| Baskets | - | Canada Low |
Canada High |
Canada Average |
|---|---|---|---|---|
| 1) Talk and Text | Price | $20.00 | $34.03 | $26.19 |
| WSP | PC Mobile | SaskTel (SK) | - | |
| 2) 1 GB, data only | Price | $19.03 | $30.37 | $28.14 |
| WSP | SaskTel (SK) | Virgin (SK) | - | |
| 3) 2-4 GB data | Price | $30.00 | $42.51 | $39.15 |
| WSP | PC Mobile | Eastlink (NS) | - | |
| 4) 5-6 GB data | Price | $35.46 | $64.03 | $45.47 |
| WSP | Fido (QC) | SaskTel (SK) | - | |
| 5) 7-9 GB data | Price | $35.88 | $57.37 | $54.01 |
| WSP | Lucky (QC) | Bell, TELUS, Virgin (SK) | - | |
| 6) 10-19 GB data | Price | $40.88 | $77.50 | $55.42 |
| WSP | Lucky (QC) | Virgin (ON) | - | |
| 7) 20-49 GB data | Price | $46.09 | $85.85 | $72.81 |
| WSP | Fizz (QC) | Bell, TELUS (NS) | - | |
| 8) 50-99 GB data | Price | $51.09 | $125.00 | $101.74 |
| WSP | Fizz (QC) | TELUS (BC) | - |
Wall Communications Inc. 2022
We would note that an individual vendor price that is considerably lower than the national average can be found in all baskets and in most regions. The lowest individual plan price is found most often in Quebec while the highest price is found most often in Saskatchewan.
3.3 International mobile wireless service prices
As noted in previous studies, there are a number of important pricing differences that should be borne in mind when comparing Canadian and foreign mobile wireless prices.Footnote 19
- Price structure: The pricing of mobile wireless service plans in the U.K., Germany, Italy, France, Australia and Japan differs significantly compared to Canada (as well as the U.S.). Mobile wireless prices in Europe, Australia and Japan are set on a "calling party pays" basis, under which mobile customers pay only for outgoing calls. In contrast, Canadian and U.S. pricing plans are based on a "receiving party pays" approach, under which customers pay for incoming and outgoing calls. Unlike Canada and the U.S., some mobile wireless service plans in Europe, Australia and Japan also include per call setup charges and/or different per minute call rates to landline versus mobile customers, as well as potentially different per minute rates for on-net versus off-net mobile calls. However, as in Canada, unlimited national calling plans and service add-ons that cover calls to both fixed and mobile and both on and off-net mobile lines are now commonly available. In addition, several European vendors offer plans that include calling to other European countries at no additional charge.
- Regulatory fees: Regulatory fees of one form or another apply in the cases of Canada, Japan and the U.S. In Canada, there is typically an explicit emergency 9-1-1 fee and, in some cases, universal service fees (as in the case of Japan). In the U.S., there are a variety of regulatory fees, federal and state USF surcharges and other fees.Footnote 20 We have collected these, where applicable, updated USF fees and carrier-specific regulatory cost recovery charges.
The charts below provide a comparison of current mobile wireless prices for Canada and the surveyed foreign jurisdictions for each of the eight wireless service baskets. All prices are expressed in PPP-adjusted Canadian dollars and exclude retail sales taxes. Attachment 3 provides more detailed international mobile wireless price information for each country and basket. It should be noted that the resizing of baskets in 2020 makes historical comparisons with earlier years inappropriate.
As a few general observations, we note that Australia, France and Italy offer very few plans lower than L6. Australia in fact doesn't offer any in that range. The growing absence of lower-level plans from international providers is a trend we have noticed over the last few years. Canada and Japan are the only countries that have plans in every basket although Germany, the U.K. and the U.S. offer plans in 6 or 7 of the baskets.
We also note that Level 8 was redefined in 2021 as 50-99 GB (vs. 50 GB+ in 2020) and that definition has been carried over in 2022. There are numerous plans available internationally that offer 100 GB to unlimited data at various prices. These plans are tracked but are not included in the comparisons since they fall outside the specified range. In some cases, an international vendor's price for a 100 GB (or higher) plan is priced comparably (or even lower) than Canadian plans in the 50-99 GB range.
Additionally, we note that U.S. high-end plans are true unlimited plans and therefore fall outside the basket definition (i.e. 50-99 GB). There is therefore no L8 average price calculated for the U.S. although pricing data for higher end U.S. plans can be found in the data sheets.
Japan has the highest prices at all levels except L1. Japan, Canada and the U.S. consistently have higher prices than the other surveyed countries.Footnote 21
| - | Canada | U.S.A. | Australia | U.K. | France | Italy | Germany | Japan |
|---|---|---|---|---|---|---|---|---|
| Level 1 | $26.19 | $52.00 | n/a | n/a | $6.40 | $15.31 | $9.13 | $35.65 |
| Level 2 | $28.14 | n/a | n/a | n/a | n/a | n/a | n/a | $41.69 |
| Level 3 | $39.15 | $60.51 | n/a | $21.01 | n/a | n/a | $18.35 | $89.23 |
| Level 4 | $45.47 | $48.94 | n/a | $23.63 | $25.45 | n/a | $27.51 | $110.27 |
| Level 5 | $54.01 | $57.67 | n/a | $21.78 | n/a | n/a | $45.83 | $117.77 |
| Level 6 | $55.42 | $66.63 | $28.24 | $23.72 | $43.05 | n/a | $47.53 | $78.32 |
| Level 7 | $72.81 | n/a | $44.91 | $29.94 | n/a | n/a | $76.43 | $98.04 |
| Level 8 | $101.74 | n/a | $38.99 | $32.55 | $40.39 | $29.32 | $70.44 | $111.88 |
Wall Communications Inc. 2022
Individual basket level results are discussed below.Footnote 22
- In the case of the Level 1 mobile wireless service basket, the Canadian average price of $26.19 is surpassed by the U.S. at $52.00 and Japan at $35.65 but remains much higher than the lowest price of $6.40 (France). This basket uses a minimum of 450 talk minutes and 300 texts but most plans (Japan excepted) are offered with an unlimited number of talk minutes and texts for a flat price.
- In our view, this evolution in plans demonstrates the increasing relative importance of data allowances relative to talking (and texting). In fact, there are relatively few offerings of just talk and text – the vast majority of mobile wireless plans offered today include at least some data.
-
The price for the U.S. L1 plan (and all other U.S. plans) includes a relatively steep FCC USF component (set at 28.9% as of Q4, 2022).
International Wireless Level 1

Wall Communications Inc. 2022
-
For the Level 2 service basket – simply 1 GB of data – only two countries had L2 offers: Canada and Japan. The Japanese price of $41.69 is much higher than the Canadian price of $28.14.
International Wireless Level 2

Wall Communications Inc. 2022
-
Only 5 countries had vendors that offered a plan in this range, unchanged from last year. For the Level 3 wireless service basket, the average Canadian monthly rate of $39.15 is in the middle of surveyed countries, but is well below the highest price of $89.23 found in Japan and the $60.51 in the U.S. Notably, the Canadian price is also considerably higher than the prices in the U.K. and Germany ($21.01 and $18.35 respectively).
International Wireless Level 3

Wall Communications Inc. 2022
-
In the case of the Level 4 basket with 5-6 GB of monthly data allowance, the Canadian average price of $45.47 is slightly lower than the U.S. price and much lower than the average price in Japan. The Canadian price is higher than the prices found in the U.K., France and Germany.
International Wireless Level 4

Wall Communications Inc. 2022
-
The Level 5 price in Canada of $54.01 is higher than either the price in the U.K. or Germany but is well below the price in Japan. The Canadian average price is considerably above the lowest price of $21.78 found in the U.K.
International Wireless Level 5

Wall Communications Inc. 2022
-
The Level 6 price in Canada of $55.42 is lower than the prices in both the U.S. and Japan ($66.63 and $78.32 respectively) but again higher than the prices in the U.K. ($23.72), Australia ($28.24), France ($43.05) and Germany ($47.53).
International Wireless Level 6

Wall Communications Inc. 2022
-
The Level 7 (20 to 49 GB) price in Canada is $72.81, just slightly below the $76.43 price found in Germany and well below Japan ($98.04). The lowest prices are found in Australia ($44.91) and the U.K. ($29.94).
International Wireless Level 7

Wall Communications Inc. 2022
-
The Level 8 (50-99 GB) price in Canada is $101.74, less than the next highest price ($111.88 found in Japan). The prices in Australia, the U.K., France and Italy are considerably lower.
International Wireless Level 8

Wall Communications Inc. 2022
4.0 Fixed broadband internet service
4.1 Broadband internet service baskets
For the 2022 Study, we retain the seven broadband Internet service baskets, which are primarily defined on the basis of download speed:
- Level 1: speeds of 3-9 Mbps;
- Level 2: speeds of 10 to 15 Mbps;
- Level 3: speeds of 16 to 40 Mbps;
- Level 4: speeds of 41 to 100 Mbps;
- Level 5: speeds of 101 to 250 Mbps;
- Level 6: speeds of 251 to 500 Mbps; and
- Level 7: speeds greater than 500 Mbps.Footnote 23
- Level 1:
- Speed: Internet service with advertisedFootnote 24 download speed of up to 3 to 9 Mbps.
- Data usage per month: 10 GB.
- Level 2:
- Speed: Internet service with advertised download speed of 10 to 15 Mbps.
- Data usage per month: 50 GB.
- Level 3:
- Speed: Internet service with advertised download speed of 16 to 40 Mbps.
- Data usage per month: 100 GB.
- Level 4:
- Speed: Internet service with advertised download speed of 41 to 100 Mbps.
- Data usage per month: 150 GB.
- Level 5:
- Speed: Internet service with advertised download speed of 101 to 250 Mbps.
- Data usage per month: 500 GB
- Level 6:
- Speed: Internet service with advertised download speed of 251 to 500 Mbps.
- Data usage per month: 500 GB or higher (including Unlimited)
- Level 7:
- Speed: Internet service with advertised download speed of greater than 500 Mbps.
- Data usage per month: 500 GB or higher (including Unlimited)
It should be noted that broadband speeds have increased dramatically over the past decade and the baskets used in the Telecom Pricing Reports have accordingly been adjusted.
| Basket | 2010 | 2011 | 2012 – 2015 | 2016-2017 | 2018-2019 | 2020-2022 |
|---|---|---|---|---|---|---|
| Level 1 | < 1.5 Mbps | < 1.5 Mbps | < 3 Mbps | 3 – 9 Mbps | 3 – 9 Mbps | 3 – 9 Mbps |
| Level 2 | 2 – 9 Mbps | 2 – 9 Mbps | 4 – 15 Mbps | 10 – 15 Mbps | 10 – 15 Mbps | 10 – 15 Mbps |
| Level 3 | 10 – 19 Mbps | 10 – 19 Mbps | 16 – 40 Mbps | 16 – 40 Mbps | 16 – 40 Mbps | 16 – 40 Mbps |
| Level 4 | - | > 20 Mbps | > 40 Mbps | 41– 100 Mbps | 41- 100 Mbps | 41- 100 Mbps |
| Level 5 | - | - | - | > 100 Mbps | 101-250 Mbps | 101-250 Mbps |
| Level 6 | - | - | - | - | 251-500 Mbps | 251-500 Mbps |
| Level 7 | - | - | - | - | - | 500 Mbps> |
Wall Communications Inc. 2022
Modem rental fees are taken into account since they are mandatory in some instances. In other cases, where the modem is not included but must be purchased by the customer, the cost of the required equipment is amortized over 24 months. One-time installation or activation fees are generally not included unless they are clearly required by the provider.
Some Internet service providers (ISPs) apply monthly data usage caps to their broadband service plans. Where they are applied, they are typically set on the basis of a monthly data allowance (GB/month), with overage fees sometimes applied when the data allowance is exceeded. More recently, providers tend to reduce transmission speed once a data threshold has been reached. In virtually all cases, the applicable data caps were high enough that no overage fees are incurred given the data usage assumptions adopted for the defined broadband service baskets.
| - | L1 | L2 | L3 | L4 | L5 | L6 | L7 |
|---|---|---|---|---|---|---|---|
| Halifax | |||||||
| Bell | - | - | - | - | 150/150 | 500/500 | 1 G/940 |
| Eastlink | - | - | - | - | - | 350/10 | 1 G/15 |
| TekSavvy | 2/.6 | - | - | 100/10 | - | - | - |
| Montreal | |||||||
| Bell | - | - | 25/10 | 50/30 | 150/150 | 500/500 | 1G/ 750 |
| Videotron | - | - | 30/10 | 60/30 | - | 400/50 | - |
| Distributel | - | - | - | 60/10 | - | 400/50 | - |
| TekSavvy | 5/1 (200) | - | 25/10 | 50/30 | - | - | - |
| Fizz | - | 10/1.5 | 30/10 | 60/10 | 120/20 | - | - |
| Virgin | - | - | 25/10 | 50/10 | 120/120 | - | - |
| Toronto | |||||||
| Bell | - | 10/1 (100) | - | 50/10 | 150/150 | 500/500 | 1.5G/ 940 |
| Rogers | - | 10/1 (100) | - | 50/10 | 150/15 | 500/20 | 1G/30 |
| Distributel | 6/1 | - | - | 50/10 | - | 300/20 | 1G/30 |
| TekSavvy | 6/1 (200) | - | 30/5 | 75/10 | - | 300/20 | 1G/30 |
| Virgin | 5/1 | 15/10 | 25/10 | 50/10 | - | - | - |
| Fido | - | - | 30/5 | 75/15 | 150/15 | - | - |
| Winnipeg | |||||||
| Bell | - | 10/3 | - | 50/5 | - | 500/500 | 940/940 |
| Shaw | - | 10/1 (150) | 25/2.5 (250) | 75/ 7.5 | 150/10 | 500/50 | 1G/100 |
| TekSavvy | 5/.5 (400) | 10/1 | 30/5 | 60/6 | - | 500/100 | 1G/25 |
| VMedia | - | - | 25/2.5 | 75/7.5 | 150/10 | 300/15 | 750/100 |
| Regina | |||||||
| SaskTel | - | - | - | - | 150/75 | 300/80 | 1G/500 |
| Access | - | 10/2 | 25/3 | 100/7 | 200/15 | 300/20 | - |
| TekSavvy | 5/.5 (400) | 10/1 | 30/5 | - | - | - | - |
| VMedia | - | - | 25/2.5 | 75/7.5 | 150/10 | 300/100 | 1G/100 |
| Vancouver | |||||||
| TELUS | - | - | - | 75/10 | - | 300/30 | 940/940 |
| Shaw | - | 10/1 | 25/2.5 (250) | 75/ 7.5 (500) | 250/10 | 500/100 | 1G/100 |
| Distributel | 5/.5 | 15/.5 | 25/2.5 | 50/10 | 250/15 | - | - |
| TekSavvy | 5/.5 (400) | 15/1 | 30/5 | 60/6 | - | 500/100 | 1G/25 |
| Can. Mode | 5/1 | 10/1 | 25/10 | 50/ 10 | 150/15 | 500/500 | 1G/940 |
| Can. Ave. | 4.9/0.7 | 11.5/1.2 | 26.4/6.4 | 64.1/9.8 | 163.6/47.5 | 405.3/45.5 | 1008.1/347.8 |
Wall Communications Inc. 2022
4.2 Canadian broadband service prices
Figure 2 below provides a summary of Canadian weighted average broadband Internet access service prices for the Levels 1 to 7 service baskets for the period 2020 to 2022. More detailed historical broadband price information by city is provided in Table A2.2 in Attachment 2. Table 19 displays average regional broadband prices.
Figure 2: Average Canadian Broadband Internet Prices by Service Basket (2020-2022)

Wall Communications Inc. 2022
We note that fixed broadband average prices have decreased or increased just slightly in Canada in every basket between 2021 and 2022. In contrast, between 2020 and 2021 every basket had a price increase. Prices generally declined between 1% and 4% for each basket (except for L3 where prices fell by 11% and L1 which essentially remained unchanged).
-
The Level 1 national average broadband price remained essentially constant at $47.61 in 2022 (vs. $47.60 in 2021). Average 2022 Level 1 prices varied from roughly $41 in Winnipeg to about $50 in Toronto. We note that Winnipeg has exhibited the lowest price over the last five years. Level 1 prices generally increased from 2008 to 2014 but had been falling gradually until 2020. In the three years since 2019 prices have increased by roughly 33% in total. As noted, our criterion for Level 1 has evolved over time such that the "quality" of the basket has also been improving as speeds have increased (see Table 9).
Canadian Broadband Level 1 (3-9 Mbps)

Wall Communications Inc. 2022
-
The 2022 Level 2 basket price decreased from $51.54 in 2021 to $50.42. Average 2022 Level 2 prices varied from a low of $46.23 in Montreal to $60 in Winnipeg.
Canadian Broadband Level 2 (10-15 Mbps)

Wall Communications Inc. 2022
-
The 2022 Level 3 national average price fell significantly from $66.31 in 2021 to $59.01 – a decrease of roughly 11%. Winnipeg had the highest price at $76.64 while prices between $57 and $59 were found all other regions.
Canadian Broadband Level 3 (16-40 Mbps)

Wall Communications Inc. 2022
-
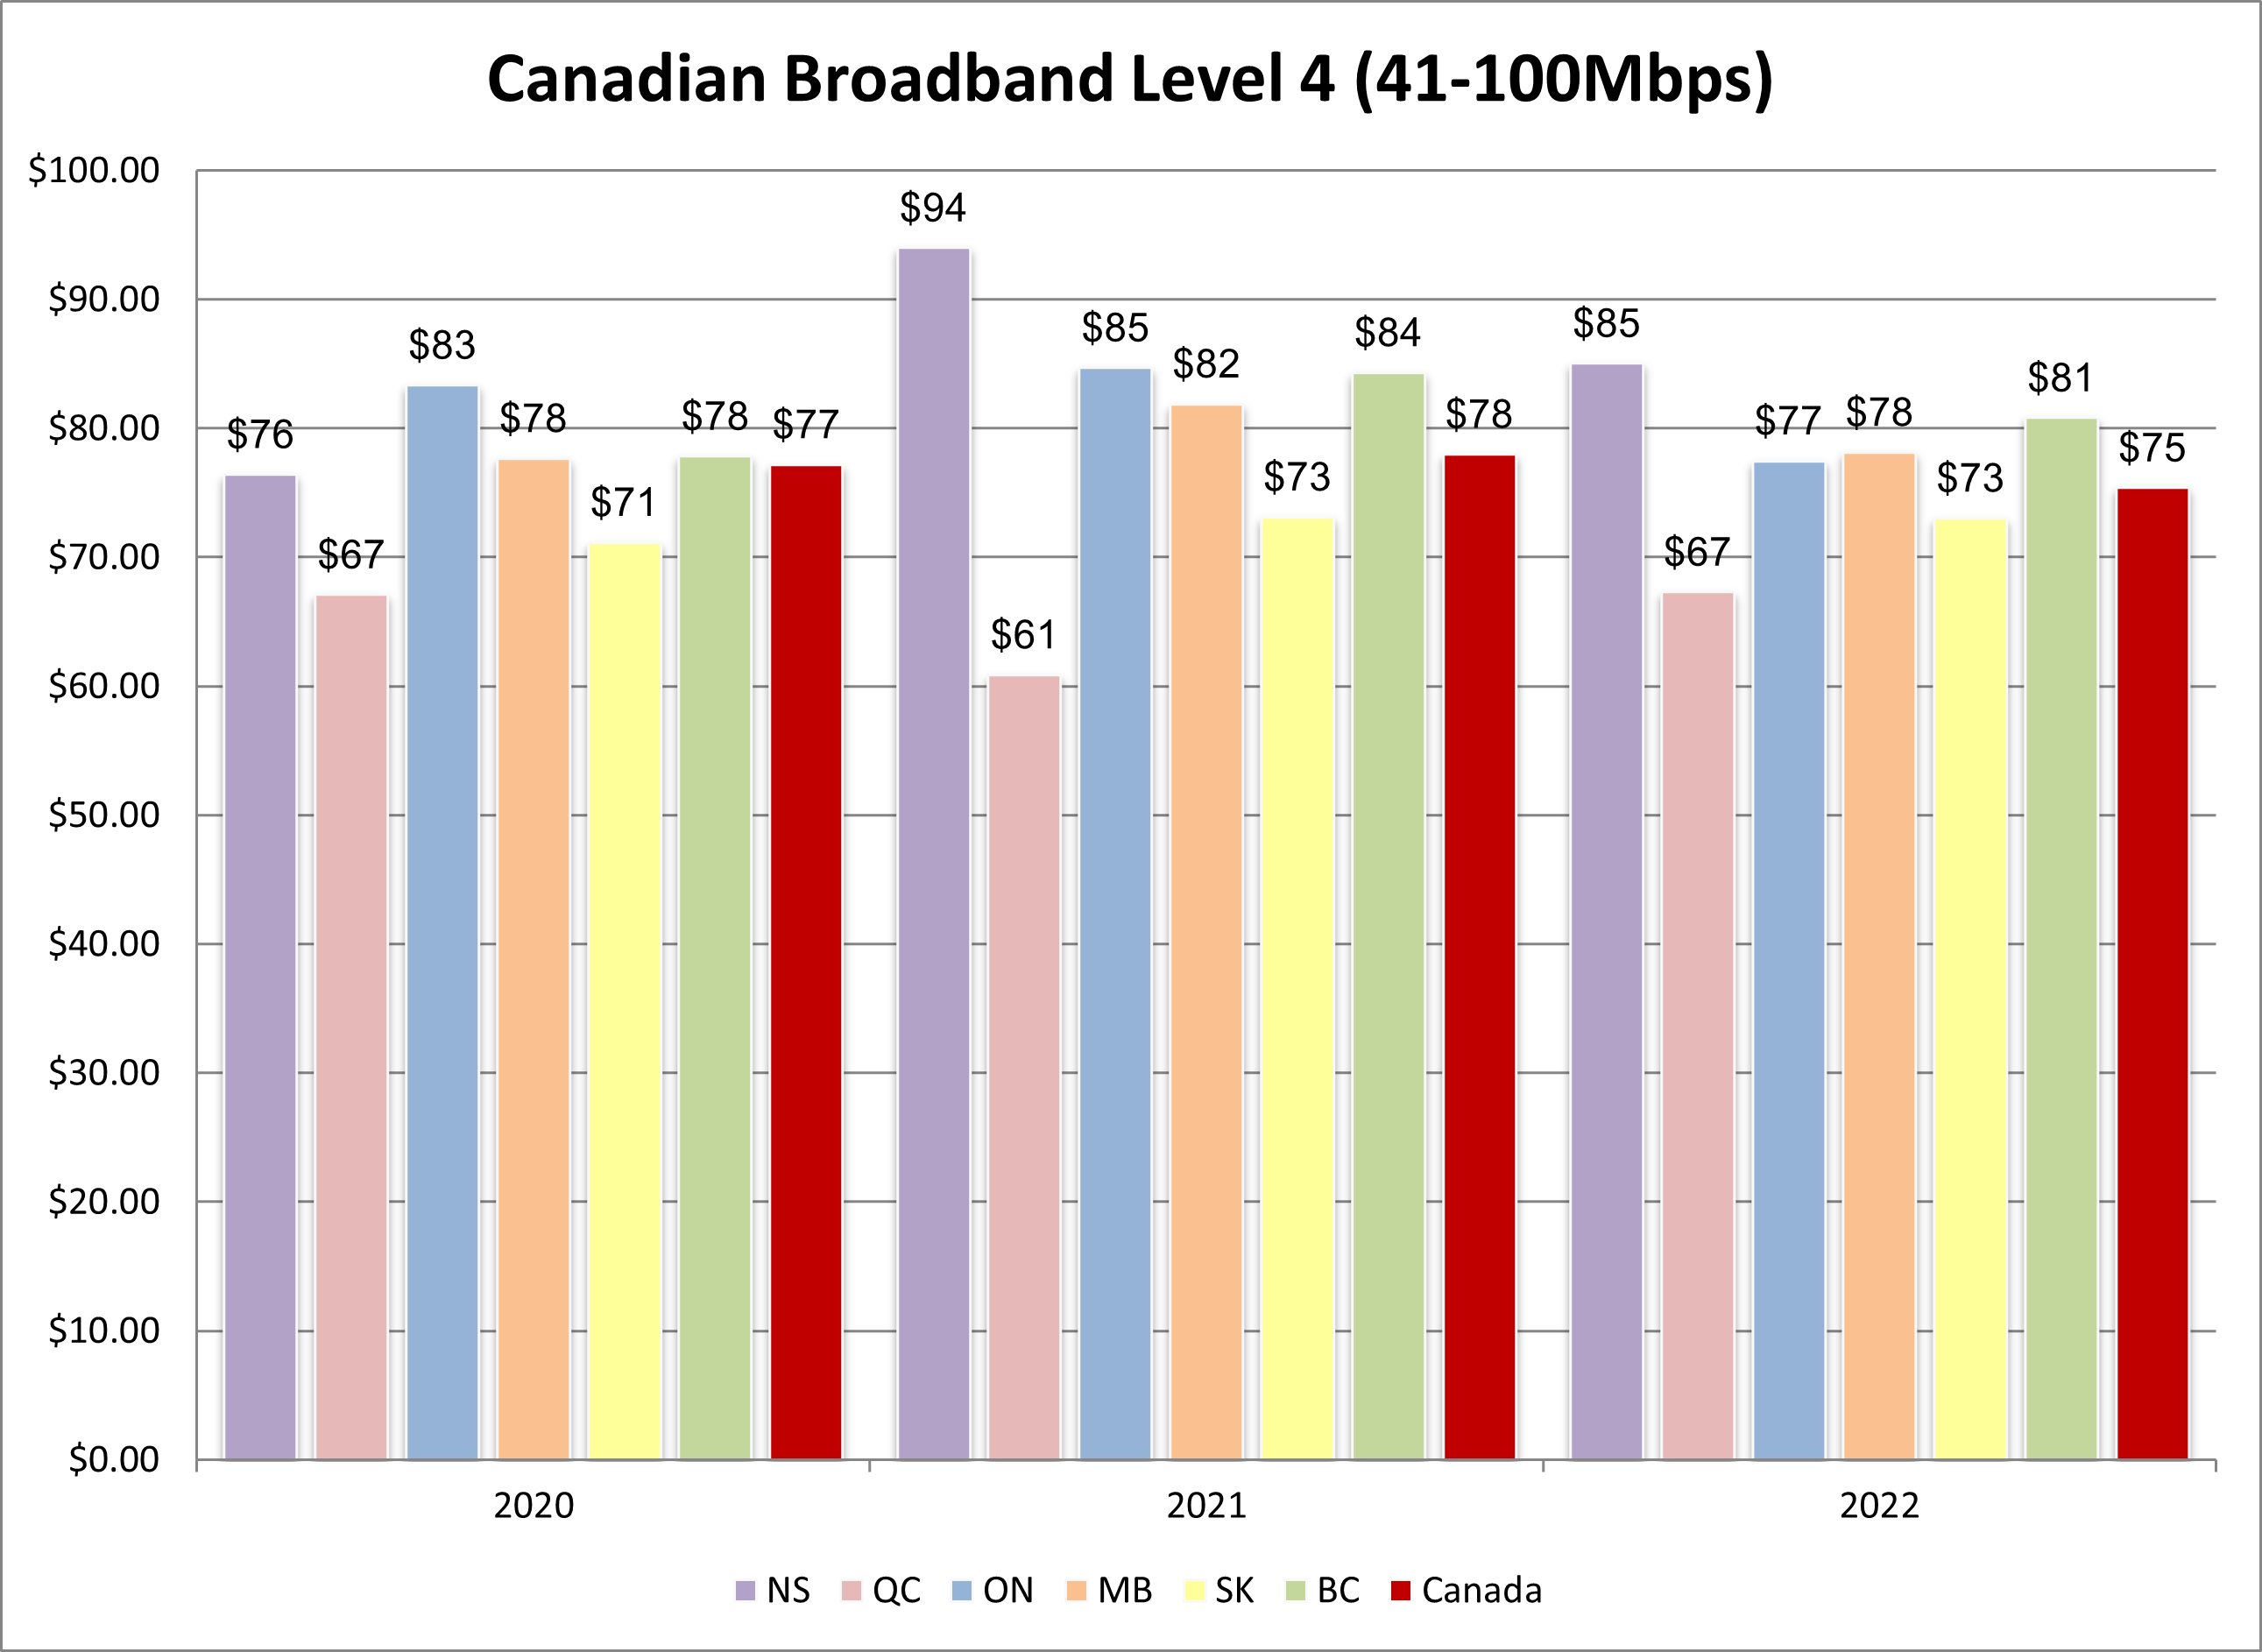
The Level 4 national price fell from $77.98 in 2021 to $75.38 in 2022. Average 2022 Level 4 prices varied from $67.29 in Montreal to $85.03 in Halifax.
Canadian Broadband Level 4 (41-100 Mbps)
Wall Communications Inc. 2022
-
The Level 5 national average price decreased from $95.00 in 2021 to $91.50 in 2022. Halifax had the highest price ($107.45) while the lowest price was found in Regina ($71.55).
Canadian Broadband Level 5 (101-250 Mbps)

Wall Communications Inc. 2022
-
Level 6 prices decreased marginally from $98.08 in 2021 to $96.97 in 2022. Prices varied from $79.65 (Montreal) to $113.86 (Halifax).
Canadian Broadband Level 6 (251-500 Mbps)

Wall Communications Inc. 2022
-
Level 7 – introduced in 2020 at 500 Mbps or greater – posted an average national price of $104.75 in 2022, down from $108.71 in 2021. The highest price was found in Halifax ($126.07) with the lowest price found in BC ($99.00).
Canadian Broadband Level 7 (500 Mbps+)

Wall Communications Inc. 2022
It is worth noting that Montreal had the lowest average prices in three of the eight baskets while Halifax had the highest prices in four baskets.
| - | NS | QC | ON | MB | SK | BC | Canada |
|---|---|---|---|---|---|---|---|
| Level 1 | $49.03 | $47.03 | $50.24 | $41.03 | n/a | $42.57 | $47.61 |
| Level 2 | n/a | $46.23 | $52.10 | $60.00 | $50.37 | $50.04 | $50.42 |
| Level 3 | n/a | $57.93 | $58.83 | $76.64 | $57.06 | $57.07 | $59.01 |
| Level 4 | $85.03 | $67.29 | $77.47 | $78.13 | $73.03 | $80.80 | $75.38 |
| Level 5 | $107.45 | $85.14 | $101.19 | $78.51 | $71.55 | $79.40 | $91.50 |
| Level 6 | $113.86 | $79.65 | $108.79 | $94.19 | $94.24 | $90.11 | $96.97 |
| Level 7 | $126.07 | $101.00 | $107.32 | $104.34 | $123.31 | $99.67 | $104.75 |
Wall Communications Inc. 2022
Price variations in the case of broadband services can be affected by differences in service speeds offered by ISPs. For the most part, the plans that are sampled have the same or very similar speeds associated with a given basket level.
Canadian broadband service plans also span a range of data caps. For Level 1, the lowest posted data cap was 200 GB (with a high of unlimited data). For Level 2, data caps ranged from 100 GB to unlimited GB. For Level 3 caps varied from 250 GB to unlimited. For Level 4, the lowest data cap was 500 GB but higher caps and unlimited are prevalent. Levels 5, 6 and 7 data caps are unlimited. Over time, data cap upper limits have been increasing steadily.
We would note that speeds of 100 Mbps or higher are common across the country – in contrast to even three years ago. We would also note that 1 Gbps service is now offered in several regions.
In contrast to mobile wireless prices, which have gravitated towards uniformity across the regions of Canada over the last few years, there is still considerable price variation in broadband prices from province to province. Quebec is most often the low-price setter among regions.
4.3 Fixed broadband – Incumbents, WBCs and flankers
While Flanker brands have been a fixture in the mobile wireless market for more than a decade, they are relatively new to the fixed broadband market. Currently Flankers operate in two provinces, Quebec and Ontario. Wholesale based competitors (WBCs) have been in operation for several years and operate in all regions of the country. One or the other – or both – Distributel and TekSavvy offer services across the country. As Distributel does not offer service (widely or otherwise) in Manitoba and Saskatchewan, we have surveyed the prices of VMedia (which operates in those regions).
| - | NS | QC | ON | MB | SK | BC | Canada |
|---|---|---|---|---|---|---|---|
| Level 1 | |||||||
| Incumbent | n/a | n/a | n/a | n/a | n/a | n/a | n/a |
| WBC | $49.03 | $47.03 | $50.24 | $41.03 | n/a | $42.57 | $45.98 |
| Dif WBC/In | n/a | n/a | n/a | n/a | n/a | n/a | n/a |
| Level 2 | |||||||
| Incumbent | n/a | n/a | $52.50 | $61.48 | $50.37 | $50.00 | $53.59 |
| WBC | n/a | $44.06 | $51.57 | $52.03 | n/a | $50.57 | $49.56 |
| Dif WBC/In | n/a | n/a | -1.76% | -15.36% | n/a | 1.14% | -7.52% |
| Level 3 | |||||||
| Incumbent | n/a | $59.00 | n/a | $80.00 | $59.54 | n/a | $66.18 |
| WBC | n/a | $51.38 | $57.07 | $65.03 | n/a | $57.07 | $57.64 |
| Dif WBC/In | n/a | -12.91% | n/a | -18.71% | n/a | n/a | -12.91% |
| Level 4 | |||||||
| Incumbent | n/a | $69.00 | $81.25 | $79.50 | $76.20 | $82.00 | $77.59 |
| WBC | $85.03 | $62.31 | $61.57 | $75.03 | n/a | $59.57 | $68.70 |
| Dif WBC/In | n/a | -9.70% | -24.22% | -5.62% | n/a | -27.35% | -11.46% |
| Level 5 | |||||||
| Incumbent | $107.45 | $86.00 | $102.50 | $79.00 | $80.58 | $79.00 | $89.09 |
| WBC | n/a | $72.23 | n/a | $76.03 | $76.03 | $89.90 | $81.06 |
| Dif WBC/In | n/a | -16.02 | n/a | n/a | n/a | 13.08% | -9.01% |
| Level 6 | |||||||
| Incumbent | $114.20 | $80.50 | $112.50 | $94.50 | $106.79 | $89.50 | $99.66 |
| WBC | n/a | $89.90 | $92.47 | $122.03 | n/a | $122.03 | $106.61 |
| Dif WBC/In | n/a | 11.68% | -17.81% | 29.13% | n/a | 36.35% | 6.97% |
| Level 7 | |||||||
| Incumbent | $126.20 | $101.00 | $107.50 | $104.50 | $124.95 | $99.00 | $110.52 |
| WBC | n/a | n/a | $104.52 | $132.03 | n/a | $132.03 | $122.86 |
| Dif WBC/In | n/a | n/a | -2.77% | 26.34% | n/a | 33.36% | 11.16% |
Wall Communications Inc. 2022
As was the case in past years, WBC prices generally tend to be lower than incumbent prices with the exception of the higher-level baskets. We note that there is still quite a bit of price variability across regions. As noted, and as was the case last year, incumbent average prices are lower than WBC average prices in the highest baskets (L6 and L7).
| - | QC (Virgin and Fizz) | ON (Virgin and Fido) |
|---|---|---|
| Level 1 | ||
| Incumbent | n/a | n/a |
| Flankers | n/a | n/a |
| Dif FL/In | n/a | n/a |
| Level 2 | ||
| Incumbent | n/a | $52.50 |
| Flankers | $39.00 (Fizz) | n/a |
| Dif FL/In | n/a | n/a |
| Level 3 | ||
| Incumbent | $60.00 | n/a |
| Flankers | $39.50 (Fizz=$39; Virgin=$40) | $65 (Virgin=$70; Fido=$60) |
| Dif FL/In | -34.2% | n/a |
| Level 4 | ||
| Incumbent | $78.00 | $81.25 |
| Flankers | $50.00 (Fizz/Virgin=$50) | $77.50 (Virgin=$80; Fido=$75) |
| Dif FL/In | -38.4% | -4.6% |
| Level 5 | ||
| Incumbent | $86.00 | $102.50 |
| Flankers | $53.00 (Fizz) | $85.00 (Fido) |
| Dif FL/In | n/a | -17.1% |
| Level 6 | ||
| Incumbent | $91.00 | $112.50 |
| Flankers | n/a | n/a |
| Dif FL/In | n/a | n/a |
| Level 7 | ||
| Incumbent | $101.00 | $107.50 |
| Flankers | n/a | n/a |
| Dif FL/In | n/a | n/a |
Wall Communications Inc. 2022
As noted, Flanker brand broadband service is only offered in Ontario and Quebec. In all cases where both the incumbent primary and secondary brands offer a service, the Flanker price is lower than the incumbent price with discounts ranging from about 5% to 38%. Flanker prices are lower than the WBC prices in Quebec, but not in Ontario. (We also note that incumbent prices are lower in Quebec than in Ontario in all cases where plan baskets match).
We note that there is one regional provider that also uses a Flanker brand: Fizz is the secondary brand of Videotron in Quebec. In every case where Virgin (the Bell Flanker) and Fizz both offer plans (L3 and L4), the Fizz plan is offered at a similar or exactly the same price. In two instances, Fizz offers plans (L2 and L5) where Virgin does not offer a plan.
No Flanker brand offers a plan in the upper two baskets (L6 and L7).
4.4 International fixed broadband service prices
As with the other service categories, there are a number of notable differences in the way in which broadband services are provisioned in some of the surveyed countries compared to Canada:
- In some of the surveyed European countries, to obtain a DSL broadband Internet service on a stand-alone basis, the customer must in some cases also lease a landline connection (which adds an additional access line charge).
- Fibre and/or DSL-based broadband services offered in the U.K., France, Germany and Italy generally include VoIP and/or IPTV services for a single bundled price. The option of a pure stand-alone broadband Internet service is not available in some cases.
- In Japan, broadband Internet service typically consists of two separate service elements: (i) a network access facility (fibre or ADSL), often obtained from NTT and (ii) an Internet access service provided by a third-party ISP. Therefore, there are two fees involved: the broadband access fee and ISP fee.
- In the U.S., U.K., Australia, France, Italy and Germany lower-level plans (L1, L2) are no longer offered – only Canada and Japan offer these plans.
Table 11 below provides a summary of the unweighted average "advertised" download and upload service speeds of the surveyed broadband services included in each of the seven specified broadband service baskets for Canada and the surveyed foreign jurisdictions.Footnote 25 Data caps are typically no longer listed in most countries (with the exception of Canada and Australia) – either because the vendor has chosen not to state the cap or (more likely) because the plans do not have data caps.
| - | L1 | L2 | L3 | L4 | L5 | L6 | L7 |
|---|---|---|---|---|---|---|---|
| Can. | 5 | 10 | 25 | 50 | 150 | 500 | 1 Gbps |
| US | NA | NA | NA | 100 | 200 | 300 | 1 Gbps |
| UK | NA | NA | 36 | 52 | 108/150 | 362/500 | 516/900 |
| AU | NA | NA | 25 | 50 | 250 | NA | NA |
| FR | NA | NA | 20/25 | NA | NA | 500 | 1/2 Gbps |
| JA | 8 | 12 | 40 | 100 | 200 | 350 | 1 Gbps |
| IT | NA | NA | NA | NA | NA | NA | 2.5 Gbps |
| GM | NA | NA | 16 | 50/100 | 250 | NA | 1 Gbps |
| Int. Mode | NA | NA | 25 | 50/100 | 200/250 | 500 | 1 Gbps |
Wall Communications Inc. 2022
| - | L1 | L2 | L3 | L4 | L5 | L6 | L7 |
|---|---|---|---|---|---|---|---|
| Can. | 4.9 | 11.5 | 26.4 | 64.1 | 163.6 | 405.3 | 1008.1 |
| US | NA | NA | NA | 100 | 200 | 383.33 | 850 |
| UK | NA | NA | 36 | 55.25 | 129 | 431 | 708 |
| AU | NA | NA | 25 | 50 | 250 | NA | NA |
| FR | NA | NA | 22.5 | NA | NA | 466.67 | 1500 |
| JA | 8 | 12 | 40 | 100 | 200 | 350 | 1000 |
| IT | NA | NA | NA | NA | NA | NA | 2000 |
| GRM | NA | NA | 16 | 75 | 250 | 500 | 1000 |
| Int. Av. (exc. Canada) | 6.45 | 11.75 | 27.65 | 74.06 | 198.77 | 422.72 | 1152.30 |
Wall Communications Inc. 2022
While past Studies have identified trends or relatively clear-cut international comparative conclusions, this year is more ambiguous. The offering of lower-level plans (i.e. L1 and L2) as of 2021 is limited to just Canada and Japan. At the higher end, almost every country now offers a 1 Gbps plan. We note that low-level service plans have limited availability in Japan (i.e. only a single or very few providers offer a low level service).
Findings for each of the seven broadband service baskets are described below.
-
Level 1 broadband services were only available from surveyed ISPs in two of the eight countries included in the study – Canada and Japan. Canada's average monthly price of $47.61 is lower than the measured average price for Japan ($77.76).
International Broadband Level 1 (3-9 Mbps)

Wall Communications Inc. 2022
-
In the case of the Level 2 basket, again only two countries provide this level of service (Canada and Japan). Canada's average monthly price of $50.42 is lower than Japan ($79.01).
International Broadband Level 2 (10-15 Mbps)

Wall Communications Inc. 2022
-
For the Level 3 basket, Canada's average monthly price of $59.01 is higher than all other countries except for Japan ($80.89) and Australia ($63.02).
International Broadband Level 3 (16-40 Mbps)

Wall Communications Inc. 2022
-
For the Level 4 basket, Canada's average monthly price of $75.38 is higher than all other countries with matching baskets. Prices in the U.K. and Germany are under the $50 mark.
International Broadband Level 4 (41-100 Mbps)

Wall Communications Inc. 2022
-
The average Canadian price for Level 5 broadband is $91.50, just slightly higher than Japan ($90.10) but considerably higher than all other countries except for Australia. Australia's price is $104.38.
International Broadband Level 5 (101-250 Mbps)

Wall Communications Inc. 2022
-
The Canadian Level 6 broadband price of $96.97 is highest among the surveyed countries. The lowest price of $40.76 is found in France.
International Broadband Level 6 (251-500 Mbps)

Wall Communications Inc. 2022
-
The average price for Level 7 in Canada is $104.64, higher than all other countries. France, Italy and Germany all have prices less than $60.
International Broadband Level 7 (500 Mbps+)

Wall Communications Inc. 2022
Canada's broadband service relative price ranking has remained fairly consistent since the study was first conducted in 2008. The measured prices for the European countries included in the study (U.K., France, Italy and Germany) have consistently been lower than those in Canada – in some cases, by a wide margin. U.S. average price, which has been similar or higher than Canada's price for many years prior to 2021, is consistently lower in 2022 for the four baskets where both countries offer a comparable service (i.e. L4 to L7)
Relative to last year, all countries (except for Japan) have lower prices than Canada in a majority of baskets. Relative to last year, Canadian prices have declined in every basket.
In sum, Canadian broadband Internet service prices compare well with Japan in lower level baskets (L1 to L3) but are higher or similar in higher level baskets (L4 to L7). As noted, most countries no longer provide lower-level service baskets. Regarding prices in Canada relative to countries other than Japan, Canada generally has higher average prices than all other countries.
5.0 Spotlight section on prices in the Canadian Far North
5.1 Introduction
The Spotlight Section for the 2022 version of the Telecom Pricing Report examines the provision and pricing of telecom services in the Canadian Far North. Specifically, mobile wireless and fixed internet prices are examined for three centers: Yellowknife (Northwest Territories), Whitehorse (the Yukon) and Iqaluit (Nunavut).
The provision of telecommunications services in the Canadian Far North has numerous challenges (such as very low population density and extreme weather conditions). As such, the number of providers is very limited.
Traditional fixed telephone service in the Far North was first provided by independent telcos (Yellowknife and Whitehorse), who were purchased in the late 1950's and early 1960's by the Canadian National Railway (operating as Canadian National Telegraph and later Canadian National Telecommunications). The company was renamed Northwestel (NWTel) in 1979. In 1988, Northwestel was sold to Bell Canada Enterprises but has continued to operate under the Northwestel brand name.
As the dominant incumbent telecom provider, NWTel has been regulated by the CRTC since its inception. Consequently, NWTel retail Internet rates are regulated, unlike the other providers surveyed in this Spotlight section.Footnote 26 Local competition was introduced in 2012 but it has been a slow process. The CRTC launched a proceeding in 2020 (Telecom Notice of Consultation 2020-367) to review telecom service provision in the Far North. Phase II of the process was initiated with Telecom Notice of Consultation 2022-147 to examine issues of affordability, reliability, and quality of retail telecommunications services; price cap regulation for NWTel; competition and wholesale services; and supporting reconciliation with Indigenous Peoples in the context of regulating telecommunications services in the Far North. A hearing for Phase II is scheduled on 17 April 2023 in Whitehorse, Yukon.
Mobile Wireless services are not provided by Northwestel, but Bell Mobility, a subsidiary of its parent company (BCE), does provide this service along with other MNO's Telus and Rogers in both Yellowknife and Whitehorse. Bell and Telus also provide service in Iqaluit.Footnote 27
The primary competitors to Northwestel for broadband Internet are Xplore (Whitehorse) and SSi Canada (Yellowknife and Iqaluit). Starlink has announced its intention to begin providing LEO service sometime in 2023, but no definitive start dates have been announced.
For mobile wireless, the MNOs compete with Ice Wireless (all three locations) and SSi Canada (Qiniq) in Iqaluit.
It is worth noting that all three Far North townships have very small populations and extreme weather conditions. The population of Whitehorse (2021 Census) is 28,201. The average annual temperature is -0.1 C with a daily mean temperature varying from 14.3 C (July) to -15.2 C (January). Whitehorse has little precipitation with an average annual snowfall of 141.8 cm (55.8 in) and 160.9 mm (6.33 in) of rainfall. The climate is considered "subarctic".
The population of Yellowknife (2021 Census) is 20,340. The daily mean temperature varies between 17 C (July) and -25.6 C (January). Yellowknife has an average annual snowfall of 157.6 cm (62.0 in) and 170.7 mm (6.72 in) of rainfall. The climate is considered "subarctic".
The population of Iqaluit (2021 Census) is 7,429. The daily mean temperature varies from 8.2 C (July) to -27.5 C (February). The climate is considered "tundra".
5.2 Price review – Mobile wireless
Plan prices for comparative baskets (L1 to L8 in mobile) are provided for each location below. A description of basket plans is provided in Attachment 4.1.
Table 15: Mobile Wireless Prices in the Far North 2022
| - | Bell | Telus | Rogers | Ice Wireless | Average |
|---|---|---|---|---|---|
| L1 | $40 | $40 | $32 | $25 | $34.25 |
| L2 | - | - | - | - | n/a |
| L3 | $40 | $40 | $40 | - | $40 |
| L4 | $45 | $45 | $45 | - | $45 |
| L5 | $55 | $55 | $55 | $49 | $53.50 |
| L6 | - | - | $65 | $59 | $62 |
| L7 | - | - | - | $69 | $69 |
| L8 | $85 | $85 | $85 | - | $85 |
| - | Bell | Telus | Rogers | Ice Wireless | SSi (Qiniq) | Average |
|---|---|---|---|---|---|---|
| L1 | $40 | $40 | - | $25 | $23.75 | $32.19 |
| L2 | - | - | - | - | - | n/a |
| L3 | $40 | $40 | - | - | - | $40 |
| L4 | $45 | $45 | - | - | - | $45 |
| L5 | $55 | $55 | - | $49 | - | $53 |
| L6 | - | - | - | $59 | $50 | $54.50 |
| L7 | - | - | - | $69 | $80 | $74.50 |
| L8 | $85 | $85 | - | - | - | $85 |
Wall Communications Inc. 2022
2022 Far North Average Wireless Prices by Service Basket

Wall Communications Inc. 2022
The prices of the three MNOs are generally similar for all baskets. We note that while all three MNOs publicize services for the Far North on their websites, only Bell Mobility seems to have a readily accessible Customer Service Representative available to communicate with prospective customers.
As noted, competition is extremely limited in the Far North. There is only one competitor to the MNOs in Whitehorse and Yellowknife and two competitors in Iqaluit. The market share of competitors to the MNOs appears to be relatively small.
5.3 Price review – Fixed broadband internet
Plan prices for comparative baskets (L1 to L7 in fixed internet) are provided for each location below. A description of basket plans is provided in Attachment 4.2.
Table 16: Fixed Internet Prices in the Far North 2022
| - | NWTel | Xplore | Average |
|---|---|---|---|
| L1 | $44.95 | - | $44.95 |
| L2 | $65.95 | $94.12 | $80.04 |
| L3 | $82.95 | - | $82.95 |
| L4 | $113.95 | - | $113.95 |
| L5 | $142.95 | - | $142.95 |
| L6 | - | - | - |
| L7 | - | - | - |
| - | NWTel | SSi Canada | Average |
|---|---|---|---|
| L1 | $44.95 | $55 | $49.98 |
| L2 | $65.95 | - | $65.95 |
| L3 | $82.95 | - | $82.95 |
| L4 | $113.95 | - | $113.95 |
| L5 | $192.95 | - | $192.95 |
| L6 | $222.95 | - | $222.95 |
| L7 | - | - | - |
| - | NWTel | Xplore | SSi (Qiniq) | Average |
|---|---|---|---|---|
| L1 | $66.50 | - | $80 | $73.25 |
| L2 | $86.50 | $94.12 | - | $90.31 |
| L3 | - | - | - | - |
| L4 | - | - | - | - |
| L5 | - | - | - | - |
| L6 | - | - | - | - |
| L7 | - | - | - | - |
Wall Communications Inc. 2022
2022 Far North Average Fixed Internet Prices by Service Basket

Wall Communications Inc. 2022
Only NWTel provides a comprehensive suite of Internet services in the Far North. Options for consumers are very limited. NWTel is the only provider that utilizes terrestrial transport facilities for its service; other providers typically used some type of fixed wireless technology and/or satellite. While no market share data is available, it appears that the vast amount of subscribers are served by NWTel.Footnote 28
5.4 Further observations
Mobile wireless
As can be seen in the Table and Chart below, mobile wireless rates in the Far North compare favorably to prices in the rest of Canada.
| - | Whitehorse and Yellowknife Average |
Iqaluit Average |
All Far North Average |
Rest of Canada Average |
|---|---|---|---|---|
| L1 | $34.25 | $32.19 | $33.22 | $26.19 |
| L2 | n/a | n/a | n/a | $28.14 |
| L3 | $40.00 | $40.00 | $40.00 | $39.15 |
| L4 | $45.00 | $45.00 | $45.00 | $45.47 |
| L5 | $53.50 | $53.00 | $53.25 | $54.01 |
| L6 | $62.00 | $54.50 | $58.25 | $55.42 |
| L7 | $69.00 | $74.50 | $71.75 | $72.81 |
| L8 | $85.00 | $85.00 | $85.00 | $101.74 |
Wall Communications Inc. 2022
2022 Mobile Prices in the Far North vs. Rest of Canada

Wall Communications Inc. 2022
Fixed internet
As can be seen in the Table and the Chart below, fixed internet prices in the Far North are considerably higher than the rest of Canada – particularly as download speed is increased.
| - | Whitehorse Average |
Yellowknife Average |
Iqaluit Average |
All Far North Average |
Rest of Canada Average |
|---|---|---|---|---|---|
| L1 | $44.95 | $49.98 | $73.25 | $56.06 | $47.87 |
| L2 | $80.04 | $65.95 | $90.31 | $78.77 | $50.41 |
| L3 | $82.95 | $82.95 | n/a | $82.95 | $56.86 |
| L4 | $113.95 | $113.95 | n/a | $113.95 | $75.39 |
| L5 | $142.95 | $192.95 | n/a | $167.95 | $91.50 |
| L6 | n/a | $222.95 | n/a | $222.95 | $96.86 |
| L7 | n/a | n/a | n/a | n/a | $104.64 |
Wall Communications Inc. 2022
2022 Fixed Internet in the Far North vs. Rest of Canada

Wall Communications Inc. 2022
Attachment 1 – Service baskets 2022
Table A1.1
Mobile wireless service basket descriptions
- Level 1: 450 voice minutes and 300 SMS (texts);
- Level 2: 1 GB of data usage per month (no talk or text);
- Level 3: unlimited nationwide talk and text along with 2-4 GB of data;
- Level 4: unlimited nationwide talk and text along with 5-6 GB of data;
- Level 5: unlimited nationwide talk and text along with 7-9 GB of data;
- Level 6: unlimited nationwide talk and text along with 10-19 GB of data;
- Level 7: unlimited nationwide talk and text along with 20-49 GB of data; and
- Level 8: unlimited nationwide talk and text along with 50-99 GB of data.
Table A1.2
Broadband internet service basket descriptions
- Level 1: speeds of 3-9 Mbps;
- Level 2: speeds of 10 to 15 Mbps;
- Level 3: speeds of 16 to 40 Mbps;
- Level 4: speeds of 41 to 100 Mbps;
- Level 5: speeds of 101 to 250 Mbps;
- Level 6: speeds of 251 to 500 Mbps; and
- Level 7: speeds greater than 500 Mbps
Attachment 2 – Canadian prices comparisons 2022
Table A2.1 – Canadian historical mobile wireless prices
Note: Due to Basket redefinitions in 2020, historical comparisons prior to that date are not exact in some categories
| - | NS | QC | ON | MB | SK | BC | Canada | YoY% |
|---|---|---|---|---|---|---|---|---|
| 2017 | $41.03 | $38.62 | $41.85 | $36.40 | $35.91 | $44.40 | $40.95 | -16.00% |
| 2018 | $42.39 | $36.69 | $40.42 | $39.25 | $36.71 | $41.28 | $39.43 | -3.72% |
| 2019 | $39.77 | $37.23 | $37.79 | $38.90 | $27.72 | $39.28 | $37.62 | -4.59% |
| 2020 | $29.59 | $30.86 | $30.88 | $30.96 | $30.49 | $29.71 | $30.63 | -18.57% |
| 2021 | $26.36 | $27.53 | $26.41 | $27.12 | $24.19 | $26.68 | $26.70 | -12.83% |
| 2022 | $26.40 | $26.99 | $25.62 | $25.53 | $31.54 | $25.42 | $26.19 | -1.90% |
| CAGR | -8.44% | -6.92% | -9.35% | -6.85% | -2.56% | -10.56% | -8.55% | - |
| - | NS | QC | ON | MB | SK | BC | Canada | YoY% |
|---|---|---|---|---|---|---|---|---|
| 2020 | $33.37 | $32.46 | $32.24 | $32.57 | $20.21 | $31.71 | $31.82 | - |
| 2021 | $28.37 | $25.70 | $24.23 | $29.70 | $16.18 | $25.67 | $24.92 | -21.67% |
| 2022 | $28.83 | $28.78 | $28.28 | $28.40 | $19.94 | $28.38 | $28.14 | 12.93% |
| CAGR | -7.05% | -5.84% | -6.34% | -6.63% | -0.67% | -5.39% | -5.95% | - |
| - | NS | QC | ON | MB | SK | BC | Canada | YoY% |
|---|---|---|---|---|---|---|---|---|
| 2017 | $93.98 | $68.26 | $87.45 | $67.04 | $56.43 | $93.74 | $81.61 | 0.70% |
| 2018 | $86.48 | $57.95 | $85.23 | $52.77 | $78.48 | $85.09 | $75.44 | -7.56% |
| 2019 | $83.94 | $53.92 | $84.71 | $57.63 | $56.72 | $85.83 | $74.42 | -1.36% |
| 2020 | $46.23 | $42.74 | $46.14 | $46.17 | $46.85 | $46.43 | $45.30 | -39.12% |
| 2021 | $39.69 | $39.67 | $38.72 | $39.44 | $37.77 | $39.30 | $39.09 | -13.71% |
| 2022 | $39.87 | $39.19 | $38.90 | $39.42 | $39.89 | $39.43 | $39.15 | 0.15% |
| CAGR | -15.76% | -10.51% | -14.96% | -10.08% | -6.70% | -15.91% | -13.66% | - |
| - | NS | QC | ON | MB | SK | BC | Canada | YoY% |
|---|---|---|---|---|---|---|---|---|
| 2017 | $105.89 | $87.09 | $113.95 | $74.71 | $74.06 | $121.49 | $104.49 | 8.20% |
| 2018 | $101.67 | $65.27 | $99.69 | $61.56 | $66.68 | $100.76 | $87.32 | -16.43% |
| 2019 | $98.62 | $64.28 | $100.21 | $65.35 | $56.66 | $101.13 | $87.57 | 0.29% |
| 2020 | $53.16 | $46.92 | $51.96 | $52.90 | $59.83 | $53.38 | $51.21 | -41.52% |
| 2021 | $45.59 | $45.61 | $45.08 | $45.39 | $50.23 | $45.25 | $45.47 | -11.20% |
| 2022 | $46.25 | $43.56 | $45.50 | $45.67 | $58.10 | $45.44 | $45.47 | 0.00% |
| CAGR | -15.27% | -12.94% | -16.78% | -9.83% | -4.74% | -17.86% | -15.33% | - |
| - | NS | QC | ON | MB | SK | BC | Canada | YoY% |
|---|---|---|---|---|---|---|---|---|
| 2020 | $64.53 | $58.07 | $62.50 | $63.89 | $65.20 | $63.20 | $61.65 | - |
| 2021 | $54.14 | $58.27 | $52.02 | $53.52 | $55.45 | $53.12 | $54.13 | -12.19% |
| 2022 | $55.79 | $51.43 | $54.85 | $55.26 | $56.76 | $54.61 | $54.01 | -0.22% |
| CAGR | -7.02% | -5.89% | -6.32% | -7.00% | -6.70% | -7.05% | -6.40% | - |
| - | NS | QC | ON | MB | SK | BC | Canada | YoY% |
|---|---|---|---|---|---|---|---|---|
| 2020 | $80.12 | $69.15 | $76.76 | $69.21 | $71.27 | $78.47 | $74.57 | - |
| 2021 | $60.49 | $52.70 | $67.07 | $60.61 | $68.68 | $66.88 | $62.77 | -15.83% |
| 2022 | $56.90 | $49.48 | $58.42 | $56.13 | $70.99 | $52.71 | $55.42 | -11.70% |
| CAGR | -15.72% | -15.41% | -12.76% | -9.94% | -0.19% | -18.04% | -13.79% | - |
| - | NS | QC | ON | MB | SK | BC | Canada | YoY% |
|---|---|---|---|---|---|---|---|---|
| 2020 | $98.56 | $86.43 | $92.30 | $89.09 | $91.29 | $94.16 | $91.04 | - |
| 2021 | $80.74 | $58.67 | $83.36 | $71.93 | $85.15 | $83.28 | $76.23 | -16.72% |
| 2022 | $78.79 | $63.27 | $76.20 | $69.48 | $76.11 | $77.94 | $72.81 | -4.49% |
| CAGR | -10.59% | -14.44% | -9.13% | -11.69% | -8.69% | -9.02% | -10.57% | - |
| - | NS | QC | ON | MB | SK | BC | Canada | YoY% |
|---|---|---|---|---|---|---|---|---|
| 2020 | $128.09 | $117.22 | $126.54 | $117.06 | $113.29 | $126.05 | $123.11 | - |
| 2021 | $125.43 | $113.87 | $125.00 | $113.07 | $112.51 | $125.00 | $121.06 | -1.67% |
| 2022 | $100.78 | $94.37 | $102.53 | $93.23 | $106.96 | $112.98 | $101.74 | -15.96% |
| CAGR | -11.30% | -10.27% | -9.98% | -10.76% | -2.83% | -5.33% | -9.09% | - |
Wall Communications Inc. 2022
Table A2.2 – Canadian historical fixed broadband internet prices
Note: Due to Basket redefinitions, historical comparisons are not exact in some categories
| - | NS | QC | ON | MB | SK | BC | Canada | YoY |
|---|---|---|---|---|---|---|---|---|
| 2008 | $34.95 | $32.45 | $38.95 | $29.95 | $30.45 | $23.45 | $32.88 | - |
| 2009 | $35.95 | $28.43 | $35.45 | $30.95 | $30.45 | $24.95 | $30.98 | -5.79% |
| 2010 | $36.95 | $29.43 | $33.45 | n/a | $30.95 | $29.00 | $31.44 | 1.49% |
| 2011 | $36.15 | $36.90 | $34.15 | n/a | $32.52 | $33.00 | $34.85 | 10.86% |
| 2012 | $39.15 | $33.35 | $45.37 | n/a | $31.95 | $35.40 | $39.37 | 12.98% |
| 2013 | $42.15 | n/a | n/a | n/a | $31.95 | $39.00 | $38.91 | -1.19% |
| 2014 | $40.15 | n/a | $50.95 | n/a | $42.95 | n/a | $50.00 | 28.50% |
| 2015 | $55.13 | n/a | n/a | n/a | $34.10 | n/a | $47.51 | -4.96% |
| 2016 | $88.73 | $41.07 | $33.63 | $55.80 | $46.95 | $51.00 | $41.94 | -11.74% |
| 2017 | $50.27 | $41.47 | $32.52 | $59.00 | $49.75 | $57.58 | $41.83 | -0.25% |
| 2018 | $39.40 | $45.19 | $39.11 | $30.61 | $46.17 | $40.01 | $40.67 | -2.78% |
| 2019 | $57.95 | $37.64 | $35.09 | $28.61 | n/a | $33.51 | $35.98 | -11.54% |
| 2020 | $54.86 | $43.86 | $44.90 | $42.28 | n/a | $42.22 | $44.37 | 23.30% |
| 2021 | $56.85 | $45.78 | $50.36 | $41.03 | $41.03 | $44.24 | $47.60 | 7.29% |
| 2022 | $49.03 | $47.03 | $50.24 | $41.03 | n/a | $42.57 | $47.61 | 0.02% |
| CAGR | 2.45% | 2.69% | 1.83% | 2.27% | n/a | 4.35% | 2.68% | - |
| - | NS | QC | ON | MB | SK | BC | Canada | YoY |
|---|---|---|---|---|---|---|---|---|
| 2008 | $47.45 | $48.95 | $48.95 | $41.95 | $45.45 | $40.95 | $46.58 | - |
| 2009 | $48.45 | $50.43 | $50.95 | $42.95 | $45.45 | $38.45 | $47.26 | 1.47% |
| 2010 | $49.45 | $51.43 | $47.95 | n/a | $45.95 | $40.00 | $47.60 | 0.71% |
| 2011 | $50.75 | $52.83 | $49.33 | n/a | $48.52 | $45.65 | $49.79 | 4.61% |
| 2012 | $57.75 | $60.92 | $52.79 | n/a | $54.95 | $46.40 | $54.31 | 9.07% |
| 2013 | $51.15 | $55.60 | $47.18 | n/a | $54.95 | $53.51 | $51.20 | -5.72% |
| 2014 | $54.95 | $53.91 | $55.25 | n/a | $54.95 | $56.68 | $55.10 | 7.61% |
| 2015 | $74.45 | $54.83 | $55.17 | $59.17 | $52.88 | $59.90 | $56.66 | 2.84% |
| 2016 | n/a | $51.75 | $61.92 | $62.60 | $56.95 | $62.00 | $58.88 | 3.91% |
| 2017 | n/a | $53.26 | $72.14 | $66.70 | $59.75 | $69.29 | $65.54 | 11.31% |
| 2018 | n/a | $56.61 | $48.33 | $76.52 | $55.34 | $74.77 | $57.36 | -12.48% |
| 2019 | n/a | $55.38 | $50.95 | $68.58 | $49.95 | $52.61 | $53.20 | -7.26% |
| 2020 | n/a | $58.54 | $52.45 | $67.48 | $50.37 | $51.80 | $54.61 | 2.67% |
| 2021 | n/a | $53.43 | $50.21 | $60.00 | $50.44 | $50.16 | $51.54 | -5.64% |
| 2022 | n/a | $46.23 | $52.10 | $60.00 | $50.37 | $50.04 | $50.42 | -1.90% |
| CAGR | n/a | -0.41% | 0.45% | 2.59% | 0.74% | 1.44% | 0.57% | - |
| - | NS | QC | ON | MB | SK | BC | Canada | YoY |
|---|---|---|---|---|---|---|---|---|
| 2008 | $57.45 | $83.45 | $73.95 | $52.95 | $55.95 | $50.95 | $68.74 | - |
| 2009 | $58.45 | $64.40 | $62.45 | $52.95 | $55.95 | $53.45 | $60.08 | -12.60% |
| 2010 | $59.45 | $65.40 | $62.45 | n/a | $56.45 | $55.48 | $61.88 | 3.00% |
| 2011 | $60.75 | $66.33 | $65.35 | n/a | $56.75 | $55.00 | $63.44 | 2.52% |
| 2012 | $88.95 | $66.95 | $72.17 | n/a | $79.95 | $54.60 | $67.94 | 7.09% |
| 2013 | $77.95 | $67.05 | $64.35 | n/a | $79.95 | $60.69 | $65.18 | -4.07% |
| 2014 | $87.95 | $67.15 | $70.87 | n/a | $70.95 | $62.00 | $68.60 | 5.25% |
| 2015 | $92.95 | $59.93 | $71.39 | $67.93 | $62.88 | $68.17 | $67.81 | -1.15% |
| 2016 | n/a | $56.09 | $65.20 | $70.60 | $62.95 | $69.06 | $63.48 | -6.39% |
| 2017 | n/a | $50.80 | $70.89 | $73.35 | $73.95 | $73.09 | $65.59 | 3.32% |
| 2018 | $82.50 | $55.62 | $79.15 | $76.82 | $66.19 | $71.16 | $70.70 | 7.78% |
| 2019 | n/a | $65.24 | $51.54 | $77.90 | $66.19 | $40.39 | $55.20 | -21.91% |
| 2020 | n/a | $59.37 | $59.91 | $54.78 | $62.26 | $71.94 | $61.62 | 11.63% |
| 2021 | $92.95 | $58.18 | $66.38 | $77.62 | $57.38 | $78.68 | $66.31 | 7.61% |
| 2022 | n/a | $57.93 | $58.83 | $76.64 | $57.06 | $57.07 | $59.01 | -11.01% |
| CAGR | n/a | -2.57% | -1.62% | 2.68% | 0.14% | 0.81% | -1.08% | - |
| - | NS | QC | ON | MB | SK | BC | Canada | YoY |
|---|---|---|---|---|---|---|---|---|
| 2011 | $84.75 | $73.30 | $73.75 | n/a | $99.95 | $91.40 | $77.71 | - |
| 2012 | $138.95 | $82.95 | $106.98 | n/a | n/a | $74.90 | $94.39 | 21.47% |
| 2013 | $102.75 | $82.95 | $80.57 | n/a | $99.95 | $85.00 | $82.88 | -12.19% |
| 2014 | $99.55 | $84.75 | $86.87 | n/a | $105.95 | $86.00 | $86.46 | 4.31% |
| 2015 | $99.26 | $74.51 | $79.68 | $87.10 | $105.80 | $89.79 | $80.63 | -6.74% |
| 2016 | $84.17 | $72.21 | $76.80 | $89.80 | $85.95 | $89.16 | $78.77 | -2.30% |
| 2017 | $87.22 | $78.06 | $85.51 | $90.00 | $83.95 | $79.18 | $82.54 | 4.79% |
| 2018 | $95.69 | $71.14 | $95.84 | $94.14 | $96.65 | $86.67 | $87.00 | 5.41% |
| 2019 | $86.27 | $73.63 | $70.42 | $83.71 | $96.65 | $62.34 | $72.01 | -17.23% |
| 2020 | $76.41 | $67.08 | $83.33 | $77.66 | $71.14 | $77.82 | $77.18 | 7.18% |
| 2021 | $93.99 | $60.87 | $84.69 | $81.88 | $73.11 | $84.31 | $77.98 | 1.04% |
| 2022 | $85.03 | $67.29 | $77.47 | $78.13 | $73.03 | $80.80 | $75.38 | -3.37% |
| CAGR | 0.03% | -0.78% | 0.45% | -1.54% | -2.81% | -1.11% | -0.28% | - |
| - | NS | QC | ON | MB | SK | BC | Canada | YoY |
|---|---|---|---|---|---|---|---|---|
| 2016 | $133.10 | $138.80 | $92.91 | $123.00 | n/a | $123.00 | $114.65 | - |
| 2017 | $113.55 | $79.15 | $100.08 | $122.01 | $139.95 | $92.50 | $95.10 | -17.06% |
| 2018 | $108.62 | $87.22 | $108.90 | $116.44 | $104.95 | $107.61 | $102.76 | 8.06% |
| 2019 | $103.95 | $87.00 | $87.11 | $74.53 | $104.95 | $59.31 | $83.25 | -18.99% |
| 2020 | $84.95 | $60.00 | $95.44 | $78.91 | $96.20 | $89.32 | $83.95 | 0.85% |
| 2021 | n/a | $82.46 | $104.50 | $93.97 | $71.55 | $94.38 | $95.00 | 13.16% |
| 2022 | $107.45 | $85.14 | $101.19 | $78.51 | $71.55 | $79.40 | $91.50 | -3.68% |
| CAGR | -3.51 | -7.82% | 1.43% | -7.21% | -12.56% | -7.04% | -3.69% | - |
| - | NS | QC | ON | MB | SK | BC | Canada | YoY |
|---|---|---|---|---|---|---|---|---|
| 2018 | $125.69 | $105.45 | $135.23 | n/a | $144.95 | n/a | $123.87 | - |
| 2019 | $112.13 | $78.30 | $96.74 | $98.19 | $144.95 | $89.94 | $93.03 | -24.90% |
| 2020 | $98.31 | $76.27 | $107.38 | $100.00 | $106.72 | $99.56 | $97.16 | 4.44% |
| 2021 | $92.95 | $71.62 | $112.88 | $100.24 | $94.52 | $101.09 | $98.08 | 0.95% |
| 2022 | $113.86 | $79.65 | $108.79 | $94.19 | $94.24 | $90.11 | $96.97 | -1.14% |
| CAGR | -2.44% | -6.77% | -5.29% | -1.38% | -10.21% | -0.06% | -5.94% | - |
| - | NS | QC | ON | MB | SK | BC | Canada | YoY |
|---|---|---|---|---|---|---|---|---|
| 2020 | $112.12 | $87.45 | $117.90 | $113.59 | n/a | $108.94 | $107.55 | - |
| 2021 | $115.23 | $79.95 | $123.51 | $113.62 | $123.42 | $108.33 | $108.71 | 1.08% |
| 2022 | $126.07 | $101.00 | $107.32 | $104.34 | $123.31 | $99.00 | $104.75 | -3.64% |
| CAGR | 6.04% | 7.47% | -4.59% | -4.16% | -0.09% | -4.35% | -1.31% | - |
Wall Communications Inc. 2022
Attachment 3 – International price comparisons 2022
Table A3.1 – International historical mobile wireless prices
Note: Due to Basket redefinitions, historical comparisons are not exact in some categories.
| - | Canada | U.S.A. | Australia | U.K. | France | Italy | Germany | Japan |
|---|---|---|---|---|---|---|---|---|
| 2016 | $48.77 | $51.64 | n/a | $25.79 | $24.17 | $24.41 | $28.28 | $48.78 |
| 2017 | $40.95 | $49.48 | $27.36 | $22.58 | $23.88 | n/a | n/a | $45.38 |
| 2018 | $39.43 | $44.29 | n/a | $16.68 | n/a | $11.86 | $15.06 | n/a |
| 2019 | $37.62 | $42.89 | n/a | $16.32 | $10.76 | $12.25 | $14.92 | $35.31 |
| 2020 | $30.63 | $48.65 | n/a | $23.74 | $12.63 | n/a | n/a | $30.70 |
| 2021 | $26.70 | $49.19 | n/a | n/a | $6.78 | n/a | n/a | $32.67 |
| 2022 | $26.19 | $52.00 | n/a | n/a | $6.40 | $15.31 | $9.13 | $35.65 |
| CAGR | -9.84% | 0.11% | n/a | n/a | -19.86% | -7.48% | -17.17% | -5.09% |
| - | Canada | U.S.A. | Australia | U.K. | France | Italy | Germany | Japan |
|---|---|---|---|---|---|---|---|---|
| 2020 | $31.82 | $26.95 | n/a | n/a | n/a | n/a | n/a | $35.06 |
| 2021 | $24.92 | n/a | n/a | $21.47 | n/a | n/a | n/a | $34.51 |
| 2022 | $28.14 | n/a | n/a | n/a | n/a | n/a | n/a | $41.69 |
| CAGR | -5.95% | n/a | n/a | n/a | n/a | n/a | n/a | 9.04% |
| - | Canada | U.S.A. | Australia | U.K. | France | Italy | Germany | Japan |
|---|---|---|---|---|---|---|---|---|
| 2016 | $81.05 | $89.50 | $44.78 | $35.55 | $61.60 | $49.42 | $68.12 | n/a |
| 2017 | $81.61 | $67.20 | $54.29 | $34.26 | $31.86 | $41.22 | $72.41 | $60.11 |
| 2018 | $75.44 | $61.26 | $24.70 | $26.56 | $30.91 | $21.11 | $45.80 | $81.52 |
| 2019 | $74.42 | $59.50 | $22.35 | $24.72 | $33.09 | $26.80 | $41.08 | $78.42 |
| 2020 | $45.30 | $39.08 | $24.88 | $23.27 | $33.31 | $28.38 | $43.61 | $73.60 |
| 2021 | $39.09 | $54.11 | n/a | $27.82 | n/a | n/a | $17.75 | $86.62 |
| 2022 | $39.15 | $60.51 | n/a | $21.01 | n/a | n/a | $18.35 | $89.23 |
| CAGR | -11.42% | -6.31% | n/a | -8.40% | n/a | n/a | -19.64% | 8.22% |
| - | Canada | U.S.A. | Australia | U.K. | France | Italy | Germany | Japan |
|---|---|---|---|---|---|---|---|---|
| 2016 | $96.55 | $117.33 | $66.67 | $42.22 | $70.12 | $61.02 | $88.23 | n/a |
| 2017 | $104.49 | $75.06 | $67.04 | $39.20 | $46.45 | $53.22 | $82.21 | $74.12 |
| 2018 | $87.32 | $97.88 | $27.27 | $31.26 | $34.31 | $29.55 | $64.89 | $103.07 |
| 2019 | $87.57 | $63.04 | n/a | $28.48 | $27.28 | n/a | $54.67 | $95.63 |
| 2020 | $51.21 | $43.52 | n/a | $25.73 | $28.41 | n/a | $54.43 | $88.46 |
| 2021 | $45.47 | $45.79 | n/a | $21.43 | $25.63 | $21.82 | $42.02 | $99.95 |
| 2022 | $45.47 | $48.94 | n/a | $23.63 | $25.45 | n/a | $27.51 | $110.27 |
| CAGR | -11.80% | -13.56% | n/a | -9.22% | -15.44% | n/a | -17.65% | 8.27% |
| - | Canada | U.S.A. | Australia | U.K. | France | Italy | Germany | Japan |
|---|---|---|---|---|---|---|---|---|
| 2020 | $61.65 | $64.47 | $24.88 | $17.56 | n/a | n/a | $67.49 | $100.96 |
| 2021 | $54.13 | $43.15 | n/a | $17.66 | n/a | n/a | n/a | $110.72 |
| 2022 | $54.01 | $57.67 | n/a | $21.78 | n/a | n/a | $45.83 | $117.77 |
| CAGR | -6.40% | -5.42% | n/a | 11.37% | n/a | n/a | -17.60% | 8.01% |
| - | Canada | U.S.A. | Australia | U.K. | France | Italy | Germany | Japan |
|---|---|---|---|---|---|---|---|---|
| 2020 | $74.57 | $61.56 | $32.93 | $22.15 | $44.71 | n/a | $82.66 | $78.89 |
| 2021 | $62.77 | $63.52 | $32.30 | $24.24 | $39.45 | n/a | $61.45 | $73.62 |
| 2022 | $55.42 | $66.63 | $28.24 | $23.72 | $43.05 | n/a | $47.53 | $78.32 |
| CAGR | -13.79% | 4.04% | -7.40% | 3.49% | -1.88% | n/a | -24.17% | -0.37% |
| - | Canada | U.S.A. | Australia | U.K. | France | Italy | Germany | Japan |
|---|---|---|---|---|---|---|---|---|
| 2020 | $91.04 | n/a | $41.60 | $35.66 | $33.29 | $34.21 | $86.02 | $108.94 |
| 2021 | $76.23 | n/a | $40.09 | $31.05 | $33.66 | $31.07 | $77.63 | $110.47 |
| 2022 | $72.81 | n/a | $44.91 | $29.94 | n/a | n/a | $76.43 | $98.04 |
| CAGR | -10.57% | n/a | 3.90% | -8.38% | n/a | n/a | -5.74% | -5.14% |
| - | Canada | U.S.A. | Australia | U.K. | France | Italy | Germany | Japan |
|---|---|---|---|---|---|---|---|---|
| 2020 | $123.11 | $82.94 | $97.12 | $55.87 | $57.27 | $66.85 | $102.08 | n/a |
| 2021 | $121.06 | n/a | $55.52 | $38.97 | $37.72 | $36.29 | n/a | $118.13 |
| 2022 | $101.74 | n/a | $38.99 | $32.55 | $40.39 | $29.32 | $70.44 | $111.88 |
| CAGR | 9.09% | n/a | -36.64% | -23.68% | -16.03% | -33.77% | -16.93% | -5.29% |
Wall Communications Inc. 2022
Table A3.2 – International historical fixed broadband prices
Note: Due to Basket redefinitions, historical comparisons are not exact in some categories.
| - | Canada | U.S.A. | Australia | U.K. | France | Italy | Germany | Japan |
|---|---|---|---|---|---|---|---|---|
| 2008 | $32.88 | $33.77 | $42.79 | $29.93 | $42.23 | n/a | n/a | n/a |
| 2009 | $30.98 | $40.19 | $41.31 | n/a | $44.87 | n/a | n/a | n/a |
| 2010 | $31.44 | $39.61 | $34.91 | n/a | n/a | n/a | n/a | $39.73 |
| 2011 | $34.85 | $51.06 | $29.84 | n/a | $28.33 | n/a | n/a | $43.13 |
| 2012 | $39.37 | $57.24 | n/a | n/a | n/a | n/a | n/a | $50.48 |
| 2013 | $38.91 | $52.38 | n/a | n/a | n/a | n/a | n/a | $45.55 |
| 2014 | $50.00 | $62.53 | n/a | n/a | n/a | n/a | n/a | $56.55 |
| 2015 | $47.51 | $54.54 | n/a | n/a | n/a | n/a | n/a | $57.83 |
| 2016 | $41.94 | $79.64 | $58.38 | n/a | n/a | n/a | $28.28 | n/a |
| 2017 | $41.83 | $63.92 | $54.72 | n/a | n/a | $41.18 | n/a | $59.49 |
| 2018 | $40.67 | $63.32 | n/a | n/a | n/a | $60.53 | n/a | $40.56 |
| 2019 | $35.98 | $62.50 | n/a | $37.52 | n/a | n/a | n/a | n/a |
| 2020 | $44.37 | n/a | n/a | $37.01 | n/a | $50.98 | n/a | $73.33 |
| 2021 | $47.60 | n/a | n/a | n/a | n/a | n/a | n/a | $73.10 |
| 2022 | $47.61 | n/a | n/a | n/a | n/a | n/a | n/a | $77.76 |
| CAGR | 2.68% | n/a | n/a | n/a | n/a | n/a | n/a | 5.75% |
| - | Canada | U.S.A. | Australia | U.K. | France | Italy | Germany | Japan |
|---|---|---|---|---|---|---|---|---|
| 2008 | $46.58 | $55.97 | $62.56 | $44.05 | $45.82 | n/a | n/a | n/a |
| 2009 | $47.26 | $57.92 | $63.76 | $30.22 | $48.69 | n/a | n/a | n/a |
| 2010 | $47.60 | $58.97 | $52.01 | $40.57 | $44.03 | n/a | n/a | $49.55 |
| 2011 | $49.79 | $65.14 | $56.74 | $40.72 | $47.41 | n/a | n/a | $53.79 |
| 2012 | $54.31 | $78.84 | $59.81 | $30.50 | $46.97 | n/a | n/a | $55.70 |
| 2013 | $51.20 | $81.42 | $58.15 | $32.85 | n/a | n/a | n/a | $52.53 |
| 2014 | $55.10 | $72.91 | $50.67 | $30.22 | n/a | $52.26 | $26.09 | $60.65 |
| 2015 | $56.66 | $67.66 | $53.75 | n/a | $67.78 | $54.31 | $29.08 | $61.03 |
| 2016 | $58.88 | $83.85 | $54.49 | n/a | $73.83 | $64.29 | n/a | $51.75 |
| 2017 | $65.54 | $82.43 | $46.90 | n/a | $39.81 | n/a | $27.77 | $54.39 |
| 2018 | $57.36 | $75.56 | n/a | $54.13 | $48.83 | n/a | n/a | $61.14 |
| 2019 | $53.20 | $69.35 | n/a | $40.36 | n/a | n/a | n/a | $47.76 |
| 2020 | $54.61 | n/a | n/a | $38.84 | n/a | $50.98 | n/a | $69.10 |
| 2021 | $51.55 | n/a | n/a | n/a | n/a | n/a | n/a | $74.28 |
| 2022 | $50.42 | n/a | n/a | n/a | n/a | n/a | n/a | $79.01 |
| CAGR | 0.57% | n/a | n/a | n/a | n/a | n/a | n/a | 3.96% |
| - | Canada | U.S.A. | Australia | U.K. | France | Italy | Germany | Japan |
|---|---|---|---|---|---|---|---|---|
| 2008 | $68.74 | $67.40 | $76.47 | $52.72 | $49.41 | n/a | n/a | n/a |
| 2009 | $60.08 | $70.41 | $77.98 | $35.93 | $47.73 | n/a | n/a | n/a |
| 2010 | $61.88 | $75.26 | $74.32 | $46.24 | $57.45 | n/a | n/a | $72.15 |
| 2011 | $63.44 | $79.60 | $59.72 | $40.09 | $66.37 | n/a | n/a | $54.52 |
| 2012 | $67.94 | $97.00 | $61.69 | $40.88 | $46.07 | n/a | n/a | $59.37 |
| 2013 | $65.18 | $99.10 | $57.10 | $43.01 | $49.34 | n/a | n/a | $61.52 |
| 2014 | $68.60 | $79.76 | $67.44 | $46.89 | $51.15 | $52.92 | $38.30 | $63.88 |
| 2015 | $67.81 | $91.55 | $69.64 | $41.25 | $51.68 | $52.28 | $47.08 | $64.50 |
| 2016 | $63.48 | $97.53 | $57.41 | $40.43 | n/a | $41.77 | $49.75 | $71.52 |
| 2017 | $65.59 | $99.64 | $70.35 | $55.67 | $50.43 | n/a | $46.80 | $68.32 |
| 2018 | $70.70 | $84.33 | $66.74 | $49.42 | $38.15 | $45.45 | $50.18 | $71.77 |
| 2019 | $55.20 | $69.02 | $62.36 | $46.11 | n/a | $49.26 | $49.15 | n/a |
| 2020 | $61.62 | $65.10 | $56.53 | $40.39 | $36.33 | $50.98 | $43.65 | $72.51 |
| 2021 | $65.61 | $59.11 | $59.61 | $41.82 | $28.25 | $41.27 | $50.52 | $76.04 |
| 2022 | $59.01 | n/a | $63.02 | $42.48 | $30.07 | n/a | $48.47 | $80.89 |
| CAGR | -1.08% | n/a | -1.37% | -1.53% | -3.48% | -n/a | 2.99% | 0.96% |
| - | Canada | U.S.A. | Australia | U.K. | France | Italy | Germany | Japan |
|---|---|---|---|---|---|---|---|---|
| 2011 | $77.71 | $95.07 | $67.19 | $50.07 | $49.79 | n/a | n/a | $59.76 |
| 2012 | $94.39 | $160.97 | $82.25 | $58.66 | $62.36 | n/a | n/a | $62.65 |
| 2013 | $82.88 | $123.27 | $72.69 | $53.31 | $54.58 | n/a | n/a | $64.89 |
| 2014 | $86.46 | $103.17 | $70.33 | $47.76 | $55.98 | $61.79 | $58.52 | $67.73 |
| 2015 | $80.63 | $105.90 | $72.66 | $50.75 | $57.95 | $60.45 | $59.32 | $65.32 |
| 2016 | $78.77 | $112.30 | $71.03 | $54.20 | $63.80 | $53.02 | $61.78 | $49.78 |
| 2017 | $82.54 | $114.81 | $89.98 | $59.38 | $42.47 | n/a | $54.45 | $69.58 |
| 2018 | $87.00 | $105.34 | $88.74 | $67.69 | $53.14 | $65.20 | $64.84 | $84.43 |
| 2019 | $72.01 | $75.48 | $75.06 | $55.20 | n/a | $42.27 | $53.80 | $63.69 |
| 2020 | $77.18 | $72.80 | $78.28 | $49.23 | n/a | $50.98 | $53.01 | $66.83 |
| 2021 | $78.18 | $78.87 | $81.97 | $49.24 | n/a | n/a | $51.94 | $66.63 |
| 2022 | $75.38 | $59.40 | $70.85 | $43.27 | n/a | n/a | $45.75 | $70.88 |
| CAGR | -0.28% | -4.19% | 0.48% | -1.32% | n/a | n/a | -3.03% | 1.56% |
| - | Canada | U.S.A. | Australia | U.K. | France | Italy | Germany | Japan |
|---|---|---|---|---|---|---|---|---|
| 2016 | $114.65 | $127.69 | n/a | $57.56 | $70.54 | n/a | $56.57 | $71.36 |
| 2017 | $95.10 | $145.15 | n/a | $70.67 | $50.19 | $60.39 | $58.33 | $65.64 |
| 2018 | $102.76 | $131.06 | n/a | $64.86 | $60.86 | n/a | $72.45 | $79.90 |
| 2019 | $83.25 | $93.01 | n/a | $75.87 | $33.79 | $49.26 | $65.87 | $77.69 |
| 2020 | $83.95 | $86.98 | n/a | $75.30 | n/a | $50.98 | $64.85 | $82.70 |
| 2021 | $95.19 | $76.66 | n/a | $73.95 | n/a | n/a | $57.54 | $84.70 |
| 2022 | $91.50 | $68.64 | $104.38 | $63.10 | n/a | n/a | $60.95 | $90.10 |
| CAGR | -3.69% | -9.83% | n/a | 1.54% | n/a | n/a | 1.25% | 3.96% |
| - | Canada | U.S.A. | Australia | U.K. | France | Italy | Germany | Japan |
|---|---|---|---|---|---|---|---|---|
| 2018 | $123.87 | $160.08 | n/a | $78.96 | $70.18 | $46.33 | $94.33 | $72.23 |
| 2019 | $93.03 | $120.62 | n/a | $78.62 | $41.20 | $42.27 | $47.64 | $76.31 |
| 2020 | $97.16 | $97.63 | n/a | $84.08 | $39.51 | $50.98 | n/a | $77.13 |
| 2021 | $99.11 | $94.10 | n/a | $82.57 | $36.47 | n/a | n/a | $63.00 |
| 2022 | $96.97 | $68.12 | n/a | $73.60 | $40.76 | n/a | $55.03 | $91.69 |
| CAGR | -5.94% | -19.23% | n/a | -1.74% | -12.70% | n/a | -12.60% | 6.15% |
| - | Canada | U.S.A. | Australia | U.K. | France | Italy | Germany | Japan |
|---|---|---|---|---|---|---|---|---|
| 2020 | $107.55 | $113.37 | n/a | $92.86 | $49.69 | $50.98 | $58.42 | $79.46 |
| 2021 | $109.02 | $108.40 | n/a | $91.19 | $44.36 | $42.02 | $54.38 | $85.58 |
| 2022 | $104.75 | $84.76 | n/a | $85.30 | $50.78 | $40.47 | $56.82 | $98.21 |
| CAGR | -1.31% | -13.54% | n/a | -4.16% | 1.10% | -10.90% | -1.37% | 11.17% |
Wall Communications Inc. 2022
Attachment 4 – Far North basket descriptions 2022
Table A4.1 Mobile wireless
Bell
Whitehorse and Yellowknife
- L1 – 100 Canada wide mins + unlimited text ($15) plus unlimited Canada minutes ($25)
- L2 – n/a
- L3 – 2.5 GB Prepaid
- L4 – 4.5 GB Prepaid
- L5 – 8 GB Prepaid
- L6 – n/a
- L7 – n/a
- L8 – 25 – 50 GB
Iqaluit
- L1 – 100 Canada wide mins + unlimited text ($15) plus unlimited Canada minutes ($25)
- L2 – n/a
- L3 – 2.5 GB Prepaid
- L4 – 4.5 GB Prepaid
- L5 – 8 GB Prepaid
- L6 – n/a
- L7 – n/a
- L8 – 25 – 50 GB
Telus
Whitehorse and Yellowknife
- L1 – 100 Canada wide mins + unlimited text ($15) plus unlimited Canada minutes ($25)
- L2 – n/a
- L3 – 2.5 GB Prepaid
- L4 – 4.5 GB Prepaid
- L5 – 8 GB Prepaid
- L6 – n/a
- L7 – n/a
- L8 – Unlimited 50 GB
Rogers
Whitehorse and Yellowknife
- L1 – Talk and Text (unlimited)
- L2 – n/a
- L3 – n/a
- L4 – 4.5 GB Prepaid
- L5 – 8 GB Prepaid
- L6 – 15 GB
- L7 – n/a
- L8 – Infinite Essential 50 GB
Iqaluit
No direct plans but a Rogers plan from another province will work on roaming.
Ice Wireless
Whitehorse and Yellowknife
- L1 – Prepaid Unlimited T&T
- L2 – n/a
- L3 – n/a
- L4 – n/a
- L5 – 8 GB
- L6 – 10 GB
- L7 – 20 GB
- L8 – n/a
Iqaluit
- L1 – Prepaid Unlimited T&T
- L2 – n/a
- L3 – n/a
- L4 – n/a
- L5 – 8 GB
- L6 – 10 GB
- L7 – 20 GB
- L8 – n/a
SSi (Qiniq)
Iqaluit
- L1 – 600 local minutes, 100 Canada-wide minutes and unlimited texts (CW extra minutes at 6 cents per)
- L2 – n/a
- L3 – n/a
- L4 – n/a
- L5 – n/a
- L6 – 10 GB (Natsagaq 50)
- L7 – 20 GB (Natsagaq 80)
- L8 – n/a
Note: 30 GB (Natsagaq 80) plan available
Table A4.2 Fixed broadband internet
NWTel
Whitehorse
- L1 – Internet 5, 5 Mbps 50 GB cap
- L2 – Internet 10, 10 Mbps 200 GB cap
- L3 – Internet 20, 20 Mbps 300 GB cap
- L4 – Internet 50, 50 Mbps 400 GB cap
- L5 – Internet 100, 100 Mbps 500 Gb cap
- L6 – n/a
- L7 – n/a
Yellowknife
- L1 – Internet 5, 5 Mbps 50 GB cap
- L2 – Internet 10, 10 Mbps 200 GB cap
- L3 – Internet 20, 20 Mbps 300 GB cap
- L4 – Internet 50, 50 Mbps 400 GB cap
- L5 – Internet 200, 200 Mbps, No cap
- L6 – Internet 300, 300 Mbps, No cap
- L7 – n/a
Iqaluit
- L1 – Katittuq 5 Mbps and 90 GB cap
- L2 – Katittuq 10 Mbps and 150 GB cap
- L3 – n/a
- L4 – n/a
- L5 – n/a
- L6 – n/a
- L7 – n/a
Xplore
Whitehorse
- L1 – n/a
- L2 – Satellite 10-50, 10 Mbps 50 GB cap
- L3 – n/a
- L4 – Satellite 10-50, 10 Mbps 50 GB cap
- L5- n/a
- L6 – n/a
- L7 – n/a
Yellowknife
No plans listed on Xplore website for Yellowknife
Iqaluit
- L1 – n/a
- L2 – Satellite 10-50, 10 Mbps 50 GB cap
- L3 – n/a
- L4 – n/a
- L5- n/a
- L6 – n/a
- L7 – n/a
SSi Canada
Yellowknife
- L1 – Dog Team, 3 Mbps and 50 GB cap
- L2 – n/a
- L3 – n/a
- L4 – n/a
- L5 – n/a
- L6 – n/a
- L7 – n/a
Note: Bush Plane 75 GB at $75 and Ice Road 150 GB at $140
Iqaluit (Qiniq)
- L1 – Taki Home, 5 Mbps and 50 GB cap
- L2 – n/a
- L3 – n/a
- L4 – n/a
- L5 – n/a
- L6 – n/a
- L7 – n/a
Ice Wireless
Whitehorse and Yellowknife
Uses cell network – see mobile wireless for basket description