
On this page
Introduction
Standards are defined by the Standards Council of Canada as "agreed upon rules and guidelines that establish accepted practices, technical requirements an terminologies."Footnote xxii Standards are typically established by standard-setting organizations such as the International Organization for Standardization (ISO) and the European Telecommunications Standards Institute (ETSI). Standards are especially common in the information and communications technology industry, where they act as agreed-upon protocols to ensure different technologies from different companies can operate together. Moreover, they are written protocols that ensure interoperability and compatibility between technologies.
Patents relevant to forming such standards are called standard-essential patents (SEPs). A SEP is a type of patent whose rights would be licensed to anyone wanting to comply with the related standard. In exchange for a patent being included in a standard, the owner of a SEP makes the commitment to license it either on the basis of "fair, reasonable and non-discriminatory" (FRAND) royalties or royalty-free. Standardized technologies, like Wi-Fi, 4G and 5G networks in telephony used by many organizations, rely on SEPs.
Evolution of standard-essential patent inventionsFootnote xxiii
In general, very few patents become SEPs and not all standards rely on SEPs. As standards become more important in a number of industries, there is an increasing interest to better understand the patents that are related to standards. SEP data used at CIPO for research purposes are obtained from the PatentVector database, which consists of 22,851 SEP inventions and 12 standard-setting organizations between application years 1990 and 2018. Of these inventions, 22,126 were attributable to institutions (academic institutions, businesses, government departments, medical facilities, and research organizations). The remaining SEP inventions were attributed to inventors. The rest of this section will focus solely on standard-essential inventions by institutions, referred to as simply "SEP inventions by institutions
This analysis found that, in 2018, the amount of SEP inventions worldwide was 42 times the amount in 1990, with 57 SEP inventions at the beginning of this period and 2,406 at the end, representing an average annual growth of 14%. The year with the highest growth was 2000, with 72%, while the lowest (-19%) was observed in 2009. The volumes of SEP inventions and annual growth rates are presented in Figure 35.
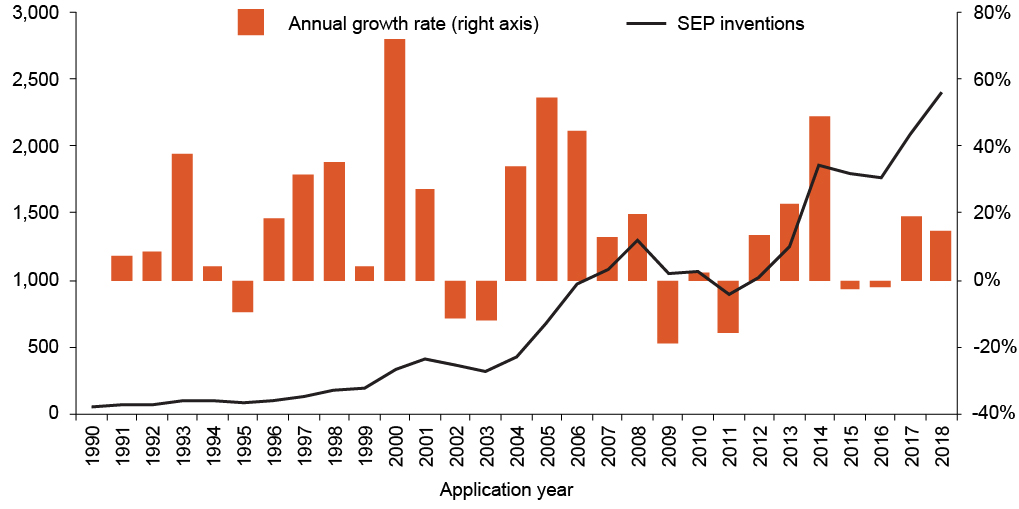
Figure 35 – text version
| Year | SEP inventions | Annual growth rate (right axis) |
|---|---|---|
| 1990 | 57 | |
| 1991 | 61 | 7% |
| 1992 | 66 | 8% |
| 1993 | 91 | 38% |
| 1994 | 95 | 4% |
| 1995 | 86 | -9% |
| 1996 | 102 | 19% |
| 1997 | 134 | 31% |
| 1998 | 181 | 35% |
| 1999 | 188 | 4% |
| 2000 | 324 | 72% |
| 2001 | 412 | 27% |
| 2002 | 365 | -11% |
| 2003 | 321 | -12% |
| 2004 | 430 | 34% |
| 2005 | 666 | 55% |
| 2006 | 962 | 44% |
| 2007 | 1,083 | 13% |
| 2008 | 1,293 | 19% |
| 2009 | 1,045 | -19% |
| 2010 | 1,068 | 2% |
| 2011 | 898 | -16% |
| 2012 | 1,019 | 13% |
| 2013 | 1,250 | 23% |
| 2014 | 1,859 | 49% |
| 2015 | 1,803 | -3% |
| 2016 | 1,762 | -2% |
| 2017 | 2,099 | 19% |
| 2018 | 2,406 | 15% |
Figure 36 shows the filing trend of the 5 world-leading countries in SEP inventions. Chinese institutions ranked first, with 6,344 SEP inventions between the application years 1990 and 2018. China has experienced a significant uptick in SEP inventions since the mid-2000s, which coincides with their burgeoning telecommunications industry.Footnote xxiv American institutions rank second, with 4,349 SEP inventions, followed by institutions from Japan, Korea and Finland.
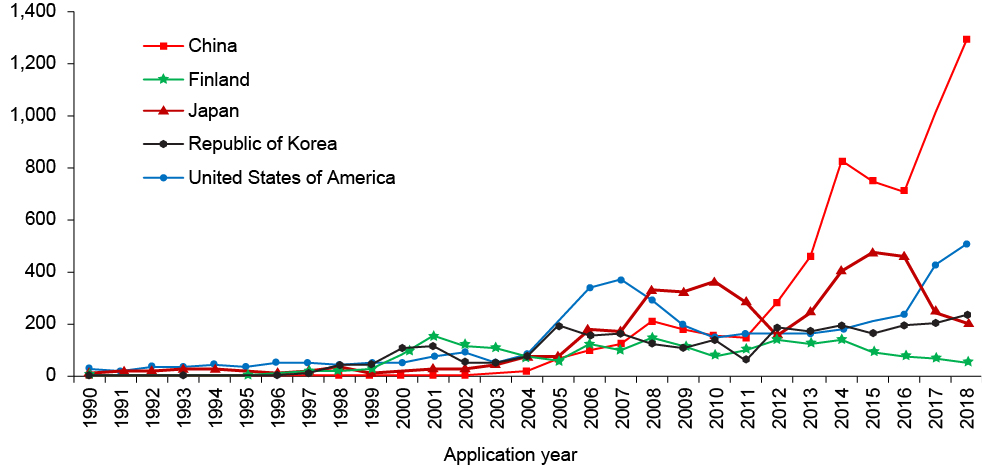
Figure 36 – text version
| Year | China | United States of America | Japan | Republic of Korea | Finland |
|---|---|---|---|---|---|
| 1990 | 0 | 24 | 11 | 0 | 0 |
| 1991 | 0 | 21 | 20 | 1 | 3 |
| 1992 | 0 | 34 | 16 | 0 | 2 |
| 1993 | 0 | 39 | 24 | 6 | 1 |
| 1994 | 0 | 41 | 24 | 0 | 7 |
| 1995 | 0 | 36 | 18 | 3 | 3 |
| 1996 | 0 | 48 | 15 | 3 | 8 |
| 1997 | 6 | 50 | 17 | 9 | 18 |
| 1998 | 1 | 43 | 39 | 41 | 19 |
| 1999 | 3 | 55 | 14 | 43 | 31 |
| 2000 | 4 | 55 | 19 | 110 | 80 |
| 2001 | 0 | 73 | 28 | 112 | 154 |
| 2002 | 3 | 94 | 30 | 50 | 119 |
| 2003 | 8 | 49 | 46 | 49 | 111 |
| 2004 | 21 | 86 | 77 | 77 | 77 |
| 2005 | 69 | 207 | 78 | 195 | 59 |
| 2006 | 103 | 336 | 180 | 157 | 124 |
| 2007 | 123 | 373 | 175 | 166 | 100 |
| 2008 | 213 | 293 | 327 | 122 | 150 |
| 2009 | 176 | 197 | 322 | 105 | 117 |
| 2010 | 153 | 148 | 362 | 138 | 78 |
| 2011 | 150 | 163 | 283 | 61 | 102 |
| 2012 | 279 | 161 | 155 | 184 | 138 |
| 2013 | 462 | 165 | 243 | 173 | 122 |
| 2014 | 824 | 182 | 399 | 197 | 138 |
| 2015 | 744 | 214 | 475 | 163 | 94 |
| 2016 | 704 | 232 | 456 | 191 | 75 |
| 2017 | 1,009 | 423 | 240 | 204 | 66 |
| 2018 | 1,289 | 507 | 203 | 237 | 49 |
Canadian institutions held a total of 372 SEP inventions over that same time period. They recorded high growth in the mid-to-late 2000s, peaking in 2010 with 59 SEP inventions. While Canadian institutions own less SEP inventions than the leading countries, it can be observed that Canada is on par with France, Germany, and the United Kingdom. This is shown in Figure 37, which presents the filing trends for Canadian, French, German, and British institutions.
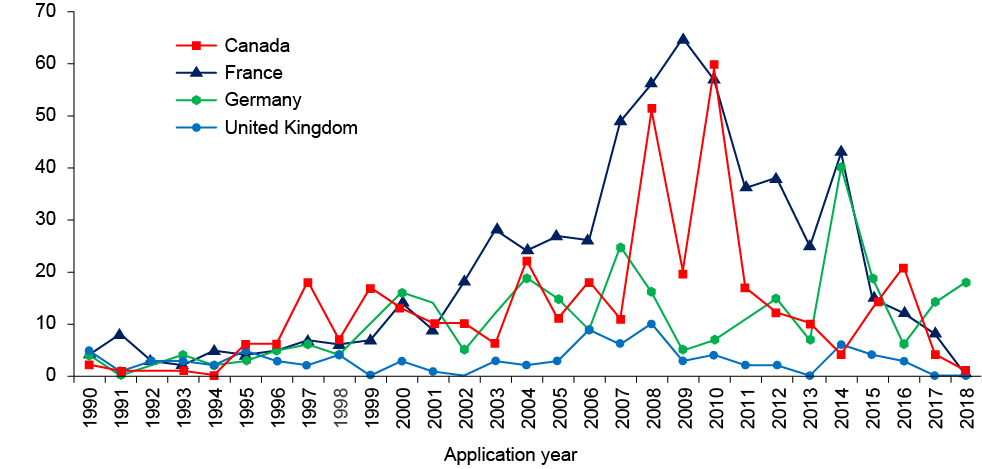
Figure 37 – text version
| Year | France | Canada | Germany | United Kingdom |
|---|---|---|---|---|
| 1990 | 4 | 2 | 4 | 5 |
| 1991 | 8 | 1 | 0 | 1 |
| 1992 | 3 | 1 | 2 | 3 |
| 1993 | 2 | 1 | 4 | 3 |
| 1994 | 5 | 0 | 2 | 2 |
| 1995 | 4 | 6 | 3 | 5 |
| 1996 | 5 | 6 | 5 | 3 |
| 1997 | 7 | 18 | 6 | 2 |
| 1998 | 6 | 7 | 4 | 4 |
| 1999 | 7 | 17 | 10 | 0 |
| 2000 | 14 | 13 | 16 | 3 |
| 2001 | 9 | 10 | 14 | 1 |
| 2002 | 18 | 10 | 5 | 0 |
| 2003 | 28 | 6 | 12 | 3 |
| 2004 | 24 | 22 | 19 | 2 |
| 2005 | 27 | 11 | 15 | 3 |
| 2006 | 26 | 18 | 9 | 9 |
| 2007 | 49 | 11 | 25 | 6 |
| 2008 | 56 | 51 | 16 | 10 |
| 2009 | 65 | 20 | 5 | 3 |
| 2010 | 57 | 59 | 7 | 4 |
| 2011 | 36 | 17 | 11 | 2 |
| 2012 | 38 | 12 | 15 | 2 |
| 2013 | 25 | 10 | 7 | 0 |
| 2014 | 43 | 4 | 40 | 6 |
| 2015 | 15 | 13 | 19 | 4 |
| 2016 | 12 | 21 | 6 | 3 |
| 2017 | 8 | 4 | 14 | 0 |
| 2018 | 0 | 1 | 18 | 0 |
The patent landscape map in Figure 38 shows the key technology fields in which there is a high concentration of SEP inventions.Footnote xxv It superimposes over the white peaks the keywords that appear most frequently throughout the data set. Observing large white peaks around keywords such as "wireless access communication system" and "mobile station apparatus" is consistent with the notion that SEP inventions are tied predominately to the telecommunications sector. This reinforces the notion that SEP inventions are an important factor for succeeding in the Information and communications technology industry.
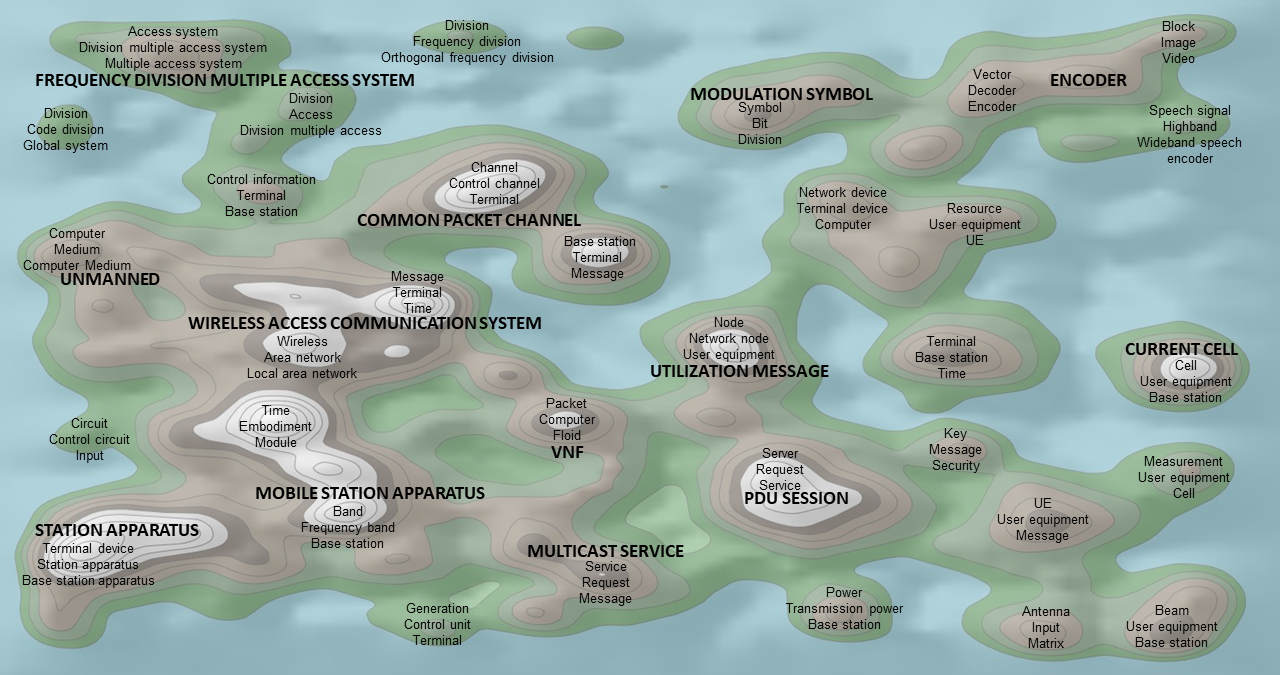
Figure 38 – text version
Figure 7 is a patent landscape map that provides a visual representation of global patent activities in data set in this report. Derwent Innovation's ThemeScape mapping tool was utilized to produce this visualization, using term frequency (keywords from a patents title and abstract) and other algorithms to cluster documents based on shared language. The result is a patent landscape map, a map very much resembling that of a topographic map, where there are sections of turquoise and white. Sections are comprised of peaks, some of which have bright white peaks, representing the highest concentration of patents and are labelled with key terms that tie common themes together. Turquoise is used to separate terms where there is no commonality between them.
Conclusion
In this data set drawn from the leading standard-setting organizations in the world, we find that the number of standard-essential patents (SEPs) inventions has been increasing over the last 2 decades, especially in the information and communications technology industry. This growth in SEP inventions highlights the need for a deeper analysis of the available data. CIPO intends to publish a full-length, comprehensive report on SEP inventions, which will take a much closer look at the SEP landscape in Canada. This report will highlight the Canadian institutions and inventors that hold SEP inventions and the specific technology fields in which they operate.