
On this page
Introduction
As part of Canada's National IP Strategy, the 2018 Canadian budget committed funds to "better understand what groups of Canadians are benefiting the most from intellectual property."Footnote xiv In response, the Survey of Intellectual Property Awareness and Use (IPAU Survey) was developed by Statistics Canada, ISED, and CIPO. The survey was conducted between November 2019 and February 2020, collecting data from a sample of nearly 12,000 observations representing approximately 600,000 Canadian enterprises with at least 1 employee and annual revenues equal to or greater than $30,000. The data stratification covers 15 industry sectors in the North American Industry Classification System (NAICS), in addition to 2 other categories—Information and Communication Technologies and Clean Technologies Industries—, as well as 4 economic regions (Atlantic, Quebec, Ontario, Rest of Canada) and 5 categories of firm size based on the number of employees.
On , Statistics Canada released selected results of the survey.Footnote xvii The summary of the descriptive results from the survey data provided in this report is designed such that 8 IP indicators are analyzed along an innovation path. This path starts with a firm becoming aware of IP and ends with that firm reaping the benefits of holding IP.

Figure 28 – text version
Eight steps in the IP innovation path:
- IP familiar
- Sought IP information
- Has a formal IP strategy
- Filed for IP
- Owns IP in Canada
- Owns IP abroad
- IP important for funding
- Contributions of IP
The 8 steps in the IP innovation path fall into 3 groups:
Group 1
IP awareness
- IP familiar: Firms that reported being familiar with at least 1 type of IP right
- Sought IP information: Firms that sought information on IP in the 3 years prior to completing the survey
- Has a formal IP strategy: Firms reporting having carried out strategic activities related to IP in the 3 years prior to completing the survey
Group 2
IP use
- Filed for IP: Respondents that filed for IP during the 3 years prior to completing the survey
- Owns IP in Canada: Respondents that reported owning IP rights domestically
- Owns IP abroad: Similar to "Owns IP in Canada" indicator but when protection was sought in other jurisdictions
Group 3
IP impacts
- IP Important for funding: IP-holding firms reporting that IP was important for securing funds from external investment sources
- Contributions of IP: IP-holding firms reporting that IP was important to 1 or more the following business contributions in the 3 years prior to completing the survey:
- increased employment
- increased revenues
- increased business value
- expanded markets
- facilitated financing
- provided business collaboration
- strengthened long-term business projects
- positioned business for acquisition
The 6 stratifications used for analysis are firm size, industry, innovation, investments in R&D, exporter status, and high growth.
Descriptive results
The results from the survey confirm what is well known about the positive relationship between IP and firm size. Figure 29 shows that, for almost all the steps in the innovation path, the rates increase with firm size. This is especially true for IP ownership and implementation of formal IP strategies. The first exception relates to the importance of IP for funding: it is natural that larger firms have additional means of financing other than IP, while smaller firms may be more likely to rely on their IP when seeking funding. The second exception relates to recognizing the contributions of IP, which seems to be unanimous and less related to firm size.
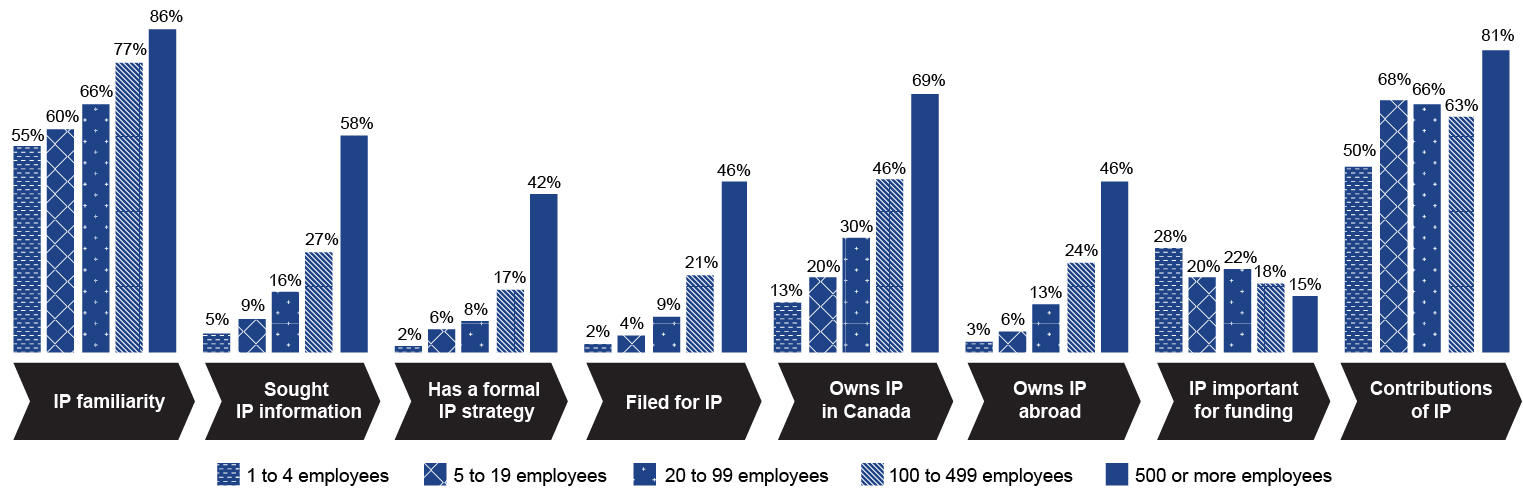
Figure 29 – text version
| IP indicators | 1 to 4 employees | 5 to 19 employees | 20 to 99 employees | 100 to 499 employees | 500 or more employees |
|---|---|---|---|---|---|
| IP awareness | 55% | 60% | 66% | 77% | 86% |
| Sought IP information | 5% | 9% | 16% | 27% | 58% |
| Has a formal IP strategy | 2% | 6% | 8% | 17% | 42% |
| Filed for IP | 2% | 4% | 9% | 21% | 46% |
| Owns IP in Canada | 13% | 20% | 30% | 46% | 69% |
| Owns IP abroad | 3% | 6% | 13% | 24% | 46% |
| IP important for funding | 28% | 20% | 22% | 18% | 15% |
| Contributions of IP | 50% | 68% | 66% | 63% | 81% |
The survey also provides information on industries, specifically Information and
Cultural Industries (NAICS 51) and Clean Technologies Industries, presented in Figure 30. It can be observed that both industries are more familiar with IP, were more likely to seek IP information, and filed for and own more IP than the average for all industries.
Furthermore, firms in Information and Cultural Industries are 1.3 times more likely to recognize the importance of IP for funding, while those in the clean technologies industries category are 1.3 times more likely to perceive the contributions of IP.

Figure 30 – text version
| IP indicators | Clean technologies | Information and cultural industries | All industries |
|---|---|---|---|
| IP awareness | 80% | 85% | 58% |
| Sought IP information | 24% | 22% | 7% |
| Formal IP strategy | 15% | 13% | 4% |
| Filed for IP | 20% | 15% | 4% |
| Owns IP in Canada | 45% | 47% | 18% |
| Owns IP abroad | 24% | 19% | 5% |
| Importance to secure funding | 25% | 42% | 24% |
| Contributions of IP | 77% | 58% | 59% |
There is a strong impact of a firm's exposure to innovation activities in the innovation path. In this survey, respondents are considered innovators if they have carried out 1 or more activities in the following categories in the past 3 years: new or improved goods, new or improved services, and new or improved business process. As shown in Figure 31, compared with non-innovators in Canada, innovators in Canada are 4.8 times more likely than non-innovators to seek information on IP, 4.9 times more likely to have a formal IP strategy, 4.7 times more likely to have filed for IP, and 5.4 times more likely to own IP in other countries.
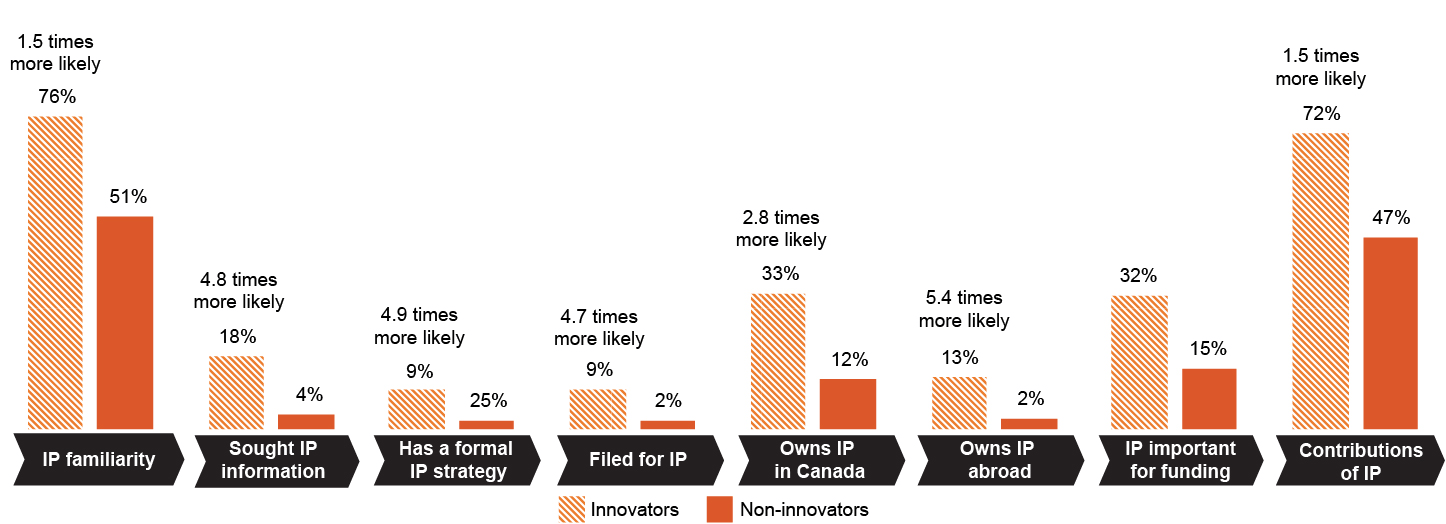
Figure 31 – text version
| IP indicators | Innovators | Non-innovators | Ratios |
|---|---|---|---|
| IP awareness | 76% | 51% | 1.5 |
| Sought IP information | 18% | 4% | 4.8 |
| Formal IP strategy | 9% | 2% | 4.9 |
| Filed for IP | 9% | 2% | 4.7 |
| Owns IP in Canada | 33% | 12% | 2.8 |
| Owns IP abroad | 13% | 2% | 5.4 |
| Importance to secure funding | 32% | 15% | 2.2 |
| Contributions of IP | 72% | 47% | 1.5 |
Similar to the case of innovative activities presented above, the innovation path is much more pronounced for firms that invest in R&D. Some examples from Figure 32 indicate that, compared with their counterparts who did not invest in R&D, Canadian firms investing in R&D are 6.4 times more likely to seek IP information, 7 times more likely to have filed for IP recently, and 8.4 times more likely to hold IP in other countries. Furthermore, these firms are 1.6 times more likely to recognize business contributions of IP.
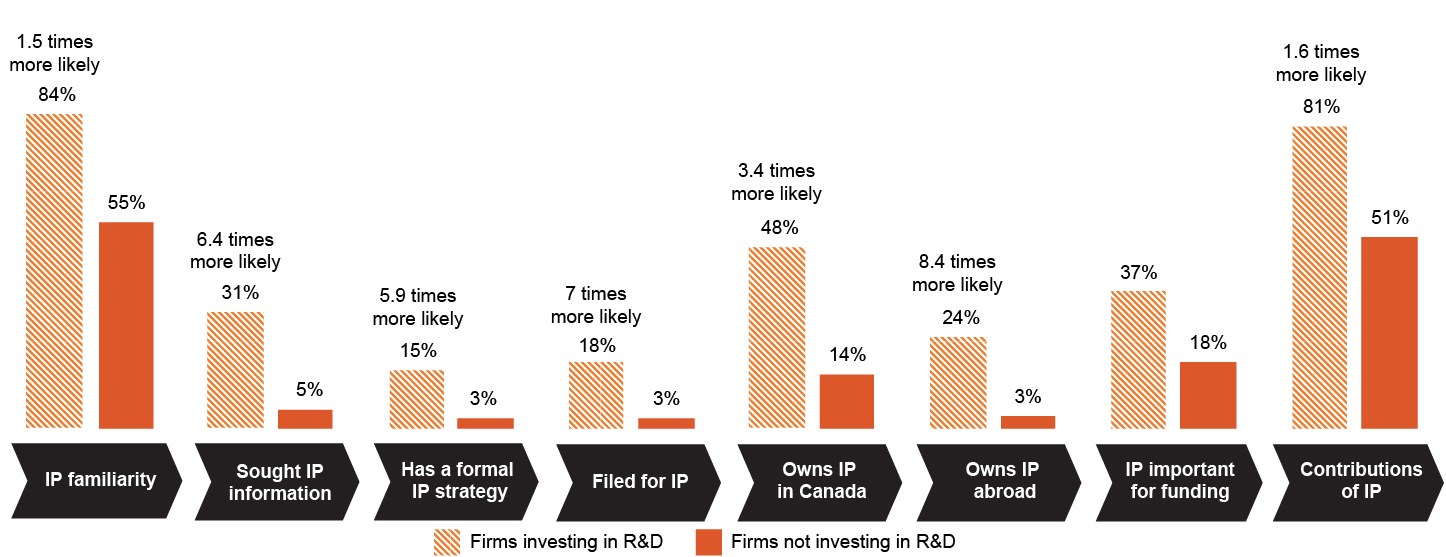
Figure 32 – text version
| IP indicators | Firms investing in R&D | Firms not investing in R&D | Ratios |
|---|---|---|---|
| IP awareness | 84% | 55% | 1.5 |
| Sought IP information | 31% | 5% | 6.4 |
| Formal IP strategy | 15% | 3% | 5.9 |
| Filed for IP | 18% | 3% | 7.0 |
| Owns IP in Canada | 48% | 14% | 3.4 |
| Owns IP abroad | 24% | 3% | 8.4 |
| Importance to secure funding | 37% | 18% | 2.1 |
| Contributions of IP | 81% | 51% | 1.6 |
In a small open economy like Canada's, entering international markets is one of the most important outcomes for Canadian businesses. Figure 33 describes the differences between exporters and non-exporters. Compared with non-exporting firms, exporting firms in Canada are 3.6 times more likely to seek IP information, 4 times more likely
to have a formal IP strategy, and 4.1 times more likely to have recently filed for IP. As expected, the likelihood of owning IP abroad is much higher (6.8 times higher) for exporters than for non-exporters.

Figure 33 – text version
| IP indicators | Exporters | Non-exporters | Ratios |
|---|---|---|---|
| IP awareness | 76% | 60% | 1.3 |
| Sought IP information | 21% | 6% | 3.6 |
| Formal IP strategy | 11% | 3% | 4.0 |
| Filed for IP | 11% | 3% | 4.1 |
| Owns IP in Canada | 36% | 15% | 2.4 |
| Owns IP abroad | 18% | 3% | 6.8 |
| Importance to secure funding | 30% | 23% | 1.3 |
| Contributions of IP | 66% | 58% | 1.1 |
To finalize this summary, Figure 34 looks at the most tangible outcome for an enterprise: growth. The term "high-growth firm" applies when a firm experiences 3 consecutive years with increases in annual revenue greater than 20%. Compared with the average firm, high-growth firms in Canada are 1.8 times more likely to have sought IP information, 1.9 times more likely than to have a formal IP strategy, 2.5 times more likely to have recently filed for IP, and 1.6 times more likely to own IP in Canada. High-growth firms are 2.7 times more likely to own IP abroad, once again showing the importance of entering international markets for a small open economy like Canada.
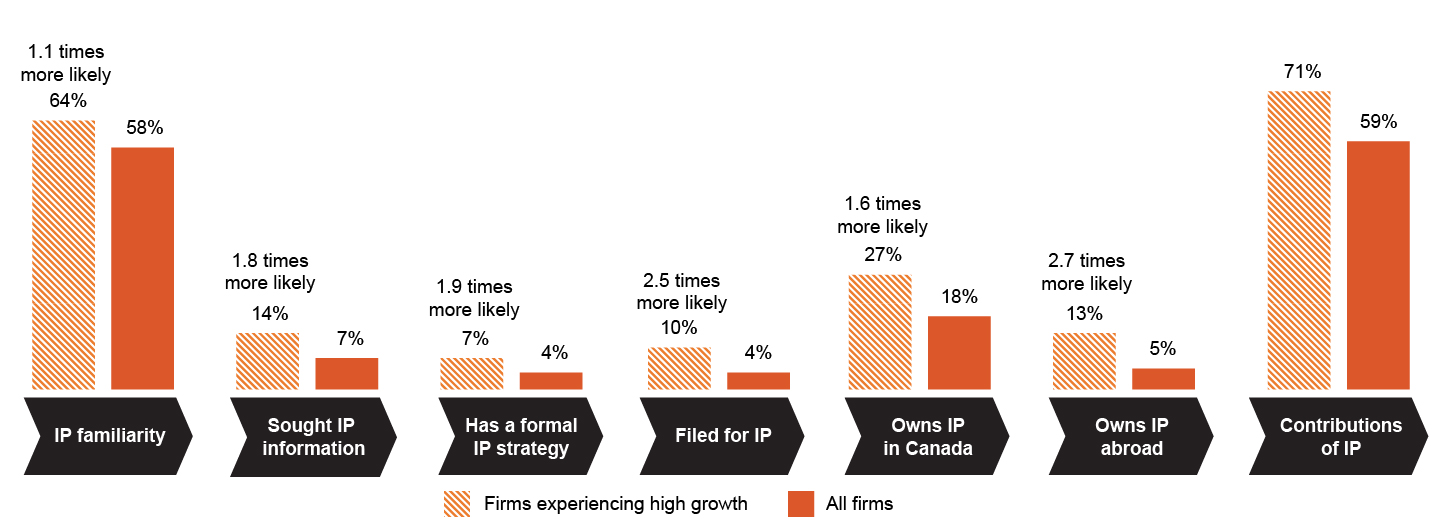
Figure 34 – text version
| IP indicators | Firms experiencing high growth | All firms | Ratios |
|---|---|---|---|
| IP awareness | 64% | 58% | 1.1 |
| Sought IP information | 14% | 7% | 1.8 |
| Formal IP strategy | 7% | 4% | 1.9 |
| Filed for IP | 10% | 4% | 2.5 |
| Owns IP in Canada | 27% | 18% | 1.6 |
| Owns IP abroad | 13% | 5% | 2.7 |
| Contributions of IP | 71% | 59% | 1.2 |
Conclusion
One of the first studies to use data from the IPAU Survey provides key insights into the important relationship between IP awareness and use of IP and the positive outcomes experienced at the firm level. In general, all the steps of the innovation path are more prominent among larger firms, innovators, R&D investors, exporters, high-growth firms, and in certain IP-intensive industries, such as clean technologies. The results revealed new findings, perhaps the most important being that Canadian firms expressed a high level of recognition of the contributions of IP to their business.