
Plant breeders use this form of IP right to protect their new varieties, obtaining exclusive rights in relation to the propagating material (seeds, cuttings, budwood, etc.) of their plant variety. Plant varieties can be grouped into agricultural plants (cereals, pulses, potatoes, oilseeds and forages) and horticulture plants (fruits, vegetables and ornamentals). In Canada, the plant breeders' rights IP regime is administered by the Canadian Plant Breeders' Rights Office (PBRO), within the Canadian Food Inspection Agency (CFIA).
Plant breeders' rights applications filed in Canada
In 2020, the PBRO received 337 plant breeders' rights applications, the first decrease since 2015 (Figure 24). This could be attributed to the effects of the COVID-19 crisis on plant breeder activity. Furthermore, the decrease is observed only in non-resident activity, given that the number of resident filings (75) did not show any variation compared with 2019 while non-resident filings decreased from 295 units in 2019 to 262 in 2020.
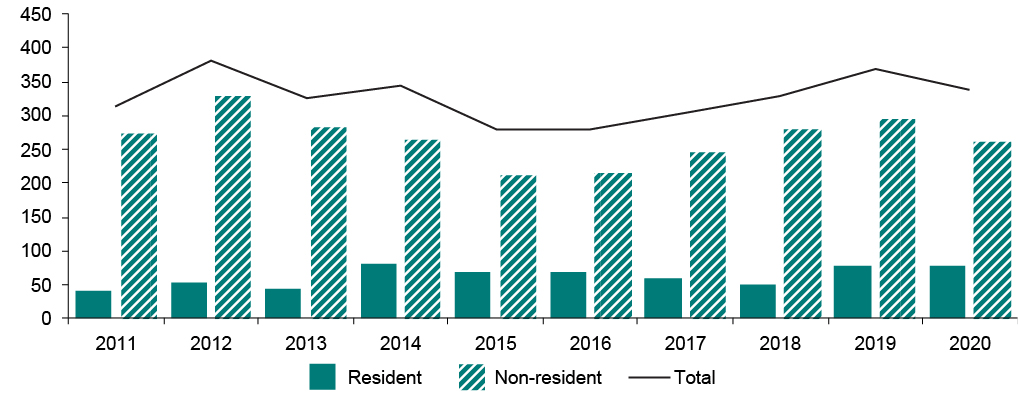
Figure 24 – text version
| Year | Resident | Non-resident | Total |
|---|---|---|---|
| 2011 | 38 | 274 | 312 |
| 2012 | 51 | 330 | 381 |
| 2013 | 42 | 283 | 325 |
| 2014 | 80 | 263 | 343 |
| 2015 | 66 | 212 | 278 |
| 2016 | 66 | 214 | 280 |
| 2017 | 59 | 244 | 303 |
| 2018 | 50 | 280 | 330 |
| 2019 | 75 | 295 | 370 |
| 2020 | 75 | 262 | 337 |
According to Figure 25, 22% of plant breeders' rights applications were received from residents while non-residents were responsible for 78% of the total applications, demonstrating the reliance of international varieties in the Canadian marketplace. A total of 40% of the filings came from the United States, which saw 135 applications and a balanced proportion of agriculture and horticulture varieties, an increase of 4% compared with applications filed in 2019. This figure also suggests that the decline in filings in 2020 was driven mainly by a drop of 44% in filings originating from the Netherlands, compared with 2019.
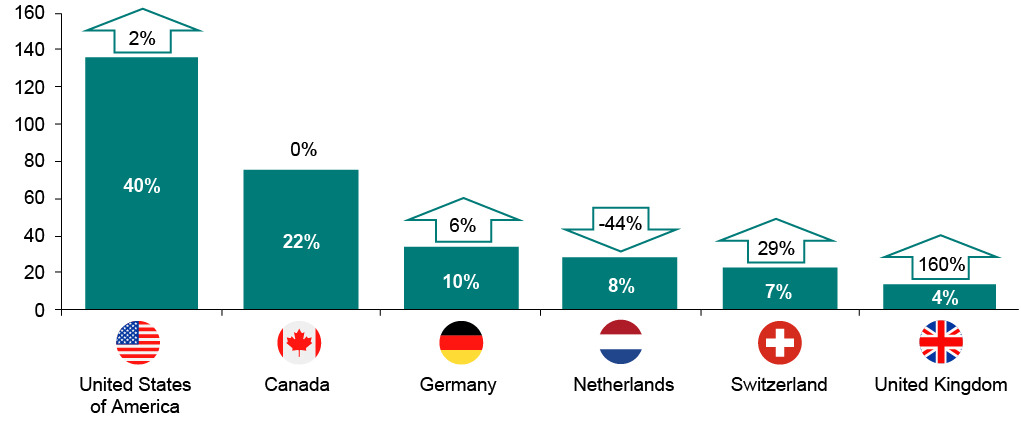
Figure 25 – text version
| PBR applications by country of origin | 2020 | % of total | Δ 2019 |
|---|---|---|---|
| United States of America | 135 | 40% | 2% |
| Canada | 75 | 22% | 0% |
| Germany | 33 | 10% | 6% |
| Netherlands | 28 | 8% | -44% |
| Switzerland | 22 | 7% | 29% |
| United Kingdom | 13 | 4% | 160% |
Interesting insights on plant breeders' rights activity can be obtained when the filing trends are broken down by variety group, presented next.
Filing activity by variety group – Horticultural
Filings for horticultural plants—fruits, vegetables, and ornamentals—are heavily weighted by non-resident activity, while resident applications represented only 7% of the total for this variety group in 2020. Consequently, non-resident filings are the main driver, which explains the shape of the filing trend shown in Figure 26. The PBRO received 169 applications in 2020, 26 (13%) fewer than in 2019. Over the last decade, the highest number of horticultural filings occurred in 2012, with a total of 282 applications.
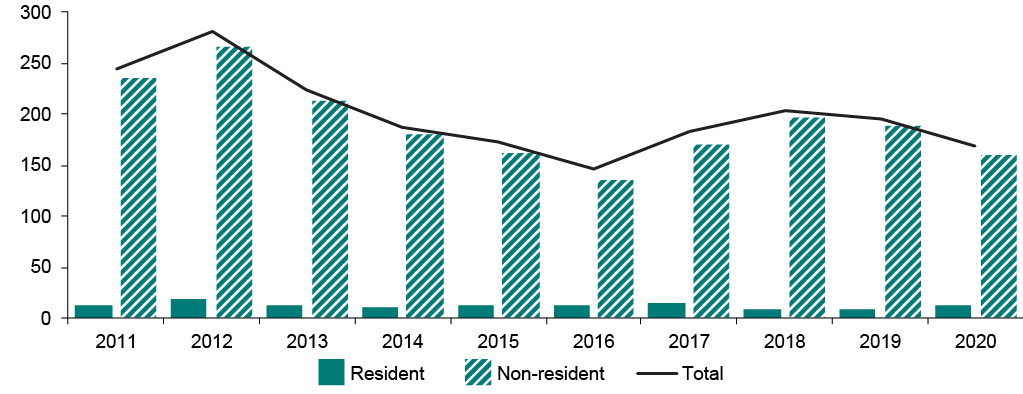
Figure 26 – text version
| Year | Resident | Non-resident | Total |
|---|---|---|---|
| 2011 | 11 | 234 | 245 |
| 2012 | 17 | 265 | 282 |
| 2013 | 12 | 211 | 223 |
| 2014 | 9 | 179 | 188 |
| 2015 | 11 | 161 | 172 |
| 2016 | 11 | 135 | 146 |
| 2017 | 14 | 169 | 183 |
| 2018 | 7 | 196 | 203 |
| 2019 | 8 | 187 | 195 |
| 2020 | 11 | 158 | 169 |
Filing activity by variety group – Agricultural
Resident filing activity for agricultural plants—cereals, pulses, potatoes, oilseeds, and forages—is higher than that for horticulture plants. In 2020, resident filings represented 38% of total filings. Within the last decade, this proportion reached its lowest in 2013 (29%) and peaked in 2015 (52%), the only time over that 10-year period that resident filings were higher than non-resident filings. The PBRO received 168 applications for agricultural varieties in 2020, 7 units less than in the previous year, when the number of filings had reached its highest.
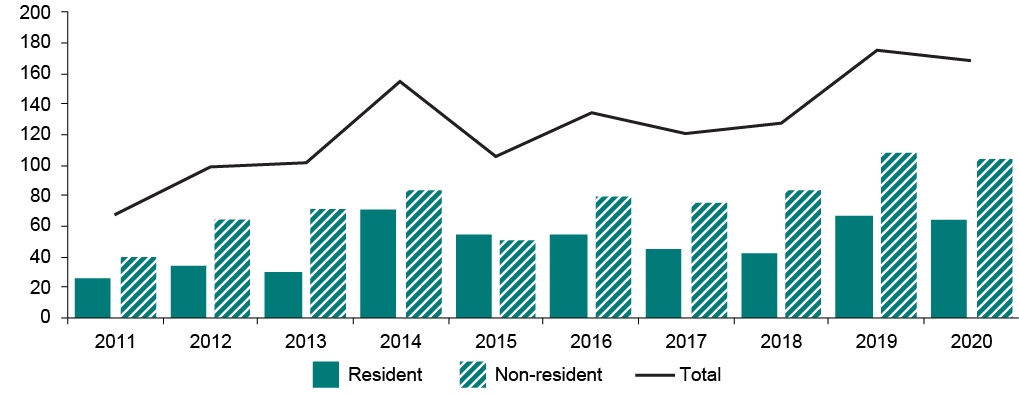
Figure 27 – text version
| Year | Resident | Non-resident | Total |
|---|---|---|---|
| 2011 | 27 | 40 | 67 |
| 2012 | 34 | 65 | 99 |
| 2013 | 30 | 72 | 102 |
| 2014 | 71 | 84 | 155 |
| 2015 | 55 | 51 | 106 |
| 2016 | 55 | 79 | 134 |
| 2017 | 45 | 75 | 120 |
| 2018 | 43 | 84 | 127 |
| 2019 | 67 | 108 | 175 |
| 2020 | 64 | 104 | 168 |
Conclusion
Plant breeders' rights trends in Canada are characterized by a strong presence of non-resident activity, especially in the horticultural area, while resident filings are concentrated primarily in the agricultural group. Applications in Canada grew over the past 5 years, until 2019, leading to a slight dip in 2020. While this 4% drop could be attributed to the effects of the COVID-19 pandemic, new data will enable a more in-depth analysis on the resilience of this IP right to the economic crisis.