
Inventions can be developed, used, and sold within the specified legal protection period that is granted by governments through patents. In this way, patents provide a means to profit from new inventions while revealing, during the protection phase, detailed technical knowledge to the public, fostering innovation locally and globally. In terms of volume, CIPO received 34,565 patent filings from residents and non-residents in 2020, representing the first decrease since 2016. Interestingly, this overall reduction was a result of a decrease in foreign applications and was not offset by the incremental increase in resident activity. Patent applications filed abroad by Canadians remained steady in 2019.
On this page
Patent applications filed in Canada
Despite the effects of a worldwide recession brought on by the pandemic, resident patent applications at CIPO grew 5% in 2020, offsetting a 3% decrease in 2019. Contrary to what happened in 2019, the overall 5% decrease in patent filings in 2020 is attributed to a 7% decrease in non-resident activity, which makes up 87% of CIPO's patent applications. Figure 2 presents a 10-year trend, showing that non-resident filings have returned to 2016 levels, after a slow but consistent increase since that year. Heavily influenced by non-resident activity, the total patent filing trend has followed a similar tendency over the 10-year period, dropping 5% in 2020 alone and 2% over the decade.

Figure 2 – text version
| Year | Resident | Non-resident | Total |
|---|---|---|---|
| 2011 | 4,754 | 30,357 | 35,111 |
| 2012 | 4,709 | 30,533 | 35,242 |
| 2013 | 4,567 | 30,174 | 34,741 |
| 2014 | 4,198 | 31,283 | 35,481 |
| 2015 | 4,277 | 32,687 | 36,964 |
| 2016 | 4,078 | 30,667 | 34,745 |
| 2017 | 4,053 | 30,969 | 35,022 |
| 2018 | 4,349 | 31,812 | 36,161 |
| 2019 | 4,238 | 32,250 | 36,488 |
| 2020 | 4,452 | 30,113 | 34,565 |
The top 6 filing countries at CIPO in 2020 are shown in Figure 3. With 45% of all filings, the United States is by far CIPO's top applicant, with 15,652 applications. This represents a 6% decrease in application volumes, compared with those of 2019. Canadian applicants, represented by Canada, remain in second position, with 4,452 applications. With a 5% increase in 2020, Canada was the only top patent filer whose applications at CIPO observed a positive growth in the year the COVID-19 pandemic started. Germany and Japan retained their positions in third and fourth, with 1,967 and 1,446 filings, respectively. A sizable decrease in filings originating from France has helped push China up from sixth to fifth position in 2020. A smaller decrease in applications from China made that country move from sixth to fifth position in 2020 with 1,426 filings, switching places with France, with 1,380 counts.
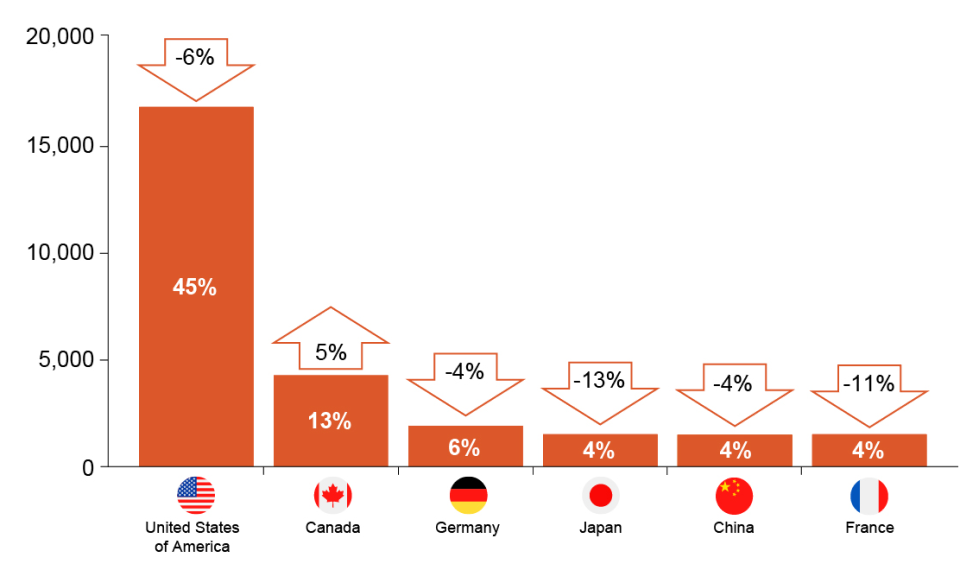
Figure 3 – text version
| Patents by country of origin | 2020 | % of total | Δ 2020 |
|---|---|---|---|
| United States of America | 15,652 | 45% | -6% |
| Canada | 4,452 | 13% | 5% |
| Germany | 1,967 | 6% | -4% |
| Japan | 1,446 | 4% | -13% |
| China | 1,426 | 4% | -4% |
| France | 1,380 | 4% | -11% |
Figure 4 disaggregates filings at CIPO by filing route. The PCT system allows applicants to designate multiple signatory countries in a single application. Applicants have the option to file using this system or the traditional way of applying at each individual office of the jurisdiction where protection is sought. These are known as "direct filings." In 2020, 6,985 applications were filed using the direct route and 27,580 through the PCT route. These levels represent a 12% and 3% decrease, respectively, compared with 2019. The decrease in direct filings can be attributed largely to the 19% decline in direct filings from the United States. Over the last 10 years, however, the share of applicants using the PCT system has been trending upward, reaching a historical high of 80% in 2020, which was achieved only once before, in 2015, as shown in Figure 4. The high rates of use highlight the PCT system as excellent choice for patent filings in Canada.

Figure 4 – text version
| Year | Direct | PCT | % PCT (right axis) |
|---|---|---|---|
| 2011 | 8,352 | 26,759 | 76% |
| 2012 | 8,338 | 26,904 | 76% |
| 2013 | 8,114 | 26,627 | 77% |
| 2014 | 8,030 | 27,451 | 77% |
| 2015 | 7,571 | 29,393 | 80% |
| 2016 | 7,724 | 27,021 | 78% |
| 2017 | 7,672 | 27,350 | 78% |
| 2018 | 7,765 | 28,396 | 79% |
| 2019 | 7,911 | 28,577 | 78% |
| 2020 | 6,985 | 27,580 | 80% |
Patent applications filed abroad by Canadians
Canadian applicants patent internationally to protect their inventions abroad. Patent filings abroad by Canadians were up 1% in 2019. The long-term trend is positive, as Figure 5 indicates, with a 3% increase between 2010 and 2019 and nearly no growth since 2015, following notable volatility between 2010 and 2014.
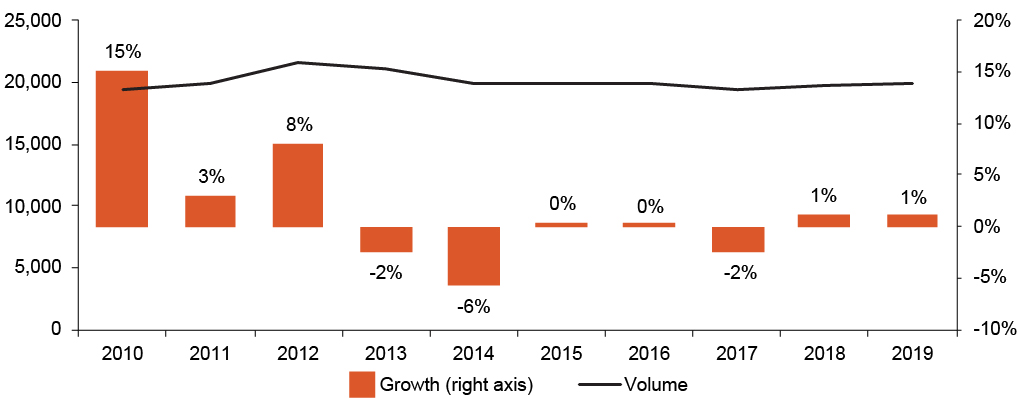
Figure 5 – text version
| Year | Volume | Growth (right axis) |
|---|---|---|
| 2010 | 19,397 | 15% |
| 2011 | 19,962 | 3% |
| 2012 | 21,543 | 8% |
| 2013 | 21,019 | -2% |
| 2014 | 19,826 | -6% |
| 2015 | 19,889 | 0% |
| 2016 | 19,900 | 0% |
| 2017 | 19,461 | -2% |
| 2018 | 19,684 | 1% |
| 2019 | 19,898 | 1% |
Figure 6 presents the top 5 destinations for Canadian patent applicants in 2019. The United States, the European Patent Office (EPO), and China have for some time retained their first, second, and third positions, with 13,432, 1,839, and 1,168 applications, respectively. Also, the United States increased its share of Canadian filings from 66% in 2018 to 68% in 2019, while EPO increased its share from 8% to 9% over that same period, further consolidating the presence of Canadian innovation in those 2 markets. Australia represents the fourth leading destination with 568 filings, an increase of 20% relative to Canadian filing activity in 2018. The Republic of Korea was the fifth destination, with 410 applications. Combined, these 5 jurisdictions represent 88% of all international patenting by Canadians, with almost 7 of every 10 patent applications destined for Canada's main trading partner, the United States.

FFigure 6 – text version
| Top 5 destinations | 2019 | % of total |
|---|---|---|
| United States of America | 13,432 | 68% |
| European Patent Office | 1,839 | 9% |
| China | 1,168 | 6% |
| Australia | 568 | 3% |
| Republic of Korea | 410 | 2% |
Applications abroad by Canadians from 2010 to 2019 by filing route are presented in Figure 7. Of the total applications abroad in 2019, Canadians filed for 12,499 patents using the direct route and 7,399 using the PCT system. PCT filings represented 37% of the total, a 1% decline compared with 2018. Combining patent applications from the 2 filing routes, Canadians filed for a total of 19,898 patents abroad.
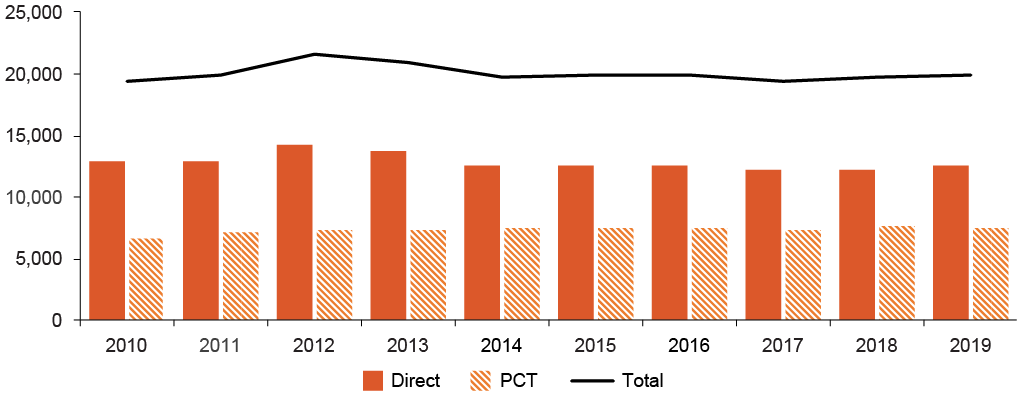
Figure 7 – text version
| Year | Direct | PCT | Total |
|---|---|---|---|
| 2010 | 12,880 | 6,517 | 19,397 |
| 2011 | 12,902 | 7,060 | 19,962 |
| 2012 | 14,254 | 7,289 | 21,543 |
| 2013 | 13,706 | 7,313 | 21,019 |
| 2014 | 12,461 | 7,365 | 19,826 |
| 2015 | 12,426 | 7,463 | 19,889 |
| 2016 | 12,437 | 7,463 | 19,900 |
| 2017 | 12,130 | 7,331 | 19,461 |
| 2018 | 12,173 | 7,511 | 19,684 |
| 2019 | 12,499 | 7,399 | 19,898 |
Conclusion
Patent activity in Canada in 2020 has been characterized by a 5% decline in total activity, driven largely by a 7% decrease in non-resident filings. The silver lining for 2020, however, is the 5% increase in domestic filings at CIPO. Overall, applications abroad by Canadians have remained steady during the last 5 years, with a 1% increase in 2019 and a 3% increase since 2010.