
Industrial designs refer to the visual appearance of a finished article. By registering an industrial design, the proprietor obtains an exclusive right to the design, preventing competitors from using the same or a substantially similar design applied to the same or analogous finished article. CIPO received 8,064 industrial designs in 2020, representing a 20% increase compared with 2019. Overall, industrial design activity has increased 54% over the past 10 years, driven mainly by non-resident activity.
On this page
Industrial designs filed in Canada
Figure 18 presents industrial designs filed at CIPO over a period of 10 years by residency status. A total of 8,064 industrial designs were filed in Canada in 2020, with a notable 20% increase compared with 2019. Of particular note for 2020, the month of April represented a record-breaking month for industrial design activity in Canada, with a total of 919 filings.
Of the total, 763 designs were filed by residents and 7,301 by non-residents. The 54% growth over 10 years is reflective of a steady increase in demand for industrial design protection in Canada, especially from international applicants. In fact, the number of industrial designs filed by non-residents have grown 65% since 2011. On the other hand, designs by residents were down 3% compared with 2011, due largely to 3 consecutive years of decline between 2017 and 2019. The 919 filings in April represented a record- breaking month for industrial design activity in Canada.
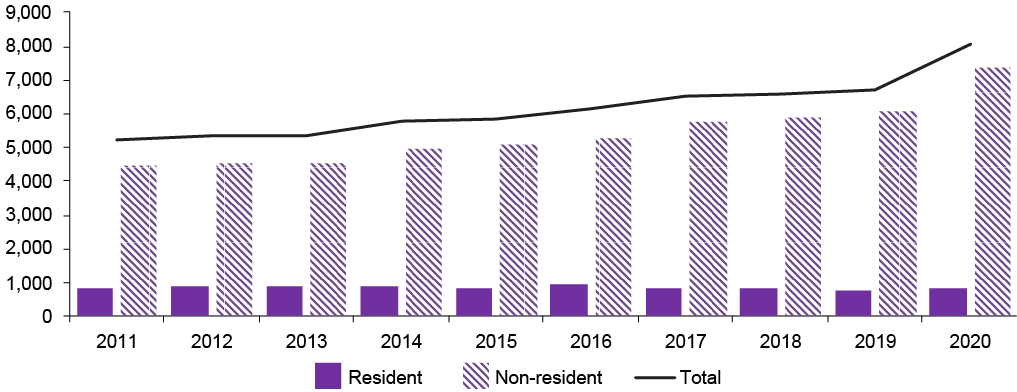
Figure 18 – text version
| Year | Resident | Non-resident | Total |
|---|---|---|---|
| 2011 | 790 | 4,437 | 5,227 |
| 2012 | 847 | 4,515 | 5,362 |
| 2013 | 846 | 4,500 | 5,346 |
| 2014 | 859 | 4,908 | 5,767 |
| 2015 | 797 | 5,049 | 5,846 |
| 2016 | 916 | 5,254 | 6,170 |
| 2017 | 815 | 5,718 | 6,533 |
| 2018 | 760 | 5,821 | 6,581 |
| 2019 | 694 | 6,014 | 6,708 |
| 2020 | 763 | 7,301 | 8,064 |
Figure 19 shows the top 6 countries filing for industrial designs in Canada in 2020. Compared with 2019, designs filed in 2020 from the United States increased 9%, solidifying Canada's neighbour as the top filer at CIPO, with 3,651 designs and 45% of all industrial design filing activity. Canada retained its second place as Canadians increased their filings in 2020 by 10%, with a total of 763 designs. Switzerland occupies the third place with 7% of the total activity, while China is fourth with 5%. More striking, however, is the respective increase of 72% and 97% in filings from these countries, compared with 2019. Germany and the United Kingdom complete the ranking, with Germany holding 4% of the total activity and a 17% increase compared with the previous year, while the United Kingdom increased its activity in Canada by 19% and was attributed with 3% of the designs filed in Canada. Combined, the industrial designs from these countries account for 65% of all filings in Canada and 71% of all non-resident activity.

Figure 19 – text version
| Industrial designs by country of origin | 2020 | % of total | Δ 2020 |
|---|---|---|---|
| United States of America | 3,651 | 45% | 9% |
| Canada | 763 | 9% | 10% |
| Switzerland | 544 | 7% | 72% |
| China | 432 | 5% | 97% |
| Germany | 345 | 4% | 17% |
| United Kingdom | 244 | 3% | 19% |
Since the implementation of the Hague Agreement in 2018, CIPO has been able to receive industrial design applications via the Hague system. "International registrations designating Canada" is the term used to identify international applications filed via the Hague system that were registered by WIPO and sent to CIPO for examination. Of the 8,064 industrial designs received in 2020, a total of 2,948 were designs in international registrations that designated Canada. These designs represented 37% of the total received in Canada and 40% of the designs filed by non-residents. This indicates the increasing importance of the Hague system as filing option, considering that those 2 rates were 20% and 22% only 1 year before. Figure 20 presents the use of the Hague system by non-residents designating Canada,Footnote xiii showcasing the United Stated as the top Hague user filing in Canada, with 508 designs in international registrations; however, the proportion of those designs as a share of the total designs filed in Canada from that country is 14%. This rate is low when compared with that of the other 5 top filing countries, ranging from 74% in Italy to 86% in both Switzerland and the Republic of Korea. Clearly, non-resident applicants perceive Canada and the United States as a highly integrated market, and naturally, industrial design protection will be sought in the 2 jurisdictions, further justifying the use of the Hague system.
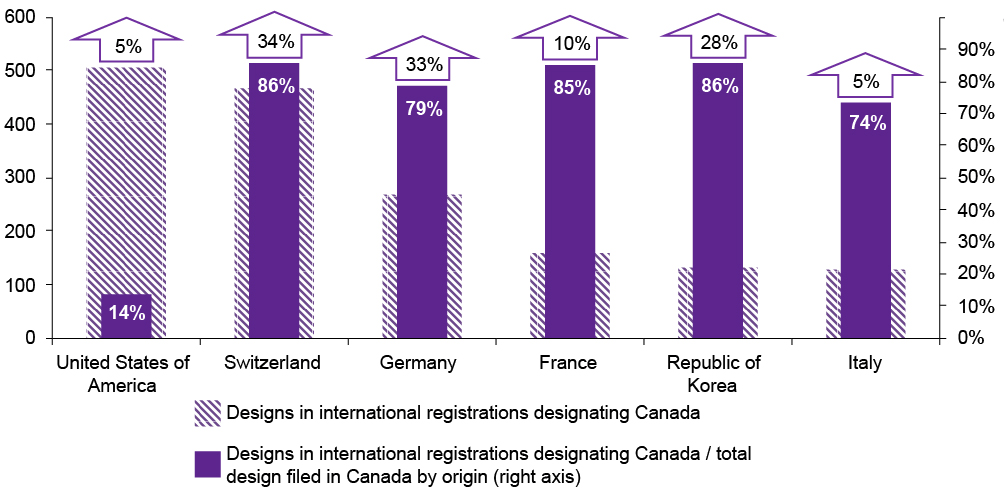
Figure 20 – text version
| Country of origin | Designs in international registrations designating Canada | Designs in international registrations designating Canada / total design filed in Canada by origin (right axis) | Δ 2020 |
|---|---|---|---|
| United States of America | 508 | 14% | 5% |
| Switzerland | 467 | 86% | 34% |
| Germany | 271 | 79% | 33% |
| France | 159 | 85% | 10% |
| Republic of Korea | 133 | 86% | 28% |
| Italy | 130 | 74% | 5% |
Applications made via the Hague system can include up to 100 designs. The 2,948 designs received by CIPO from WIPO in 2020 were filed through 1,239 international registrations. This means that, on average, there were 2.4 designs per international registration. This ratio is slightly higher than that of the United States but below that of other top filing countries. Figure 21 ranks offices in descending order on the basis of the number of international registrations that designated the offices and presents the ratio of designs per international registration at the end of each bar.

Figure 21 – text version
| Office | International registrations | Designs in international registrations | Ratio |
|---|---|---|---|
| Singapore | 991 | 3,079 | 3.1 |
| Russian Federation | 1,101 | 2,828 | 2.6 |
| Canada | 1,239 | 2,948 | 2.4 |
| Turkey | 1,266 | 5,663 | 4.5 |
| Republic of Korea | 1,272 | 3,038 | 2.4 |
| United Kingdom | 1,721 | 6,523 | 3.8 |
| Japan | 2,031 | 3,471 | 1.7 |
| Switzerland | 2,039 | 10,070 | 4.9 |
| United States of America | 2,845 | 6,612 | 2.3 |
| European Union Intellectual Property Office | 4,888 | 17,084 | 3.5 |
Industrial designs filed abroad by Canadians
The trend in international industrial designs filed by Canadians from 2010 to 2019 is provided in Figure 22.Footnote xiv Canadians filed for 1,807 designs abroad in 2019, representing a 10% increase over 2018. Approximately 20% of these designs were filed using the Hague system. Since 2010, designs have grown 21%, a result of the volatile behaviour of this series, with periods of high growth like those of 2012, 2016 and 2018 offset by periods of notable negative growth like in 2015 and 2017.
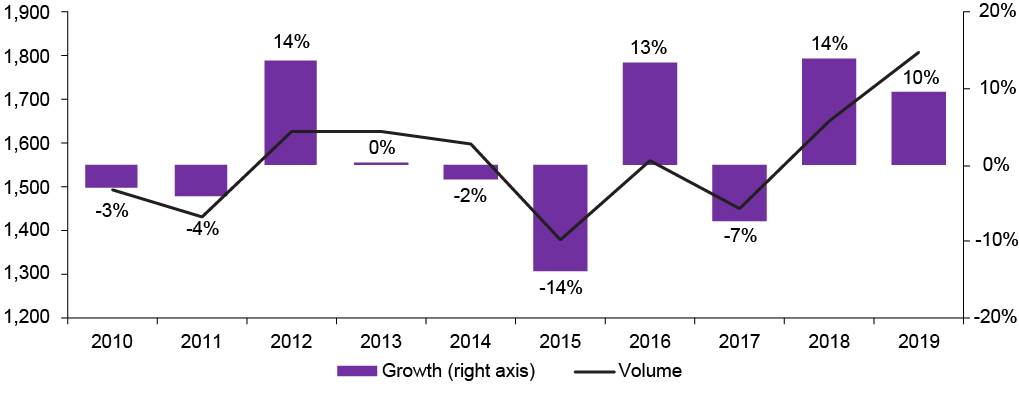
Figure 22 – text version
| Year | Volume | Growth (right axis) |
|---|---|---|
| 2010 | 1,494 | -3% |
| 2011 | 1,433 | -4% |
| 2012 | 1,628 | 14% |
| 2013 | 1,629 | 0% |
| 2014 | 1,600 | -2% |
| 2015 | 1,379 | -14% |
| 2016 | 1,562 | 13% |
| 2017 | 1,448 | -7% |
| 2018 | 1,650 | 14% |
| 2019 | 1,807 | 10% |
Canada implemented the Hague Agreement on . Therefore, 2019 represents the first full year with Canadian applicants being able to file for industrial designs through that route. WIPO data indicate that the top 6 designated contracting parties by Canadians using the Hague system were EUIPO (81 designs), Canada (61),Footnote xv the United States (52), the United Kingdom (32), the Russian Federation (20), and the Republic of Korea (18).
The top 3 international destinations of industrial designs by Canadians in 2019 are presented in Figure 23. The United States is once again the top destination, with 905 designs, representing an increase of 9% in its share compared with 2018; this destination represents 50% of the designs in applications filed abroad by Canadians. The 238 designs filed at EUIPO, the second top destination, represented a 6% annual increase. Conversely, Canadian industrial designs filed in China experienced a 6% decrease between 2018 and 2019, with 150 counts. Combined, the top 3 destinations represented 72% of the share of designs filed abroad by Canadians, 2% less than the share observed in 2018 (74%).
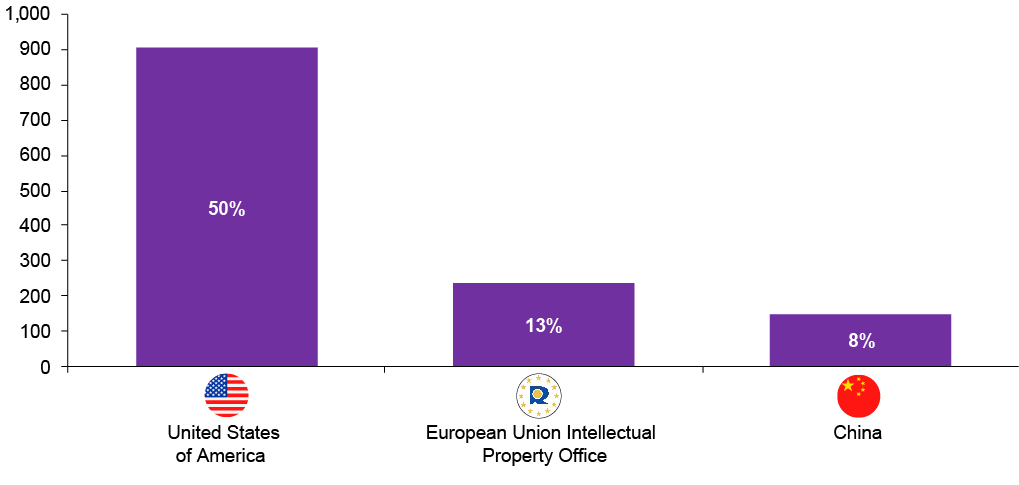
Figure 23 – text version
| Top 3 destinations | 2019 | % of total |
|---|---|---|
| United States of America | 905 | 50% |
| European Union Intellectual Property Office | 238 | 13% |
| China | 150 | 8% |
Conclusion
The number of industrial designs filed at CIPO has grown 54% since 2011. Resident filing activity is still 3% below 2011 levels but experienced an annual increase of 10% in 2020, demonstrating resilience to the pandemic. In 2020, a notable increase of 17% in the number of designs received by CIPO via the Hague system was observed, with designs filed through this route representing 37% of the total filed in Canada. Designs filed abroad by Canadians increased by 21% since 2010. International data from 2019 revealed the use of the Hague system by Canadians, signaling EUIPO, Canada, and the United States as the top designated contracting parties.