
The ability to protect words, designs, sounds, shapes, or colours used to distinguish goods and services make trademarks a key element in a branding strategy.Footnote ix Trademark applications at CIPO and abroad by Canadians have experienced uninterrupted growth. The positive growth in filings at CIPO during 2020 would, in principle, suggest an important degree of resilience to the negative effects of the pandemic. This section of the report delves into applications filed with CIPO in 2020, shedding light on how the pandemic impacted trademark activity depending on the origin and area of trade.
On this page
- Trademarks applications filed in Canada
- Trademarks and the COVID-19 economic crisis
- Trademark applications filed abroad by Canadians
- Conclusion
Trademarks applications filed in Canada
In 2020, 69,793 trademark applications were filed with CIPO, establishing a new record, with a 2% increase from 2019. From this total, 27,963 applications were from residents, while 41,830 were originated by non-residents. Figure 8 presents the 10-year trends, disaggregating the filings by origin. Since 2011, trademark applications at CIPO grew 44%, resident filings increased 31% and non-resident activity grew by 54%. In 2020, applications from residents saw a year-over-year decrease of 2%, the first reduction since 2013. Non-resident filings, on the other hand, have shown uninterrupted growth in the last decade and a 5% increase in 2020, confirming the interest among foreign IP holders in protecting their brands in Canada and the successful implementation of the Madrid Protocol.
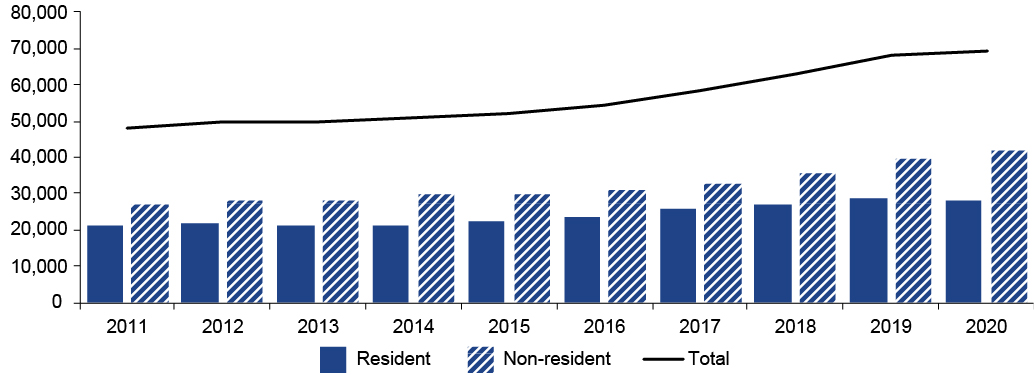
Figure 8 – text version
| Year | Resident | Non-resident | Total |
|---|---|---|---|
| 2011 | 21,337 | 27,135 | 48,472 |
| 2012 | 21,741 | 28,369 | 50,110 |
| 2013 | 21,449 | 28,370 | 49,819 |
| 2014 | 21,348 | 29,680 | 51,028 |
| 2015 | 22,589 | 29,872 | 52,461 |
| 2016 | 23,652 | 31,013 | 54,665 |
| 2017 | 25,853 | 33,060 | 58,913 |
| 2018 | 27,320 | 35,738 | 63,058 |
| 2019 | 28,608 | 39,669 | 68,277 |
| 2020 | 27,963 | 41,830 | 69,793 |
Figure 9 presents the top 6 countries of origin for trademark filings at CIPO for 2020. Canada was once again the top filing country, with 27,963 applications. The United States, China, the United Kingdom, Germany, and France all retained their respective positions in the 2020. The share of participation in total filings, however, has suffered some shifts because of a general decrease in filings by major countries of origin, with the notable exception of China, which increased its trademark applications at CIPO by 84%, almost doubling the size of its share, from 5% in 2019 to 9% in 2020.
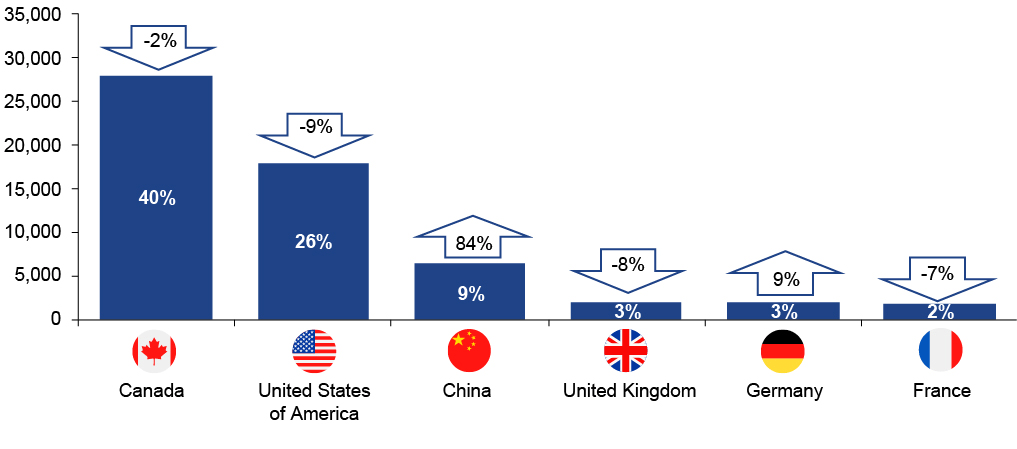
Figure 9 – text version
| Trademarks by country of origin | 2020 | % of total | Δ 2020 |
|---|---|---|---|
| Canada | 27,963 | 40% | -2% |
| United States of America | 18,015 | 26% | -9% |
| China | 6,514 | 9% | 84% |
| United Kingdom | 2,059 | 3% | -8% |
| Germany | 1,927 | 3% | 9% |
| France | 1,524 | 2% | -7% |
The year 2020 was the first full year where Canada was as member of the Madrid Protocol. Of the 41,830 non-resident applications received in 2020, 18,895 were filed using the Madrid system,Footnote x representing an impressive 45% of non-resident filings and 27% of the total trademark filing activity at CIPO.
The notable differences across countries of origin in their use of the Madrid system is presented in Figure 10. This figure sorts the top 6 countries of origin in terms of the number of international applications designating Canada, indicating what these Madrid filings represent to each country in terms of their total trademark filing activity at CIPO. The United States, for example, was the top Madrid filer designating Canada in 2020, with 5,789 applications, representing 32% of the total applications filed with CIPO by applicants from that country. The next most important Madrid applicants filed smaller amounts; however, the proportion of international filings designating Canada over their total trademark filing activity at CIPO was especially high among European countries, ranging from 69% (United Kingdom) to 84% (Germany). This reaffirms the idea that many European applicants see Canada and the United States as an integrated market, which may explain their strong preference to use the Madrid system when seeking trademark protection in Canada, considering that the Madrid system is more cost-effective when filing in 2 or more jurisdictions.
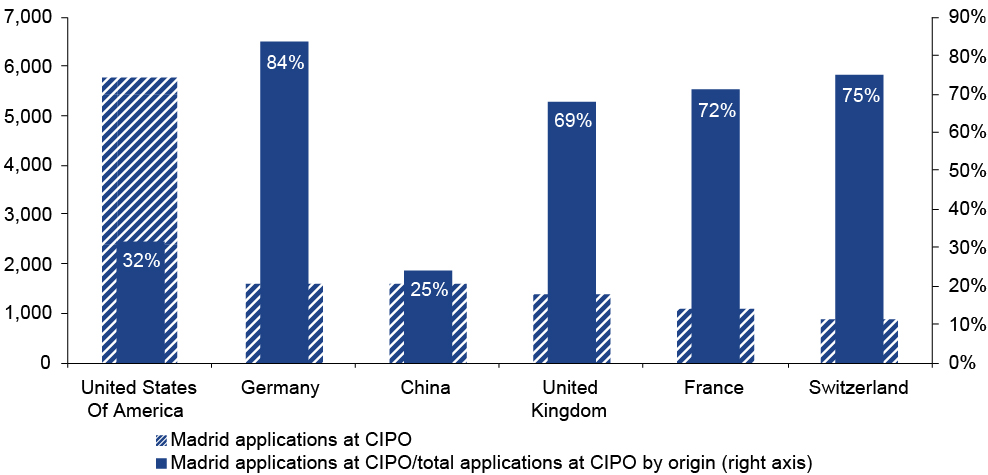
Figure 10 – text version
| Country of origin | Madrid applications at CIPO | Madrid applications at CIPO/total applications at CIPO by origin (right axis) |
|---|---|---|
| United States Of America | 5,789 | 32% |
| Germany | 1,620 | 84% |
| China | 1,604 | 25% |
| United Kingdom | 1,413 | 69% |
| France | 1,091 | 72% |
| Switzerland | 902 | 75% |
Trademarks and the COVID-19 economic crisis
In December 2019, a novel virus first known as severe acute respiratory syndrome coronavirus 2 (later called SARS-CoV-2, or COVID-19) was identified in Wuhan, China. That month, the first lockdowns began in China. On , the World Health Organization (WHO) declared the outbreak a public health emergency of international concern, and on , the WHO declared the coronavirus disease a global pandemic. The speed to react and establish lockdowns as well as their intensities varied among countries. These lockdowns included curfews and restrictions on daily life that affected economic activities. In Canada's case, all aspect of the life of Canadians was affected by the largest public health crisis in 100 years.
As mentioned above, trademark filings at CIPO increased in 2020. The purpose of this special subsection on trademarks is to show that the overall increase in activity has not been homogeneous across the applicants' countries of origin and lines of trade.
Trademark activity at CIPO during economic crises
Similar to what was observed in other economic series,Footnote xi trademark activity deviated from its long-run trend and grew to higher levels while the economy contracted. This marked the first time within the past 50 years that trademark filings in Canada increased, while the Canadian gross domestic product (GDP) experienced a negative shock. Figure 11 shows that the trademark activity at CIPO and the economic crises experienced by Canada since 1980 were generally correlated, but such correlation was not observed in 2020 amid the COVID-19 crisis.
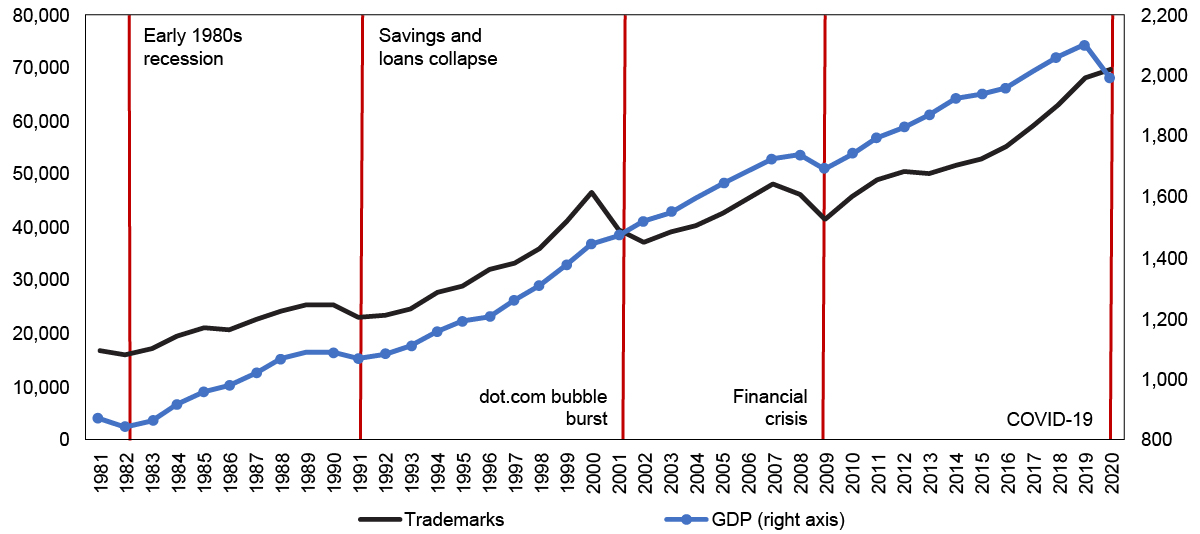
Figure 11 – text version
| Year | Trademarks | GDP (right axis) |
|---|---|---|
| 1981 | 16,906 | 871 |
| 1982 | 16,234 | 844 |
| 1983 | 17,474 | 866 |
| 1984 | 19,464 | 917 |
| 1985 | 21,129 | 960 |
| 1986 | 20,791 | 981 |
| 1987 | 22,598 | 1,021 |
| 1988 | 24,326 | 1,066 |
| 1989 | 25,642 | 1,090 |
| 1990 | 25,422 | 1,092 |
| 1991 | 23,229 | 1,069 |
| 1992 | 23,694 | 1,079 |
| 1993 | 24,864 | 1,108 |
| 1994 | 27,802 | 1,157 |
| 1995 | 28,963 | 1,189 |
| 1996 | 32,187 | 1,208 |
| 1997 | 33,259 | 1,260 |
| 1998 | 35,955 | 1,309 |
| 1999 | 41,040 | 1,376 |
| 2000 | 46,783 | 1,448 |
| 2001 | 39,629 | 1,473 |
| 2002 | 37,298 | 1,518 |
| 2003 | 39,376 | 1,545 |
| 2004 | 40,560 | 1,593 |
| 2005 | 42,559 | 1,644 |
| 2006 | 45,605 | 1,687 |
| 2007 | 48,294 | 1,722 |
| 2008 | 46,121 | 1,740 |
| 2009 | 41,448 | 1,689 |
| 2010 | 45,794 | 1,741 |
| 2011 | 48,991 | 1,796 |
| 2012 | 50,620 | 1,827 |
| 2013 | 50,296 | 1,870 |
| 2014 | 51,576 | 1,923 |
| 2015 | 52,838 | 1,936 |
| 2016 | 55,113 | 1,955 |
| 2017 | 59,266 | 2,015 |
| 2018 | 63,058 | 2,064 |
| 2019 | 68,277 | 2,102 |
| 2020 | 69,793 | 1,991 |
For this reason, since the onset of the pandemic, forecasts have been largely overstated as a result of the unexpected degree to which consumers and firms altered their behaviour, which helped steer the economy away from a starker decline. The heightened levels of adaptability brought about shifts in demand. Trademarks present an opportunity to protect consumer demand allocated towards a specific brand and have shown to be well correlated with private consumption. Large shocks to consumer demand occurred during the pandemic as businesses and IP holders found or developed new products, services, or ways to extract utility in the new virtually driven economy.
Trademark activity at CIPO by origin
Trademarks can play a significant role in helping extend demand for a specific brand, good, or service both domestically and internationally. As such, they have shown to be linked with imports and exports. Consequently, the first step in identifying the factors associated with an increase in trademark filing activity in Canada is to understand its origin. Figure 12 presents the top 6 origins of trademark filings in Canada, this time in year-to-year variations in filings since 2016. Filings from China grew more in 2020 than in the 4 preceding years (annual increase of 84% in 2020) with such filings making up the majority of China's growth in trademarks, while Germany showed some resilience and the others suffered contractions.
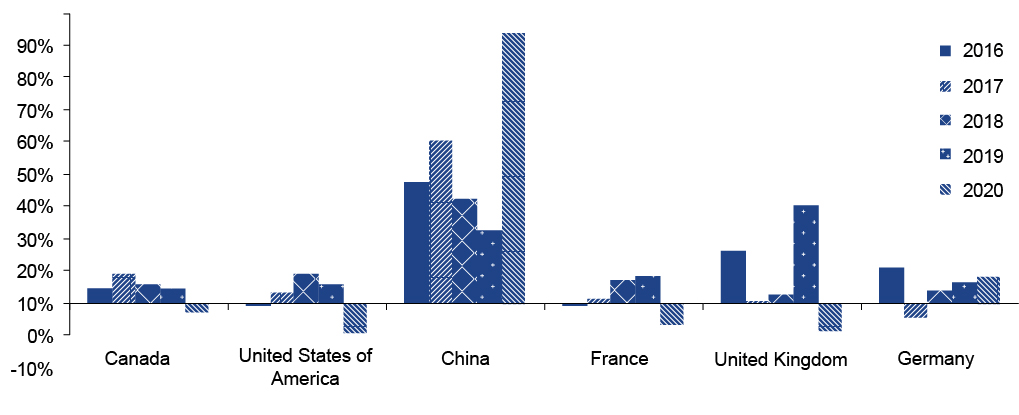
Figure 12 – text version
| Trademarks by country of origin | 2015 | 2016 | 2017 | 2018 | 2019 | 2020 | Δ 2016 | Δ 2017 | Δ 2018 | Δ 2019 | Δ 2020 |
|---|---|---|---|---|---|---|---|---|---|---|---|
| Canada | 22,589 | 23,652 | 25,853 | 27,320 | 28,608 | 27,963 | 5% | 9% | 6% | 5% | -2% |
| China | 1,052 | 1,446 | 2,175 | 2,885 | 3,541 | 6,514 | 37% | 50% | 33% | 23% | 84% |
| France | 1,383 | 1,379 | 1,398 | 1,502 | 1,631 | 1,524 | 0% | 1% | 7% | 9% | -7% |
| Germany | 1,505 | 1,670 | 1,597 | 1,664 | 1,775 | 1,927 | 11% | -4% | 4% | 7% | 9% |
| United States of America | 16,724 | 16,592 | 17,107 | 18,702 | 19,835 | 18,015 | -1% | 3% | 9% | 6% | -9% |
| United Kingdom | 1,432 | 1,668 | 1,681 | 1,722 | 2,248 | 2,059 | 16% | 1% | 2% | 31% | -8% |
The growth in Chinese filings aligns with the 14% increase in Canadian imports that country in 2020.Footnote xii Chinese firms demonstrated a capacity to increase production and exports during the first half of 2020 while firms in other economies were required to cease or alter their operations, limiting their output capacities.
Trademark activity at CIPO by lines of trade
It is suspected that the increase in trademark filings was fostered by the surge of new areas and shifts in consumer demand. For instance, the stay-at-home orders brought on unprecedented demand for at-home gym equipment, home renovations, quality office furniture, and telecommunications, given the high demand for broadband internet access and devices.
CIPO conducted a natural language processing analysis that broke down and grouped the names of the internal goods and services classes linked on an application. In doing so, CIPO was able to generate intuitive clusters of common terms, which can be interpreted as "lines of trade." With these models, it is possible to estimate the probability that an application could fall within a specific area of trade by assessing the observation's goods or services wording. The reader should be aware that the text data used is only available in English. The words that are presented in the French version of this or other reports are not intended to show the results of the analysis performed using French words, but the translation to French of the results of the analysis using English words.
After calculating the probabilities and assigning the applications to an area of trade, a trend analysis was conducted. Figure 13 presents the 10 lines of trade that observed the highest increase in trademark activity between 2019 and 2020, suggesting that the risk of disease transmission increased the demand for medical devices and hygiene-related solutions, while stay-home measures and the implementation of telework practices brought about the largest growth rates in demand for products and services necessary to set up remote access to work, communications (for both work and reducing the effects of personal isolation), and home leisure.
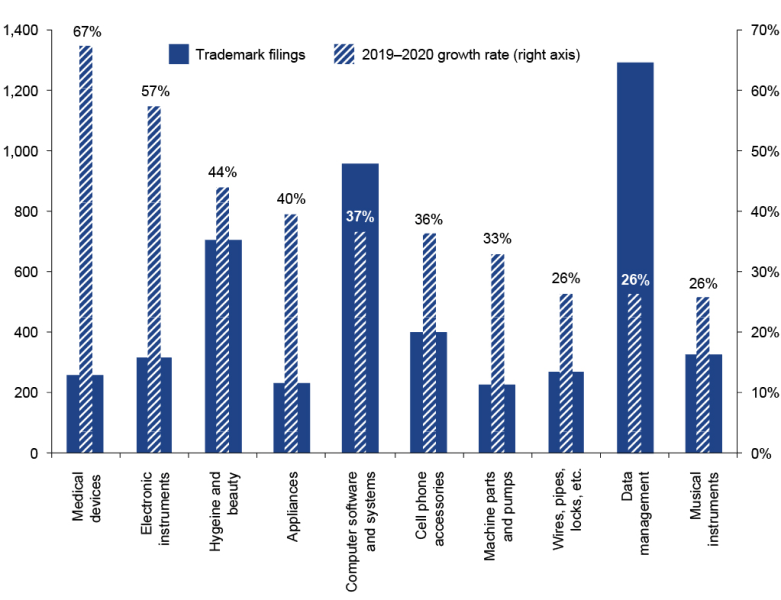
Figure 13 – text version
| Area of business | Trademark filings | 2019-2020 growth rate (right axis) |
|---|---|---|
| Medical Devices |
257 | 67% |
| Electronic instruments |
314 | 57% |
| Hygiene and beauty |
706 | 44% |
| Appliances | 227 | 40% |
| Computer software and systems |
954 | 37% |
| Cell phone accessories |
400 | 36% |
| Machine parts and pumps |
222 | 33% |
| Wires, pipes, locks, etc. |
266 | 26% |
| Data management |
1,295 | 26% |
| Musical Instruments |
325 | 26% |
Figure 14 is a word cloud for the medical devices line of trade. This area of trade experienced the greatest percentage increase in 2020, due to a surge in demand for equipment designed to mitigate the spread of viral diseases.

If the analysis is restricted to filings coming solely from China, it is found that the computer software and disease treating/limiting lines of trade experienced the highest levels of growth, as Figure 15 suggests.

Trademark applications filed abroad by Canadians
Between 2012 and 2019, trademark filing activity abroad by Canadians experienced uninterrupted growth, validating the notion that Canadian applicants recognize the importance of protecting their brands internationally. Canada filed 26,049 trademark applications abroad in 2019, representing an 8% increase compared with 2018 and more than doubling 2010 volumes. Of this total, about 7% was filed using the Madrid system, a relatively high proportion considering that the Madrid Protocol was implemented in Canada on , and available to Canadian applicants for approximately only 6 months of the year.
The 10-year trend for trademark filings abroad and annual growth rates are presented in Figure 16. Except for 2012, application volumes have consistently grown every year since the 2008 financial crisis.
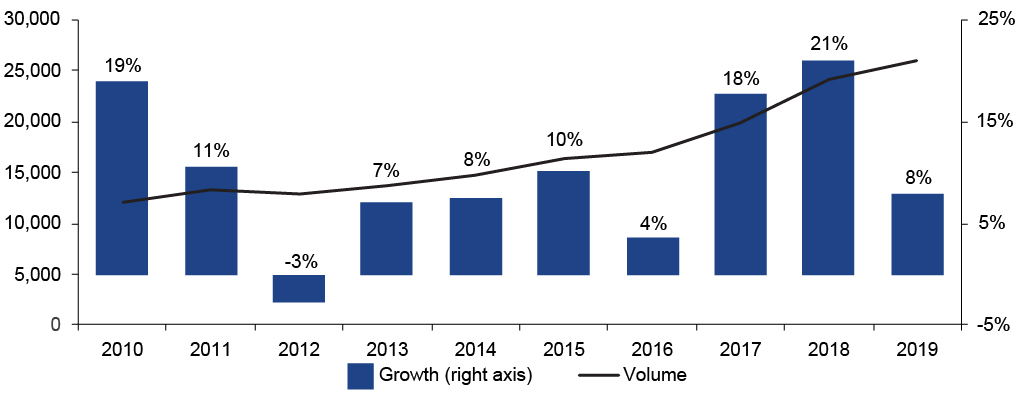
Figure 16 – text version
| Year | Volume | Growth (right axis) |
|---|---|---|
| 2010 | 11,980 | 19% |
| 2011 | 13,244 | 11% |
| 2012 | 12,882 | -3% |
| 2013 | 13,800 | 7% |
| 2014 | 14,838 | 8% |
| 2015 | 16,345 | 10% |
| 2016 | 16,937 | 4% |
| 2017 | 19,953 | 18% |
| 2018 | 24,133 | 21% |
| 2019 | 26,049 | 8% |
The top 5 international destinations for Canadian trademark applicants are shown in Figure 17. The United States continues to be the main destination with 9,794 filings in 2019, accounting for 38% of the trademark activity abroad by Canadians. China retained its position as the second preferred destination, with 5,287 applications (20% of the total applications abroad), representing a 17% increase compared with 2018 and more than 3 times the number of applications filed in 2010. With 1,719 applications and 7% of the share of international activity, European Union Intellectual Property Office (EUIPO) represents the third highest jurisdiction for trademark filings by Canadians; the 2019 volumes show a year-to-year increase of 10% and almost a doubling over the last 10 years. Mexico and the United Kingdom are the fourth and fifth destinations of choice by Canadian applicants, with 1,283 and 746 trademark filings, respectively.

Figure 17 - text version
| Top destinations | 2019 | % of total |
|---|---|---|
| United States of America | 9,794 | 38% |
| China | 5,287 | 20% |
| European Union Intellectual Property Office | 1,719 | 7% |
| Mexico | 1,283 | 5% |
| United Kingdom | 746 | 3% |
Conclusion
Despite the negative effects of the economic crisis caused by the COVID-19 pandemic, trademark application volumes saw an annual increase of 2% in 2020. A more in-depth analysis indicates that such growth was driven by filings from some non-resident origins, with China being the most noticeable case (an 84% increase in trademark filings in Canada compared with 2019). Non-resident filings in 2020 have also been characterized by an increasing preference for the Madrid system. This was especially true among European countries, whose proportion of Madrid applications designating Canada to their total filings at CIPO was over 70%. For trademark filing activity abroad by Canadians, it increased by 8% in 2019 and has more than doubled since 2010.